ASTER/USDT at Critical Demand Zone - Breakdown or Trend ReversalASTER/USDT on the Daily (1D) timeframe is still moving within a dominant bearish trend, characterized by a consistent lower high and lower low structure since the previous peak. Price is currently approaching a key demand zone, highlighted by the yellow block at 0.713 – 0.655, which is a critical area for potential price reaction.
---
Pattern Explanation
Price action is developing inside a Descending Channel (Bearish Channel):
The upper trendline (red) acts as a dynamic resistance.
The lower trendline (yellow) acts as a dynamic support.
As long as price remains inside this channel, the overall market structure stays bearish.
Currently, price is trading near the lower boundary of the channel, aligning with a strong horizontal demand zone, increasing the probability of a technical rebound.
---
Key Levels
Support (Demand Area):
0.713 – 0.655 → Major demand zone (yellow block)
0.540 → Next historical low if support breaks
Resistance:
0.790 → Minor resistance
0.910 → Structural resistance
1.060 → Key resistance / channel midpoint
1.380 – 1.510 → Major resistance zone
2.080 – 2.305 → Upper distribution area
---
Bullish Scenario
Price holds and reacts strongly from the 0.713 – 0.655 demand zone.
Formation of bullish rejection patterns such as long lower wicks or bullish engulfing candles on the daily timeframe.
Potential upside targets:
0.790
0.910
1.060 (key level for broader trend shift confirmation)
A strong bullish confirmation occurs if price breaks and closes above the descending channel’s upper trendline.
Note: Without a channel breakout, any upside movement should still be considered a relief rally or corrective move.
---
Bearish Scenario
Price breaks down and closes below 0.655 on a daily basis.
The demand zone fails to absorb selling pressure.
Downside continuation targets:
0.540
Lower boundary of the descending channel
This breakdown would confirm a bearish continuation structure.
---
Conclusion
ASTER/USDT is currently trading at a critical decision zone.
The 0.713 – 0.655 area will determine whether price:
Experiences a technical bounce, or
Continues its bearish trend.
Traders are advised to wait for clear price action confirmation, as this zone represents a high-risk, high-reward area.
#ASTERUSDT #CryptoAnalysis #TechnicalAnalysis #DescendingChannel #BearishTrend #DemandZone #SupportResistance #AltcoinAnalysis #PriceAction
Aster

ASTERUSDT: Daily Descending Wedge Breakout SetupASTER is forming a descending wedge on the daily timeframe, a structure that typically resolves bullishly after prolonged downside pressure. Price has been compressing between converging lower highs and lower lows, indicating seller exhaustion rather than aggressive continuation.
Price is now pushing into wedge resistance, where a daily close above the upper trendline would confirm a breakout and signal a potential trend reversal or continuation move.
Key notes:
- Well-defined descending wedge structure
- Momentum stabilizing after extended sell-off
- Clear breakout level with tight invalidation
- Favorable risk-to-reward if breakout confirms
A successful breakout could lead to a strong expansion toward the upper resistance zone, while failure would likely result in further consolidation within the structure.
Cheers
Hexa

ASTER/USDT – Potential Trend Reversal or Bearish Continuation?On the 12H timeframe, ASTER/USDT is still moving within a primary downtrend, clearly defined by a descending trendline acting as dynamic resistance. After a strong sell-off, price has formed a lower consolidation base and is now attempting a pullback toward the descending trendline.
Overall market structure remains bearish, although early signs of a short-term recovery are beginning to appear.
---
Pattern & Structure Explanation
Descending Trendline (Major Resistance):
The price has been rejected multiple times along this trendline, confirming strong seller dominance.
Base Formation / Small Rounded Bottom:
Price has created a higher low from the 0.65 – 0.69 zone, indicating weakening selling pressure.
Pullback Structure:
The current move is still a retracement, not a confirmed structural breakout.
Technically, price is trading within a decision zone between reversal and continuation.
---
Key Levels
Resistance Zones:
0.905
0.970
1.070
1.185
1.400 (major supply zone)
Support Zones:
0.780 (minor support / current price area)
0.690
0.654 (major low / invalidation level)
---
Bullish Scenario
The bullish scenario becomes valid if:
Price breaks and closes strongly above the descending trendline
Supported by increasing volume
Upside targets:
1. 0.905 – initial resistance
2. 0.970 – 1.070 – key supply-demand flip zone
3. 1.185 – mid-term resistance
4. 1.400 – optimistic target if momentum accelerates
Technical implication:
Trendline break = trend reversal confirmation
Market structure shifts from lower highs to higher highs
---
Bearish Scenario
The bearish scenario remains in play if:
Price fails to break the descending trendline
Strong rejection or bearish candle formation appears near resistance
Downside targets:
1. 0.780 – short-term support
2. 0.690 – demand zone
3. 0.654 – previous low (critical support)
If 0.654 breaks:
Downtrend continuation is confirmed
Bearish structure remains intact
Risk of printing a new lower low
---
Conclusion
ASTER/USDT is currently trading at a critical decision area.
The primary trend remains bearish, but reversal potential exists if a confirmed trendline breakout occurs.
Best approach:
Wait for confirmation
Breakout → follow bullish momentum
Rejection → anticipate bearish continuation
Structure and key levels should guide trading decisions.
---
#ASTER #ASTERUSDT #CryptoAnalysis #TechnicalAnalysis #Altcoin #Downtrend #Trendline #Breakout #SupportResistance #PriceAction #MarketStructure

Aster putting in some work within the rage. Aster price has reclaimed short-term structure and is holding above the mid-range support, keeping the bias constructive. The recent push stalled right below a major supply zone where prior breakdown resistance and heavy volume meet.
If buyers can hold the higher low, a clean acceptance above this level opens the door for a move back into the upper range, where price can travel quickly. Lose support, and ASTER likely rotates back into the high-volume demand zone below before the next attempt higher.
This is compression, not breakdown direction comes next.

ASTER $1 NEXT DO NOT WAIT OR MISS!Aster has CZ from #Binance interest. There is value here in my opinion based off that alone!
Next we have my analysis which shows the next draw on liquidity which should be around $1.
Calculate Your Risk/Reward so you don't lose more than 1% of your account per trade.
Every day the charts provide new information. You have to adjust or get REKT.
Love it or hate it, hit that thumbs up and share your thoughts below!
This is not financial advice. This is for educational purposes only.

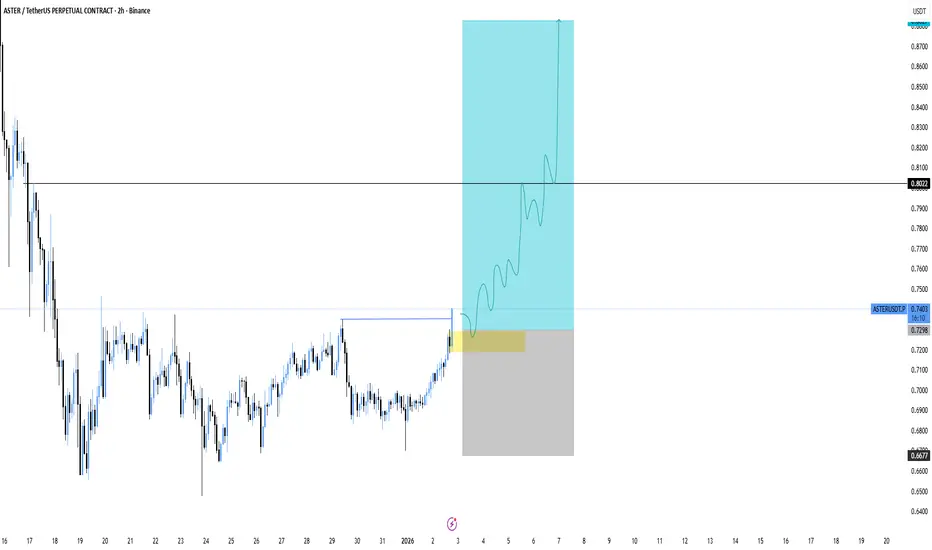
ASTERUSDT – Potential Exploding from here!ASTER has completed a solid recovery phase and is now breaking into a key reaction area. Price is holding well after the push up, suggesting buyers are still in control and opening room for continuation toward higher levels.
Entry: 0.7300 - 0.74
Stoploss: 0.6677
Targets:
0.8032
0.8827
As long as price holds above the entry zone, the continuation scenario remains valid. A loss of this area would invalidate the setup and signal caution.
ASTERUSDT UPDATE#ASTER
UPDATE
ASTER Technical Setup
Pattern: Falling Wedge Pattern
Current Price: 0.701$
Target Price: 0.717$
Target % Gain: 100.58%
Technical Analysis: ASTER is breaking out of a falling wedge pattern on the 1D chart, indicating bullish potential. The price has recently surged above the resistance trendline, supported by an increase in volume. The setup is validated as the price approaches the key resistance areas.
Time Frame: 1D
Risk Management Tip: Always use proper risk management.

ASTERUSDT: Descending Triangle Breakdown – Bearish Targets AheadASTER has formed a clear descending triangle on the daily timeframe. Price is compressing toward a horizontal support level , indicating decreasing volatility and pressure building for a breakout.
The structure remains bearish, with lower highs respecting the descending trendline while support is repeatedly tested. A confirmed breakdown below the horizontal support would likely trigger strong continuation to the downside.
After the support break, I expect price to move toward the following targets:
$0.55
$0.40
As long as price stays below the descending trendline, the bearish scenario remains valid.

ASTERUSDT.P | Clone or Clown? My Short Hedge ASTERUSDT.P | Clone or Clown? My Short Hedge 🎭📉
This is no Hyperliquid. It’s a clone and a clown — and that makes it a perfect hedge candidate for me right now.
Price is stuck in a falling channel with clear breakout and breakdown levels forming:
🔻 Short Breakdown Target: 0.7325
⚠️ Key Pivot: 1.0371
📈 Bullish Breakout: 1.1223
🎯 Upper Fib Zones: 1.4021 → 1.5166 → 1.9590
I'm leaning short here, but this is tactical — not emotional. If it flips above the channel, I’ll adapt. Until then, this is my hedge .
Charts will tell you when and what. Don’t rush the move.
Mindset Check 🧘
Sometimes the trade isn’t about belief — it’s about balance . A solid hedge doesn’t care about the narrative. It just does its job.
Disclaimer: I’m just sharing wisdom, not instructions. No licenses, no guarantees — just years of trading scars and precision chartwork. Be smart, protect your capital, and don’t copy blindly.
One Love,
The FXPROFESSOR 💙
PS:
A whale friend of mine is stacking ASTER slowly. His take? “I only buy things with crooks behind them — they’re the ones who make it.” 😅
He’s bullish. I’m tactical. We made a bet:
If I get to buy at 0.7325 , I win. Let’s see who the market loves more — the whale or the daytrader?

THE - Update!TSX:THE / USDT - Update:
My medium-term outlook remains unchanged 📈
Wave 3 hasn't even started yet!🚀
Very bullish fundamentals & chart structure (daily).
Short term doesn't matter to me here 📈
Review my previous analyses for more levels!
Key support to be maintained; 0.1680$ & 0.1630$ (daily close) ⚠️
📊 Key S/R levels marked in my chart.
⚠️ Not financial advice - DYOR.

ASTER New Update (12H)Based on the current candlestick data for ASTER, it appears to be forming an expanding pattern.
This pattern formed from the point where we placed the red arrow on the chart.
Wave C of this expanding pattern is expected to complete within the green zone. The green zone is an optimal higher-timeframe support area, such as the daily timeframe.
If the price reaches the green zone, we will look for buy or long positions.
The targets for this position are marked on the chart.
Let’s see what happens.
For risk management, please don't forget stop loss and capital management
When we reach the first target, save some profit and then change the stop to entry
Comment if you have any questions
Thank You

ASTER: Updating My Bearish Targets — Next Stop 0.94Hey friends! 👋
I’ve already posted a few bearish ideas on ASTER, and here’s another update on this coin 🐻
Right now I’m refreshing my downside targets.
🎯I’m expecting ASTER to drop to 0.94, and possibly even lower.
As many of you remember from my previous publications, my original big target was 0.76, but honestly, that now feels a bit too ambitious in the short term.
So let’s first wait for 0.94 — once we get close to that level, I’ll post a fresh update with the next steps.
What do you think — will we see 0.94 soon? Drop your thoughts in the comments! 🚀

ASTER/USDT - Critical Support Test at Major Demand Zone?ASTER/USDT is currently trading within a medium-term bearish trend, characterized by a clear sequence of lower highs and lower lows. Price continues to respect a descending trendline, acting as strong dynamic resistance and consistently rejecting bullish attempts.
At the same time, price has reached a major demand zone between 0.96 – 0.88 (yellow box), which has previously served as a strong accumulation area. This zone now represents a decisive battlefield between buyers and sellers.
---
Pattern Explanation
Descending Triangle / Bearish Continuation Structure
Price is forming lower highs beneath a descending trendline, indicating sustained selling pressure.
Horizontal support is well-defined at the 0.96 – 0.88 demand zone.
This structure typically favors a bearish continuation, but a bullish reversal remains possible if demand holds and structure shifts.
Demand Zone (0.96 – 0.88)
This area reflects previous accumulation and strong buyer interest.
Multiple candles show long lower wicks, signaling buying absorption.
A breakdown below this zone would likely trigger accelerated downside momentum.
---
Key Levels
Dynamic Resistance: Descending trendline
Minor Resistance: 1.065
Key Resistance: 1.175
Major Resistance: 1.385
Major Support / Demand: 0.96 – 0.88
---
Bullish Scenario
The bullish scenario remains valid as long as price holds above the 0.96 – 0.88 demand zone.
Bullish confirmation:
Strong bullish reaction from the demand zone
Break and candle close above the descending trendline
Market structure shift from lower highs to higher highs
Potential upside targets:
1.065 (initial resistance)
1.175
1.385 as a continuation target if momentum strengthens
A confirmed breakout above the trendline would signal a potential trend reversal.
---
Bearish Scenario
The bearish scenario becomes dominant if price breaks and closes below 0.88.
Bearish confirmation:
Clear 12H candle close below the demand zone
Failed retest of the 0.88 – 0.96 area
Increasing bearish volume during the breakdown
Downside expectation:
Continuation of the broader downtrend
Price searching for a new lower demand zone
---
Conclusion
ASTER/USDT is currently trading at a critical technical level.
The 0.96 – 0.88 demand zone will determine whether price:
Initiates a bullish reversal, or
Continues its bearish trend with a breakdown
Patience and confirmation are essential — avoid chasing price inside the zone.
---
#ASTERUSDT #CryptoAnalysis #TechnicalAnalysis #Altcoin #Downtrend #DemandZone #SupportResistance #ChartPattern #PriceAction #Breakout #Bearish #Bullish #MarketStructure

ASTER/USDT | Reclaims Support and Buyers Are Waking Up Again!SEED_WANDERIN_JIMZIP900:ASTER exploded all the way to $1.41, delivering more than 60 percent gains after the last analysis. From there price entered a heavy correction and dropped back to $0.88, which is a key demand zone. Buyers stepped in again and right now ASTER is trading around $0.94.
As long as price holds above $0.92, the bullish recovery setup stays alive and we can look for continuation to the upside. If momentum builds from here the next upside targets are $1.18, $1.26, $1.33, and eventually $1.45 in extension. For now the focus is on whether ASTER can keep stabilizing above the $0.92 structure line since that level decides the next major leg.
Please support me with your likes and comments to motivate me to share more analysis with you and share your opinion about the possible trend of this chart with me !
Best Regards , Arman Shaban

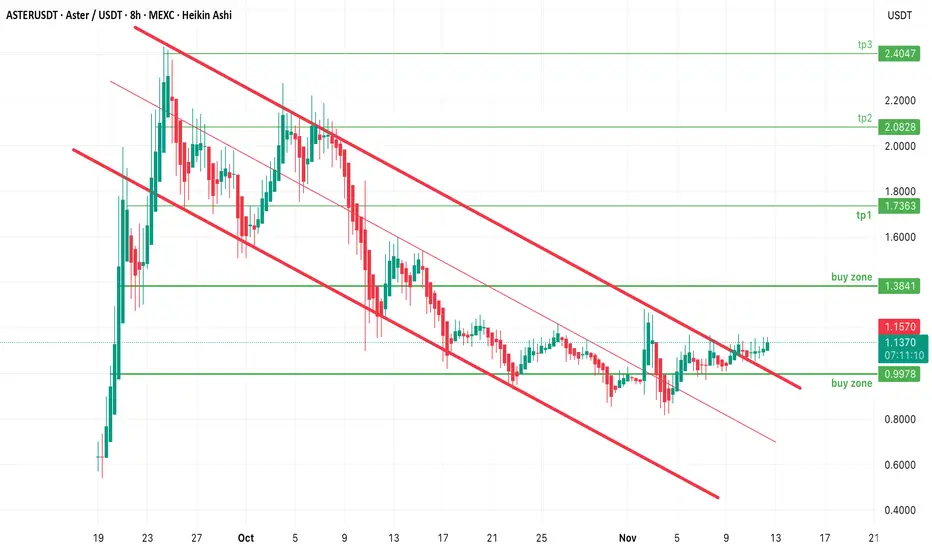
$Aster Aster Breaking out of Falling Channel -50% down from ATH ASTER/USDT Technical Outlook (2H)
SEED_WANDERIN_JIMZIP900:ASTER Aster is Breaking out of its Falling Channel -50% down from ATH
Current price: $1.14
After a prolonged downtrend, ASTER is showing early signs of consolidation and stabilisation, Prices have should accumulation below $1.20 . Price action remains below the 200 EMA, suggesting that the broader structure is still bearish, but momentum is gradually shifting as short-term moving averages begin to flatten.
Key Observations:
Buy Zone :$0.99 – $1.38
This area has acted as a structural demand zone where previous sell pressure was absorbed. A reclaim above this region would confirm a shift in sentiment and could set the stage for a trend reversal.
Resistance Levels / Take Profit Zones:
TP1: $1.73
TP2: $2.10
TP3: $2.40
Momentum & Structure:
A clean breakout and sustained close above $1.38 could open the path to take profit areas mentioned above.
* Failure to hold above$0.99 will invalidate this idea and could expose ASTER to another leg down.
Summary:
Bias:Neutral to mildly bullish while above $0.99
Invalidation:Break and close below $0.99
Potential upside:$1.73 – $2.40 range if buyers maintain momentum with future all time highs up to $3.
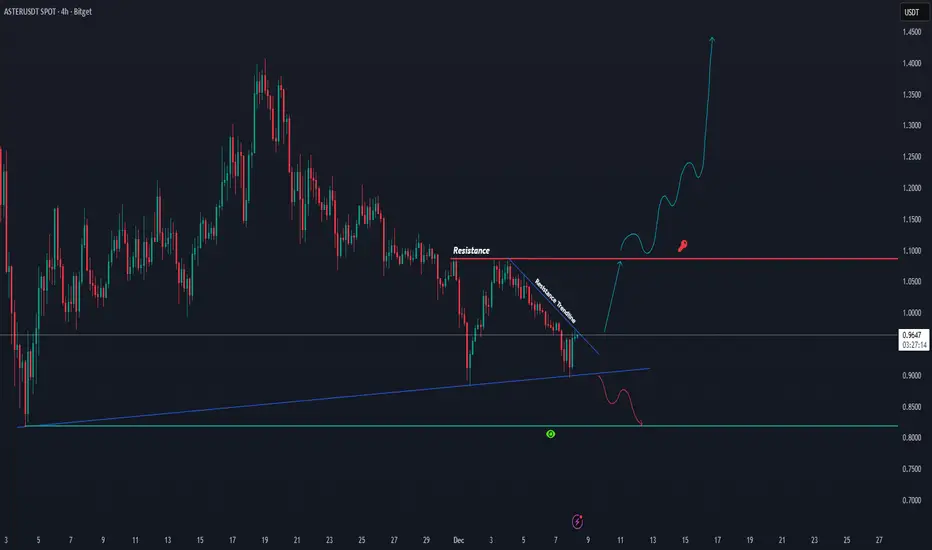
ASTER Squeezing Tight — Breakout Soon?#ASTER
ASTER is currently sitting right on its ascending support while still moving under the short-term resistance trendline. Price is compressing between these two areas, and a breakout in either direction is getting closer
🔥 If ASTER can break above the trendline and push through the resistance zone, momentum could flip bullish quickly and trigger a strong continuation move
🚀 But if it fails to hold the ascending support, a deeper pullback could follow
🔻 Right now, this is a classic “wait and react” setup — the chart is telling us the next big move depends on which side breaks first 👀
#ASTERUSDT
ASTER has broken below the blue support level 📊 ASTER Update
ASTER has broken below the blue support level 🔵⬇,
showing sellers are taking control of the move.
This breakdown increases the chance of further downside
unless buyers quickly reclaim this zone.

ASTER/USDT — Market ViewPrice continues to move within a broad range.
Until it breaks and holds above $1.30, considering ASTER for medium-term positions is risky — even despite active buybacks from the team.
Locally, a short-term trade is possible:
— on a breakout above the dynamic resistance,
— with a mandatory stop-loss below $0.90.

ASTER to rise againOn weekly timeframe , Aster has a very strong support between $0.85 - $1 and its holding more than a month with long wicks , now its time to rise again

FireHoseReel | Aster DEEP ReSearch: EP5 - Inside ASTER Economy🔥 Welcome To FireHoseReel !
Let's dive into Aster Deep ReSearch EP 5 - Inside the ASTER Token Economy
🪙 Token Launch & Hype
In September 2025, ASTER officially launched and instantly grabbed headlines. Within just days, its price surged over +2000%, reaching nearly $1.90, pushing Aster’s market cap beyond $3 billion. This explosive move was fueled by a powerful combo of marketing hype, backing from CZ, and a uniquely structured community rewards model.
🎁 Aster allocated over 50% of total supply to airdrops, liquidity incentives, and referrals — creating one of the widest token distributions in DeFi. Just 24 hours after launch, more than 330K new wallets were activated on the platform.
🧬 ASTER Token Utility – Not Just Governance
ASTER isn't just a passive governance token. Its utility spans multiple layers across the Aster ecosystem:
🗳 Governance: Token holders can vote on key protocol decisions and platform upgrades.
💸 Fee Discounts & Premium Access (future): Holding ASTER may unlock lower trading fees or access to Pro features, similar to Binance’s BNB model.
🎯 Liquidity Incentives: ASTER powers LP rewards, referral programs, and ecosystem growth incentives.
💰 Staking & Margin Collateral: Users can stake ASTER to earn ~5–7% APY and simultaneously use up to 80% of staked value as margin in Aster Pro.
🔥 Aster also introduced a token-burning mechanism (approx. 5–7% annually) to control inflation and support long-term price stability.
⚠️ Challenges Ahead
While the generous airdrop strategy helped bootstrap adoption, it also introduces inflation risk and potential sell pressure if demand doesn't scale.
Aster’s long-term success depends on deep integration of ASTER within trading, governance, and infrastructure — especially as it rolls out its own Layer-1 chain (Aster Chain) with native utilities tied to the token.

FireHoseReel | Aster DEEP ReSearch: EP4 - ASTER Token Explained🔥 Welcome To FireHoseReel !
Let's dive into Aster Deep ReSearch EP4 - Powering Aster , All About ASTER
🪙 The ASTER Token & Its Tokenomics
The native utility token of the Aster ecosystem, ASTER, plays a central role in powering the platform’s growth and governance.
🧨 Launched in September 2025, ASTER saw an explosive debut , surging over 2000% within days to around $1.90, pushing the project’s market cap beyond $3 billion. This rally was fueled by strategic hype, major endorsements (including CZ), and generous community incentives.
📦 Distribution & Community Focus
Over 50% of the total token supply was allocated to airdrops and user rewards, aiming to drive mass adoption. The airdrop campaign alone attracted 330K+ new wallets within 24 hours of launch.
🔧 ASTER Utilities
Governance: Token holders can vote on key protocol proposals.
Fee Benefits & Access (coming soon): Holding ASTER may unlock trading discounts or premium features , similar to BNB on Binance.
Incentives: Used for LP rewards, referrals, and ecosystem campaigns.
Deflation Mechanism: An annual token burn (5–7%) reduces circulating supply over time.
📈 Staking & Margin Collateral
Users can stake ASTER to earn 5–7% APY, while using up to 80% of staked value as margin collateral , blending passive income with trading utility.
This dual-role design ensures ASTER is not just a passive governance token, but an integral part of the trading stack.
⚠️ However, its tokenomics also face challenges. While the airdrop accelerated growth, it may create sell pressure and inflation if demand doesn't scale with usage.
To address this, the Aster team is expanding ASTER's utility , including exclusive roles in Aster Chain, governance power, and staking benefits , alongside regular burns to stabilize long-term value.
ASTER New Analysis (4H)This analysis is an update of the analysis you see in the "Related publications" section
The supply zone we identified in the previous analysis, after rejecting the price multiple times, was eventually cleared. It was a good order zone, and we marked the touches and rejections with orange circles. However, based on wave structure and price action, we are not buyers at these points.
This wave is very likely an X-wave, and if the price doesn’t drop from the current levels, it will drop from the upper red zone. We will only look for buy opportunities in the green zone.
The buying pressure you see is due to news and marketing around this token, as Binance funders created this coin.
For risk management, please don't forget stop loss and capital management
When we reach the first target, save some profit and then change the stop to entry
Comment if you have any questions
Thank You

FireHoseReel | Aster DEEP ReSearch: EP3 - Cross Chain Power🔥 Welcome To FireHoseReel !
Let's dive into Aster Deep ReSearch EP3 - Cross-Chain Liquidity & Passive Yield Power
🧭 One of Aster DEX’s most important strengths is its multi-chain architecture. The platform operates simultaneously across BNB Chain, Ethereum, Solana, and Arbitrum, enabling seamless user access to assets and markets on all of these networks — within a unified interface.
💡 Here’s the magic: Aster aggregates liquidity across chains. A user can deposit USDT on BNB Chain and open a perpetual position on ETH/USD on Arbitrum — without manually bridging tokens. Cross-chain execution is abstracted away, delivering a smooth trading experience that solves a major friction point in DeFi.
This seamless interoperability is one reason pro traders are drawn to Aster — it removes fragmentation and enhances capital mobility.
💸 But Aster isn’t just a trading venue — it’s built to retain capital and maximize user earnings through a native passive income engine: Aster Earn.
🔐 Aster Earn – Yield-Bearing Collateral System
Aster Earn offers DeFi-native strategies that generate yield while keeping assets liquid and usable as trading margin.
Key components:
• asBNB: A derivative token from liquid-staked BNB.
It allows users to earn staking rewards (up to ~30% APY) while holding a tradable representation (asBNB) they can use across Aster DEX.
• USDF: Aster’s native yield-bearing stablecoin, minted 1:1 by depositing USDT.
Its backing is a diversified, delta-neutral crypto portfolio that generates passive income.
Holders can convert USDF to asUSDF to receive weekly yield distributions — while maintaining 1:1 redeemability for USDT to preserve its peg.
🧱 Strategic Utility
What sets Aster Earn apart is integration:
All yield-bearing assets like asBNB and asUSDF can be used directly as collateral for leveraged perpetual trading on Aster Pro. This means users can simultaneously:
1- Earn passive income
2- Trade with margin
3- Keep capital circulating within the ecosystem
This "sticky liquidity loop" helps Aster retain funds long-term — avoiding the classic DeFi pitfall of short-term capital inflow followed by rapid outflow after rewards drop.
🏦 And by issuing USDF, Aster reduces reliance on external stablecoins like USDT and USDC. This internal monetary layer not only boosts financial sovereignty but also opens a new income stream. While currently limited to BNB Chain, USDF's cross-chain expansion is part of Aster’s roadmap.
