ASTER/USDT – Potential Trend Reversal or Bearish Continuation?On the 12H timeframe, ASTER/USDT is still moving within a primary downtrend, clearly defined by a descending trendline acting as dynamic resistance. After a strong sell-off, price has formed a lower consolidation base and is now attempting a pullback toward the descending trendline.
Overall market structure remains bearish, although early signs of a short-term recovery are beginning to appear.
---
Pattern & Structure Explanation
Descending Trendline (Major Resistance):
The price has been rejected multiple times along this trendline, confirming strong seller dominance.
Base Formation / Small Rounded Bottom:
Price has created a higher low from the 0.65 – 0.69 zone, indicating weakening selling pressure.
Pullback Structure:
The current move is still a retracement, not a confirmed structural breakout.
Technically, price is trading within a decision zone between reversal and continuation.
---
Key Levels
Resistance Zones:
0.905
0.970
1.070
1.185
1.400 (major supply zone)
Support Zones:
0.780 (minor support / current price area)
0.690
0.654 (major low / invalidation level)
---
Bullish Scenario
The bullish scenario becomes valid if:
Price breaks and closes strongly above the descending trendline
Supported by increasing volume
Upside targets:
1. 0.905 – initial resistance
2. 0.970 – 1.070 – key supply-demand flip zone
3. 1.185 – mid-term resistance
4. 1.400 – optimistic target if momentum accelerates
Technical implication:
Trendline break = trend reversal confirmation
Market structure shifts from lower highs to higher highs
---
Bearish Scenario
The bearish scenario remains in play if:
Price fails to break the descending trendline
Strong rejection or bearish candle formation appears near resistance
Downside targets:
1. 0.780 – short-term support
2. 0.690 – demand zone
3. 0.654 – previous low (critical support)
If 0.654 breaks:
Downtrend continuation is confirmed
Bearish structure remains intact
Risk of printing a new lower low
---
Conclusion
ASTER/USDT is currently trading at a critical decision area.
The primary trend remains bearish, but reversal potential exists if a confirmed trendline breakout occurs.
Best approach:
Wait for confirmation
Breakout → follow bullish momentum
Rejection → anticipate bearish continuation
Structure and key levels should guide trading decisions.
---
#ASTER #ASTERUSDT #CryptoAnalysis #TechnicalAnalysis #Altcoin #Downtrend #Trendline #Breakout #SupportResistance #PriceAction #MarketStructure
Asteranalysis

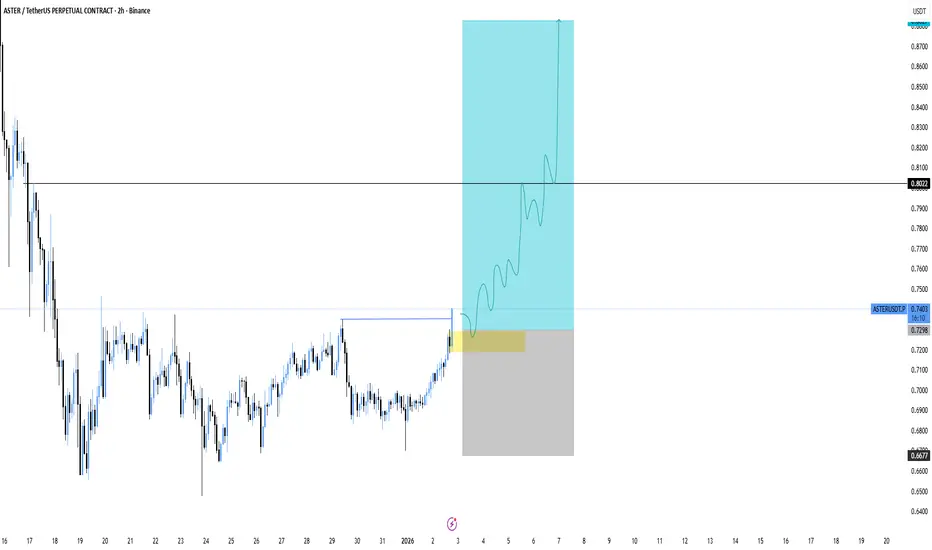
ASTERUSDT – Potential Exploding from here!ASTER has completed a solid recovery phase and is now breaking into a key reaction area. Price is holding well after the push up, suggesting buyers are still in control and opening room for continuation toward higher levels.
Entry: 0.7300 - 0.74
Stoploss: 0.6677
Targets:
0.8032
0.8827
As long as price holds above the entry zone, the continuation scenario remains valid. A loss of this area would invalidate the setup and signal caution.
ASTERUSDT: Descending Triangle Breakdown – Bearish Targets AheadASTER has formed a clear descending triangle on the daily timeframe. Price is compressing toward a horizontal support level , indicating decreasing volatility and pressure building for a breakout.
The structure remains bearish, with lower highs respecting the descending trendline while support is repeatedly tested. A confirmed breakdown below the horizontal support would likely trigger strong continuation to the downside.
After the support break, I expect price to move toward the following targets:
$0.55
$0.40
As long as price stays below the descending trendline, the bearish scenario remains valid.

ASTER New Update (12H)Based on the current candlestick data for ASTER, it appears to be forming an expanding pattern.
This pattern formed from the point where we placed the red arrow on the chart.
Wave C of this expanding pattern is expected to complete within the green zone. The green zone is an optimal higher-timeframe support area, such as the daily timeframe.
If the price reaches the green zone, we will look for buy or long positions.
The targets for this position are marked on the chart.
Let’s see what happens.
For risk management, please don't forget stop loss and capital management
When we reach the first target, save some profit and then change the stop to entry
Comment if you have any questions
Thank You

ASTER: Updating My Bearish Targets — Next Stop 0.94Hey friends! 👋
I’ve already posted a few bearish ideas on ASTER, and here’s another update on this coin 🐻
Right now I’m refreshing my downside targets.
🎯I’m expecting ASTER to drop to 0.94, and possibly even lower.
As many of you remember from my previous publications, my original big target was 0.76, but honestly, that now feels a bit too ambitious in the short term.
So let’s first wait for 0.94 — once we get close to that level, I’ll post a fresh update with the next steps.
What do you think — will we see 0.94 soon? Drop your thoughts in the comments! 🚀

ASTER/USDT - Critical Support Test at Major Demand Zone?ASTER/USDT is currently trading within a medium-term bearish trend, characterized by a clear sequence of lower highs and lower lows. Price continues to respect a descending trendline, acting as strong dynamic resistance and consistently rejecting bullish attempts.
At the same time, price has reached a major demand zone between 0.96 – 0.88 (yellow box), which has previously served as a strong accumulation area. This zone now represents a decisive battlefield between buyers and sellers.
---
Pattern Explanation
Descending Triangle / Bearish Continuation Structure
Price is forming lower highs beneath a descending trendline, indicating sustained selling pressure.
Horizontal support is well-defined at the 0.96 – 0.88 demand zone.
This structure typically favors a bearish continuation, but a bullish reversal remains possible if demand holds and structure shifts.
Demand Zone (0.96 – 0.88)
This area reflects previous accumulation and strong buyer interest.
Multiple candles show long lower wicks, signaling buying absorption.
A breakdown below this zone would likely trigger accelerated downside momentum.
---
Key Levels
Dynamic Resistance: Descending trendline
Minor Resistance: 1.065
Key Resistance: 1.175
Major Resistance: 1.385
Major Support / Demand: 0.96 – 0.88
---
Bullish Scenario
The bullish scenario remains valid as long as price holds above the 0.96 – 0.88 demand zone.
Bullish confirmation:
Strong bullish reaction from the demand zone
Break and candle close above the descending trendline
Market structure shift from lower highs to higher highs
Potential upside targets:
1.065 (initial resistance)
1.175
1.385 as a continuation target if momentum strengthens
A confirmed breakout above the trendline would signal a potential trend reversal.
---
Bearish Scenario
The bearish scenario becomes dominant if price breaks and closes below 0.88.
Bearish confirmation:
Clear 12H candle close below the demand zone
Failed retest of the 0.88 – 0.96 area
Increasing bearish volume during the breakdown
Downside expectation:
Continuation of the broader downtrend
Price searching for a new lower demand zone
---
Conclusion
ASTER/USDT is currently trading at a critical technical level.
The 0.96 – 0.88 demand zone will determine whether price:
Initiates a bullish reversal, or
Continues its bearish trend with a breakdown
Patience and confirmation are essential — avoid chasing price inside the zone.
---
#ASTERUSDT #CryptoAnalysis #TechnicalAnalysis #Altcoin #Downtrend #DemandZone #SupportResistance #ChartPattern #PriceAction #Breakout #Bearish #Bullish #MarketStructure

$ASTER/USDT BUY SETUPTRADE – $ASTER/USDT (Futures)
Type: LONG
Mode: Isolated
Entry: $0.9480 – $0.9550
Targets:
TP1: $1.0000
TP2: $1.0800
TP3: $1.2000
TP4: $1.3960
Stop Loss: $0.8890
Risk: ~1–2%
Potential: ~1:4.5R to TP4
On the 2-hour chart, ASTER/USDT has been in a clear downtrend for an extended period, highlighted by a long descending trendline that has consistently capped price rallies. Price action has recently moved very close to this trendline, showing repeated rejections in the past, which confirms it as a strong resistance area. The overall structure is still weak, as the market continues to form lower highs and lower lows, and momentum has not yet shifted decisively in favor of buyers. The Ichimoku cloud on this timeframe remains mostly above price, indicating that bearish pressure is still dominant and any upward move is currently corrective rather than trend-changing. Recent candles show consolidation near the 0.95 area, suggesting indecision, but there is no strong bullish expansion yet. As long as price stays below the descending trendline and below the cloud resistance, the broader bias on the 2-hour chart remains bearish, with the market still struggling to confirm a sustainable reversal.

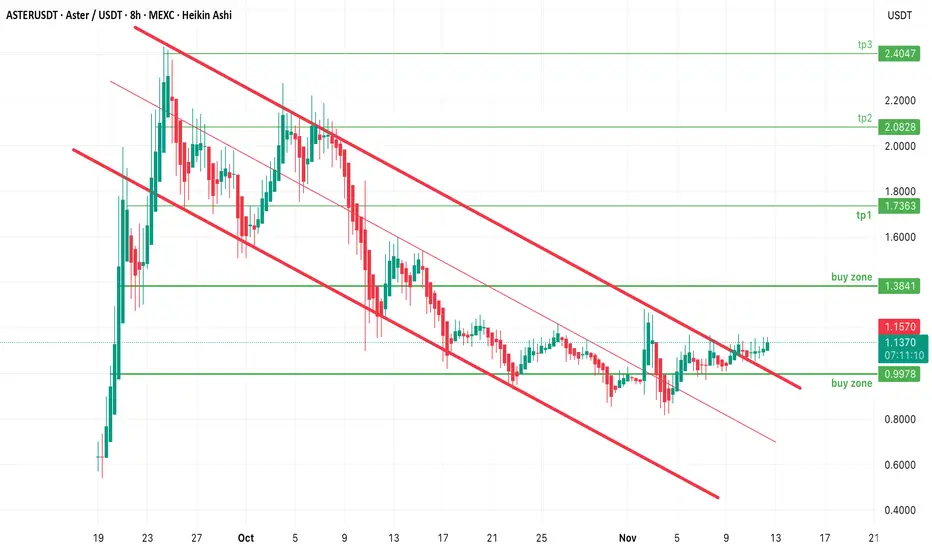
$Aster Aster Breaking out of Falling Channel -50% down from ATH ASTER/USDT Technical Outlook (2H)
SEED_WANDERIN_JIMZIP900:ASTER Aster is Breaking out of its Falling Channel -50% down from ATH
Current price: $1.14
After a prolonged downtrend, ASTER is showing early signs of consolidation and stabilisation, Prices have should accumulation below $1.20 . Price action remains below the 200 EMA, suggesting that the broader structure is still bearish, but momentum is gradually shifting as short-term moving averages begin to flatten.
Key Observations:
Buy Zone :$0.99 – $1.38
This area has acted as a structural demand zone where previous sell pressure was absorbed. A reclaim above this region would confirm a shift in sentiment and could set the stage for a trend reversal.
Resistance Levels / Take Profit Zones:
TP1: $1.73
TP2: $2.10
TP3: $2.40
Momentum & Structure:
A clean breakout and sustained close above $1.38 could open the path to take profit areas mentioned above.
* Failure to hold above$0.99 will invalidate this idea and could expose ASTER to another leg down.
Summary:
Bias:Neutral to mildly bullish while above $0.99
Invalidation:Break and close below $0.99
Potential upside:$1.73 – $2.40 range if buyers maintain momentum with future all time highs up to $3.
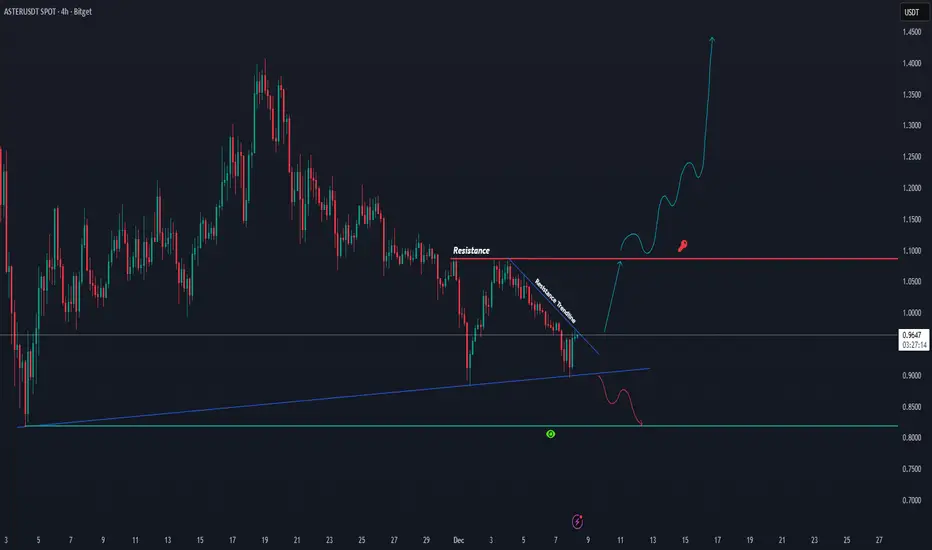
ASTER Squeezing Tight — Breakout Soon?#ASTER
ASTER is currently sitting right on its ascending support while still moving under the short-term resistance trendline. Price is compressing between these two areas, and a breakout in either direction is getting closer
🔥 If ASTER can break above the trendline and push through the resistance zone, momentum could flip bullish quickly and trigger a strong continuation move
🚀 But if it fails to hold the ascending support, a deeper pullback could follow
🔻 Right now, this is a classic “wait and react” setup — the chart is telling us the next big move depends on which side breaks first 👀
#ASTERUSDT
FireHoseReel | Aster DEEP ReSearch: EP4 - ASTER Token Explained🔥 Welcome To FireHoseReel !
Let's dive into Aster Deep ReSearch EP4 - Powering Aster , All About ASTER
🪙 The ASTER Token & Its Tokenomics
The native utility token of the Aster ecosystem, ASTER, plays a central role in powering the platform’s growth and governance.
🧨 Launched in September 2025, ASTER saw an explosive debut , surging over 2000% within days to around $1.90, pushing the project’s market cap beyond $3 billion. This rally was fueled by strategic hype, major endorsements (including CZ), and generous community incentives.
📦 Distribution & Community Focus
Over 50% of the total token supply was allocated to airdrops and user rewards, aiming to drive mass adoption. The airdrop campaign alone attracted 330K+ new wallets within 24 hours of launch.
🔧 ASTER Utilities
Governance: Token holders can vote on key protocol proposals.
Fee Benefits & Access (coming soon): Holding ASTER may unlock trading discounts or premium features , similar to BNB on Binance.
Incentives: Used for LP rewards, referrals, and ecosystem campaigns.
Deflation Mechanism: An annual token burn (5–7%) reduces circulating supply over time.
📈 Staking & Margin Collateral
Users can stake ASTER to earn 5–7% APY, while using up to 80% of staked value as margin collateral , blending passive income with trading utility.
This dual-role design ensures ASTER is not just a passive governance token, but an integral part of the trading stack.
⚠️ However, its tokenomics also face challenges. While the airdrop accelerated growth, it may create sell pressure and inflation if demand doesn't scale with usage.
To address this, the Aster team is expanding ASTER's utility , including exclusive roles in Aster Chain, governance power, and staking benefits , alongside regular burns to stabilize long-term value.
ASTER New Analysis (4H)This analysis is an update of the analysis you see in the "Related publications" section
The supply zone we identified in the previous analysis, after rejecting the price multiple times, was eventually cleared. It was a good order zone, and we marked the touches and rejections with orange circles. However, based on wave structure and price action, we are not buyers at these points.
This wave is very likely an X-wave, and if the price doesn’t drop from the current levels, it will drop from the upper red zone. We will only look for buy opportunities in the green zone.
The buying pressure you see is due to news and marketing around this token, as Binance funders created this coin.
For risk management, please don't forget stop loss and capital management
When we reach the first target, save some profit and then change the stop to entry
Comment if you have any questions
Thank You

FireHoseReel | Aster DEEP ReSearch: EP2 - How Aster Was born ?🔥 Welcome To FireHoseReel !
Let's dive into Aster Deep ReSearch EP2 - How Aster Was Born ?
🏗 How It All Started
Aster DEX was launched in 2024 through the strategic merger of two DeFi projects: Astherus, a yield-focused protocol, and APX Finance, a decentralized perpetual exchange.
By combining expertise in both yield generation and derivative trading, Aster formed a comprehensive platform capable of attracting sustainable liquidity and enabling ultra-fast perpetual markets.
🚀 Boosted by Binance Chain’s infrastructure and liquidity, Aster saw explosive growth. By the end of 2025, the platform had processed over $500 billion in cumulative trading volume and onboarded more than 2 million users — a massive milestone for a newly launched DEX.
🧬 Backing from YZi Labs, a firm closely tied to Binance, played a crucial role in this success. Even CZ (Changpeng Zhao), Binance’s founder, publicly endorsed Aster during its early token launch. This strong industry support earned the trust of the community and fueled rapid tech development.
⚙️ Multi-Layered Architecture & Trading Modes
Aster DEX is designed as a modular trading ecosystem that merges high-speed derivatives, spot markets, and yield opportunities into a single platform — optimized for both newcomers and advanced traders.
🔄 Simple Mode (Up to 1001× Leverage)
Aster’s Simple Mode offers a frictionless experience with:
• No gas fees
• No MEV risk
• Direct wallet-based execution
• Trades routed through a shared liquidity pool (ALP)
Key Highlights:
• Up to 1001× leverage on BTC pairs
• 250× on ETH, 75× on altcoins
• Instant trades — no deposits needed
• Oracle-based pricing (Chainlink & Pyth)
• Dynamic funding rate updates to minimize liquidation risks
🔧 Simple Mode brings the ease of AMMs into leveraged derivatives — ideal for fast, low-friction perpetual trading.
📊 Pro Mode (On-Chain Order Book & Institutional Tools)
Pro Mode offers a full-featured, CEX-style experience on-chain — ideal for professional traders.
What it includes:
• On-chain order book with fast matching
• Market, limit, stop-loss, and trailing-stop orders
• Advanced tools like Grid Trading bots
• Position management: TP/SL, Post-Only, timed execution
• Ultra-low fees: 0.01% maker / 0.035% taker
💼 Aster Pro also introduces Hidden Orders (dark-pool-style), allowing large traders to conceal order size until after execution. This prevents front-running and reduces market impact — a rare DeFi feature.
🧾 Beyond Crypto: Perpetual Stocks
Aster DEX expands beyond crypto into traditional assets via stock perpetuals — offering 24/7 trading on blue-chip equities like Apple and Tesla.
Features:
• Up to 50× leverage
• Crypto-collateralized (e.g., USDT)
• Trade traditional assets even outside stock market hours
🏪 The platform also includes an integrated spot exchange for quick swaps between BTC, ETH, USDT, and ASTER — enabling easy onboarding for new users.

FireHoseReel | Aster: ASTER Bears Are Taking Control🔥 Welcome to FireHoseReel !
Let’s dive into the ASTER analysis.
⚡️ ASTER was moving along a bearish curve, broke its key support, and has now printed a 4H candle close below 1.078 — which confirms the breakdown.
📊 ASTER volume has dropped significantly.
This low volume suggests that a strong expansion may be ahead, and if the next move aligns with the trend, it could offer a solid risk-to-reward setup.
🧮 The RSI oscillator is now testing the 37.5 level.
This zone represents the 4H oversold area for ASTER, which can help accelerate bearish price movement if momentum continues.
✍️ There is currently one main scenario for ASTER, detailed below.
🔴 Short Position Scenario
If ASTER continues to close below this level, accompanied by rising sell volume and RSI breaking below 37.5, the bearish trend can be considered confirmed.
🛞 Risk Management & Disclaimer
Please remember to always use proper risk management and position sizing. Nothing in this analysis is financial advice. The market can change quickly, so always trade based on your own strategy, research, and risk tolerance. You are fully responsible for your own trades.

FireHoseReel | Aster DEEP ReSearch: EP1 - Introduction🔥 Welcome To FireHoseReel !
Let's dive into Aster Education Ep1 .
Introduction
🪙 In recent years, decentralized exchanges (DEXs), especially in the field of perpetual derivatives trading, have experienced remarkable growth. Aster DEX is one of the newest platforms in this sector that has quickly achieved major success by focusing on perpetual contract trading. By offering features such as ultra-high leverage, multi-chain liquidity, and a combination of professional trading tools, this decentralized exchange has attracted significant attention from traders.
💻 For example, in the first half of 2025 alone, the platform’s trading volume exceeded $58 billion, capturing a notable share of the rapidly growing decentralized perpetual market. The rapid expansion of Aster DEX—reaching over $33 billion in monthly trading volume by June 2025, demonstrates strong user adoption and its serious competition with major market players.
✅👇 Key Features
1️⃣ Dual Trading Modes: Simple & Pro
Aster offers two distinct trading environments. In Simple Mode, retail users can trade with one-click execution without concerns about MEV attacks (miner front-running). In Pro Mode, advanced features such as a full order book, complex order types, 24/7 perpetual stock trading, and hidden orders (similar to dark pool features on centralized exchanges) are available for professional traders.
2️⃣ Multi-Chain Support
Aster operates across several major blockchains, including BNB Chain, Ethereum, Solana, and Arbitrum. This allows users to benefit from aggregated cross-chain liquidity without needing to manually bridge assets between networks, providing seamless access to a wide range of digital assets.
3️⃣ Extreme Leverage & Deep Liquidity
One of Aster DEX’s most unique features is its ultra-high leverage of up to 1001x in certain markets, a rare offering in the DeFi space. Combined with deep liquidity (with over $1 billion in Total Value Locked by 2025), this creates strong opportunities for high-return trading. At the same time, the platform’s smart risk-management design helps prevent exploitation and manipulation at such extreme leverage levels.
4️⃣ Capital Efficiency & Yield-Generating Products
Aster allows users to deploy yield-bearing assets within its ecosystem. For example, asBNB liquid-staking tokens and the yield-generating stablecoin USDF from Aster Earn can be used as trading collateral. This enables traders to earn passive annual yields (sometimes exceeding 30%) while actively trading, significantly boosting overall capital efficiency.
5️⃣ Strong Infrastructure & Backing
Aster is backed by YZi Labs and has received support and endorsement from major industry figures such as Changpeng Zhao (CEO of Binance). The development team is also building its own Layer-1 blockchain, called Aster Chain, designed with a focus on ultra-high speed, security, and transaction privacy. This powerful infrastructure can serve as a strong foundation for Aster’s long-term ecosystem growth.
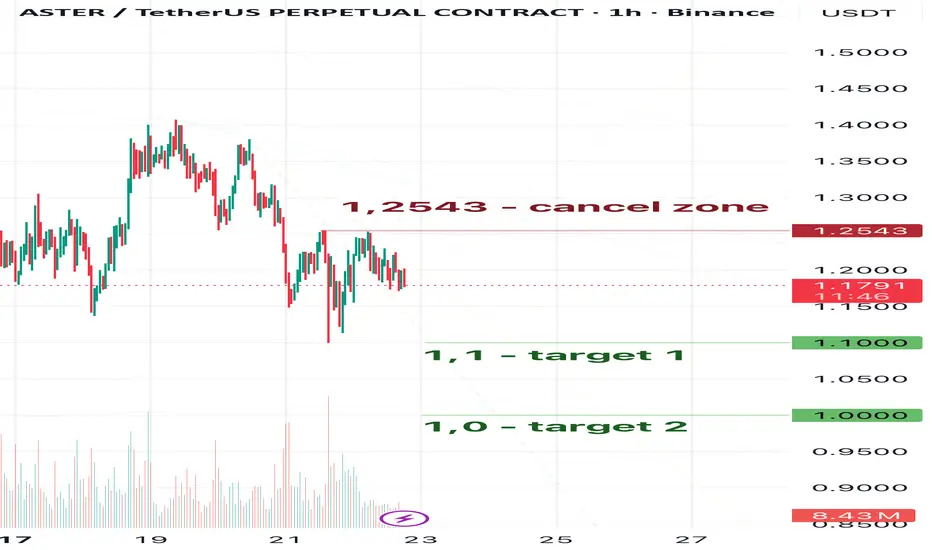
ASTER — Fresh Short Outlook After Re-Entry ConfirmationHey everyone 👋
Even though I closed my previous idea on Aster because I briefly doubted whether the price would actually move lower, the chart eventually confirmed its intention to decline — and even below the targets I set in that earlier publication.
With the structure now much clearer, I’m re-entering the idea with updated targets:
🎯 Target 1: 1.1
🎯 Target 2: 1.0
🎯 Target 3: 0.94
❌ Idea Cancel Zone: 1.186
Let me know what you think in the comments — your feedback helps me decide which assets to analyze next💬
⚠️ Disclaimer: This is not financial advice. I share my personal view of the market — always do your own research before making trading decisions

ASTER — Pre-Drop Positioning & Key Levels Hey everyone. 👋
Hope your week has been productive. Even though it’s Saturday, the market keeps signaling that decisive moves are coming.
One of them is Aster — and in my view, it’s preparing for a controlled downside move.
Here are the key targets I’m watching:
🎯 Target 1: 1.01
🎯 Target 2: 1.00
❌ Invalidation Zone: 1.2543
⚠️ Disclaimer: This is not financial advice. Follow your own trading system and always manage risk — stop-losses are mandatory.
If this asset interests you, drop a reaction or a comment. 💬
It helps me understand whether you want more consistent updates and market insights on Aster.
ASTERUSDT The current trend BINANCE:ASTERUSDT is neutral to bearish, with 1.150 dollars acting as the key level to maintain structure. A breakdown below this zone may push the price toward 0.900 dollars.

$Aster low timeframe planTrying this SEED_WANDERIN_JIMZIP900:ASTER short with low risk. We have a resistance here on 4h timeframe and expect the price to dump from this area. But since the market is unsure I'm using low risk for this trade.

Aster Falling Faster Aster for me has confirmed an even stronger desire to move lower — I have no doubts left that it will drop to 0.076.
In my previous post, I already listed all my targets for this coin.
For now, I’m watching the 0.1 level as the next most visible target,
with the invalidation zone at 0.1366.
⚠️ This is not a trading signal, just my personal forecast. Always trade with stop losses!
This is already my second update on Aster tonight — I regularly share updates on my forecasts when you leave reactions.
So don’t forget to follow and react if you find this useful! 💬📉

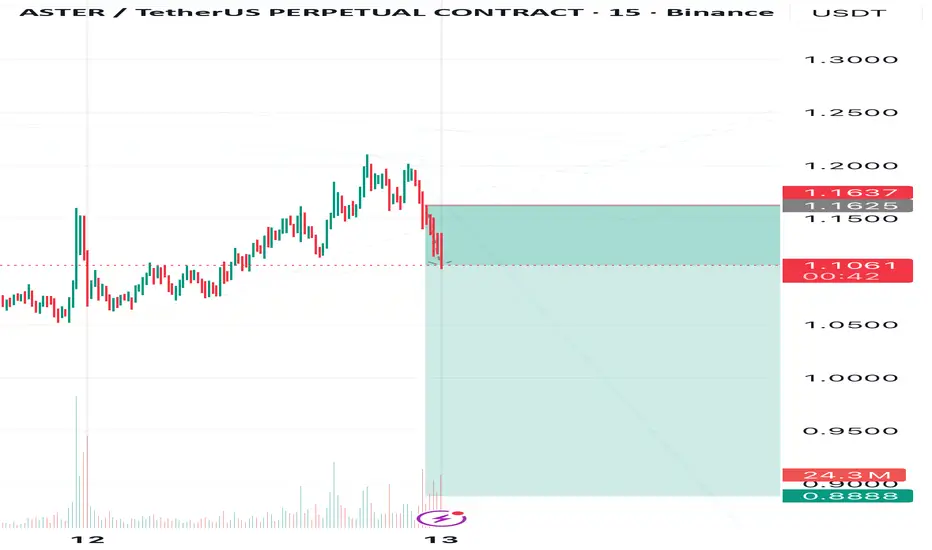
Aster’s Fate — Too Early to CelebrateEven though my invalidation zone in the previous Aster idea was broken, I’m still holding my view — Aster looks ready to continue its move down.
For now, I expect Aster around 0.8888, but my final target is 0.76.
Let’s break this path into a few steps:
🎯 Target 1: 0.116
🎯 Target 2: 0.104
🎯 Target 3: 0.9
🎯 Target 4: 0.76
❌Invalidation zone: 1.1637
⚠️ This is not a trading signal — just my personal forecast.
Always trade with stop-losses and follow me to catch updates, because I post new ones as soon as the chart changes.
💡 And remember — consistent profits come from proper risk control. Even if 50% of trades get stopped out, risk management keeps us growing.
ASTERUSDT UPDATE#ASTER
UPDATE
ASTER Technical Setup
Pattern: Falling Wedge Pattern
Current Price: $1.19
Target Price: $2.50
Target % Gain: 119.38%
Technical Analysis: ASTER is breaking out of a falling wedge pattern on the 4H chart, signaling bullish momentum. The price has broken above the resistance trendline with strong candles and steady buying pressure, confirming potential continuation toward the upper resistance zone.
Time Frame: 4H
Risk Management Tip: Always use proper risk management.

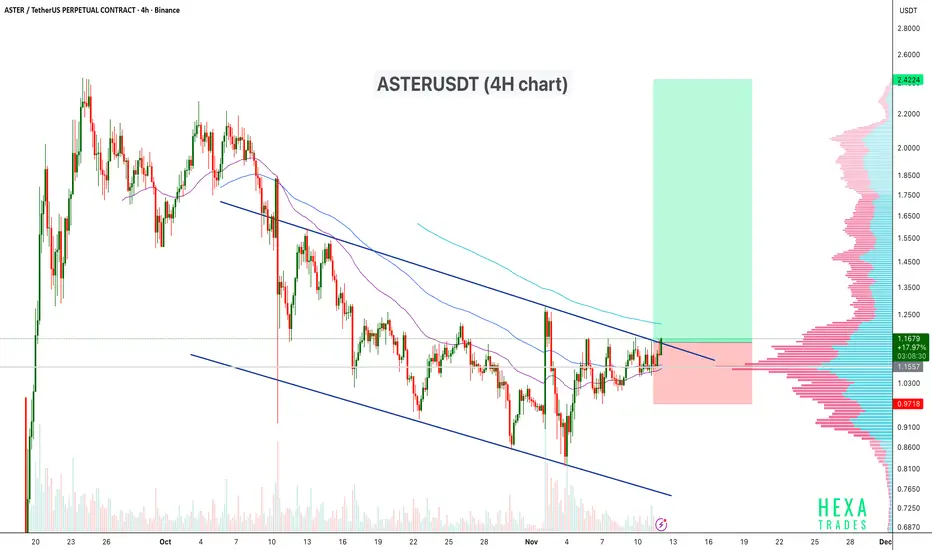
ASTERUSDT Breaking Out of the Descending Channel?ASTERUSDT is trading within a descending channel on the 4H chart, showing consistent lower highs and lower lows over the past few weeks. The price is now testing the upper trendline of the channel, signaling a potential breakout attempt. A confirmed breakout with volume could indicate a shift in trend momentum toward a bullish reversal.
Pattern: Descending Channel
Entry Zone: Near $1.15–$1.18 (breakout confirmation)
Stop-Loss: Below $0.96
If the breakout sustains above the upper trendline and 200 EMA, we may see strong bullish continuation towards the next resistance levels.
Cheers
Hexa
Aster RollercoasterThe picture in Aster doesn’t look too bright right now — things are getting a bit shaky here. I’m expecting a move down toward 0.9
Though if you remember, friends, according to my global forecast, I still see Aster possibly reaching 0.76, but for now, my target is 0.9.
Let’s see how the price reacts as we approach that zone.
❌Invalidation zone: 1.1201
⚠️ This is not a trading signal — make your own decisions and always trade with stop-losses.
💬 Drop your reactions, share your thoughts in the comments, and follow me if you want to see regular Aster updates! 🚀
