ASTER Analysis (3H)After the bullish triangle completed, the price entered a corrective phase. It seems that wave B has a double structure because it makes sense from a timing perspective. Even CZ’s recent tweet couldn’t change the trend and only created an X wave.
The structure of wave B is a WXY, and it is currently in wave Y.
We are looking for a long buy in the green zone.
For risk management, please don't forget stop loss and capital management
When we reach the first target, save some profit and then change the stop to entry
Comment if you have any questions
Thank You
Asterbtc

ASTERUSDT UPDATE#ASTER
UPDATE
ASTER Technical Setup
Pattern: Falling Wedge Pattern
Current Price: $1.19
Target Price: $2.50
Target % Gain: 119.38%
Technical Analysis: ASTER is breaking out of a falling wedge pattern on the 4H chart, signaling bullish momentum. The price has broken above the resistance trendline with strong candles and steady buying pressure, confirming potential continuation toward the upper resistance zone.
Time Frame: 4H
Risk Management Tip: Always use proper risk management.

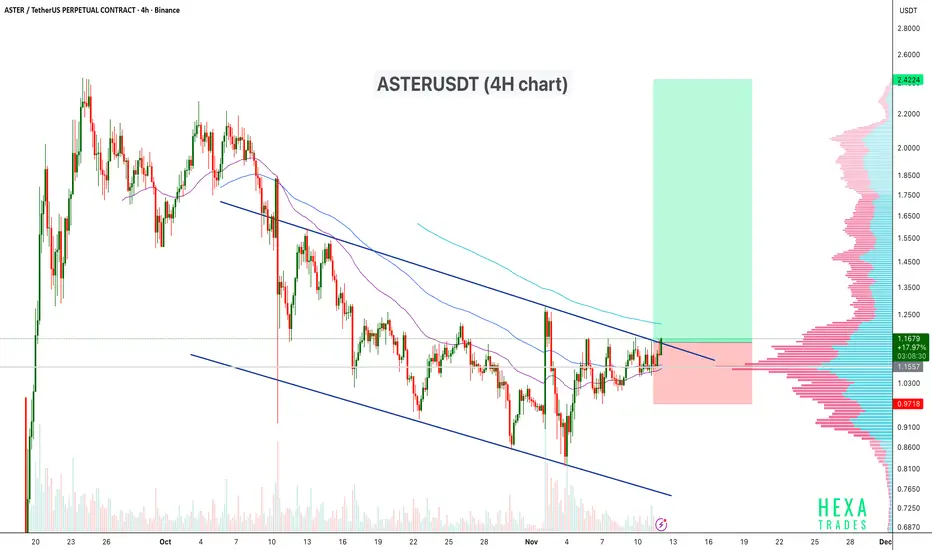
ASTERUSDT Breaking Out of the Descending Channel?ASTERUSDT is trading within a descending channel on the 4H chart, showing consistent lower highs and lower lows over the past few weeks. The price is now testing the upper trendline of the channel, signaling a potential breakout attempt. A confirmed breakout with volume could indicate a shift in trend momentum toward a bullish reversal.
Pattern: Descending Channel
Entry Zone: Near $1.15–$1.18 (breakout confirmation)
Stop-Loss: Below $0.96
If the breakout sustains above the upper trendline and 200 EMA, we may see strong bullish continuation towards the next resistance levels.
Cheers
Hexa