ASTER Analysis (3H)After the bullish triangle completed, the price entered a corrective phase. It seems that wave B has a double structure because it makes sense from a timing perspective. Even CZ’s recent tweet couldn’t change the trend and only created an X wave.
The structure of wave B is a WXY, and it is currently in wave Y.
We are looking for a long buy in the green zone.
For risk management, please don't forget stop loss and capital management
When we reach the first target, save some profit and then change the stop to entry
Comment if you have any questions
Thank You
ASTERUSD

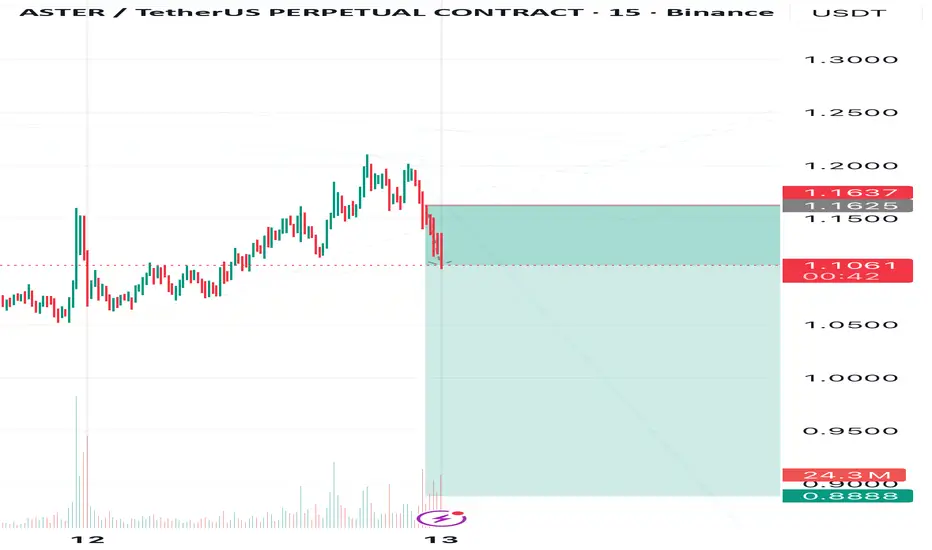
Aster’s Fate — Too Early to CelebrateEven though my invalidation zone in the previous Aster idea was broken, I’m still holding my view — Aster looks ready to continue its move down.
For now, I expect Aster around 0.8888, but my final target is 0.76.
Let’s break this path into a few steps:
🎯 Target 1: 0.116
🎯 Target 2: 0.104
🎯 Target 3: 0.9
🎯 Target 4: 0.76
❌Invalidation zone: 1.1637
⚠️ This is not a trading signal — just my personal forecast.
Always trade with stop-losses and follow me to catch updates, because I post new ones as soon as the chart changes.
💡 And remember — consistent profits come from proper risk control. Even if 50% of trades get stopped out, risk management keeps us growing.
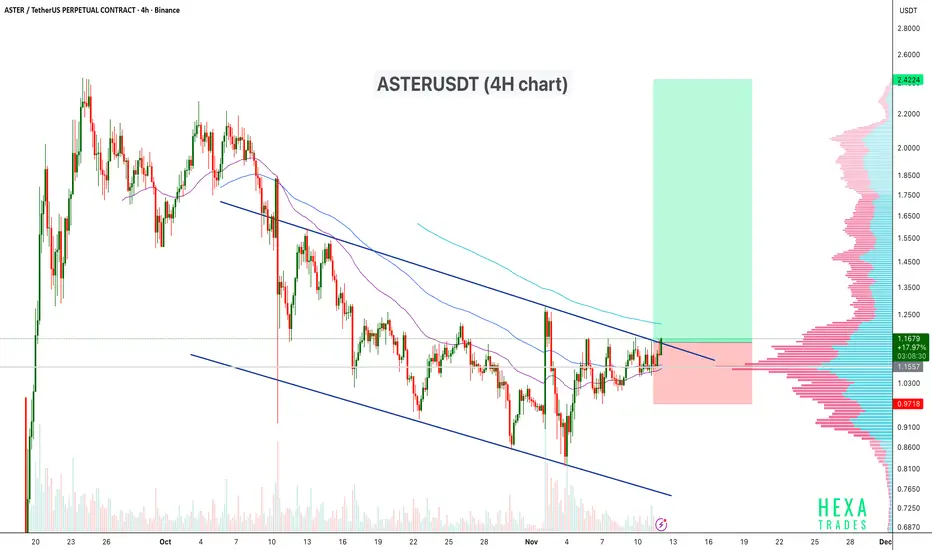
ASTERUSDT Breaking Out of the Descending Channel?ASTERUSDT is trading within a descending channel on the 4H chart, showing consistent lower highs and lower lows over the past few weeks. The price is now testing the upper trendline of the channel, signaling a potential breakout attempt. A confirmed breakout with volume could indicate a shift in trend momentum toward a bullish reversal.
Pattern: Descending Channel
Entry Zone: Near $1.15–$1.18 (breakout confirmation)
Stop-Loss: Below $0.96
If the breakout sustains above the upper trendline and 200 EMA, we may see strong bullish continuation towards the next resistance levels.
Cheers
Hexa
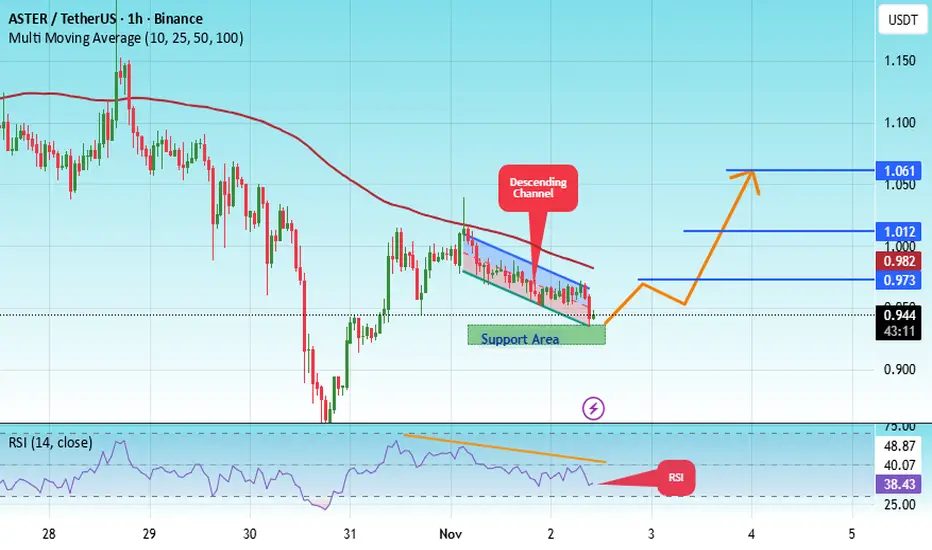
#ASTER/USDT Support and Resistance Levels — Technical Analysis#ASTER
The price is moving in a descending channel on the 1-hour timeframe and is expected to break out and continue upwards.
We have a trend to stabilize above the 100-period moving average again.
We have a downtrend on the RSI indicator, which supports an upward move if it breaks above it.
We have a key support zone in green that pushed the price higher at 0.9300.
Entry price: 1.029
First target: 1.067
Second target: 1.115
Third target: 1.18
For risk management, don't forget your stop-loss and capital management.
The stop-loss is below the support zone in green.
Upon reaching the first target, take some profit and then change your stop-loss order to an entry order.
For any questions, please comment.
Thank you.

#ASTER/USDT ASTER wake up neo#ASTER
The price is moving within an ascending channel on the 1-hour timeframe and is adhering to it well. It is poised to break out strongly and retest the channel.
We have a downtrend line on the RSI indicator that is about to break and retest, which supports the upward move.
There is a key support zone in green at the price of 0.927, representing a strong support point.
We have a trend of consolidation above the 100-period moving average.
Entry price: 0.948
First target: 0.973
Second target: 1.012
Third target: 1.06
Don't forget a simple money management rule:
Place your stop-loss order below the support zone in green.
Once the first target is reached, save some money and then change your stop-loss order to an entry order.
For any questions, please leave a comment.
Thank you.
ASTERUSDT — Is This the Start of Reversal from the Falling WedgeThe ASTER/USDT pair is currently standing at a critical juncture, right inside the key demand zone between 1.015 – 0.945 — a level that has acted as the “last fortress” for buyers since October.
The structure forms a classic Falling Wedge pattern, a setup that often signals the end of a mid-term downtrend and the potential beginning of a reversal phase.
After weeks of bearish momentum, price action now shows signs of seller exhaustion, as ASTER attempts to break above the upper wedge trendline — a key sign that bullish momentum might be awakening.
However, the recent long candle rejection from the top indicates that a tight battle between bulls and bears is still in play.
---
📊 Pattern & Technical Structure
Falling Wedge Pattern → historically leads to bullish reversals once accumulation completes.
Yellow Zone (1.015 – 0.945) → acts as the primary demand/retest area, determining whether the breakout holds or fails.
Breakout Attempt → price already tested above the wedge, but a confirmed 6h close above 1.05 is required for validation.
Resistance Targets:
R1: 1.21 — minor resistance
R2: 1.505 — mid-level resistance
R3: 1.79 – 2.08 — major extension targets if momentum expands
---
🟩 Bullish Scenario (If Breakout Confirmed)
If the price manages to close above 1.05 with increasing volume, it would validate the Falling Wedge breakout, potentially opening a rally toward 1.21, 1.505, and even 1.79 as buying strength accelerates.
Entry Zone: above 1.05 (confirmed breakout)
Key Support: 0.945
Targets: 1.21 → 1.505 → 1.79+
Bullish Catalysts: demand zone holding + wedge breakout confirmation
Extra Confirmation: volume spike, RSI turning upward from neutral zone
> Bullish narrative: “If the demand zone holds and buyers reclaim control, ASTER could be entering the first stage of a mid-term reversal.”
---
🟥 Bearish Scenario (If Breakout Fails / Fakeout)
However, if ASTER fails to hold above 1.015 and closes back below 0.94, it would confirm a fake breakout, likely sending the pair back toward the lower wedge region around 0.78–0.72.
Bearish trigger: 6h candle close below 0.94
Targets: 0.78 → 0.72
Invalidation: reclaim above 1.05 with strong volume
Confirmation: red candle expansion + rising sell volume
> Bearish narrative: “Failure to hold the demand zone could invite another wave of selling pressure back into the lower wedge.”
---
🔎 Summary
ASTER is now at a major decision point.
The yellow zone at 1.015 – 0.945 will define whether this marks the beginning of a strong reversal or the continuation of the downtrend.
A confirmed breakout could ignite a bullish momentum run toward 1.79 – 2.08,
while a breakdown below 0.94 could lead to a deeper retracement toward 0.78 – 0.72.
Volume confirmation and price reaction around this zone will decide ASTER’s next major move.
#ASTER #ASTERUSDT #CryptoAnalysis #TechnicalAnalysis #FallingWedge #Breakout #PriceAction #Altcoins #CryptoTrading #SupportResistance #MarketStructure #SwingTrade #DeFi

ASTER on the Edge — The Next Big PledgeIn my view, ASTER is currently forming a descending diagonal triangle.
Earlier, I mentioned that my downside target for ASTER is around 0.76.
I believe we’re now completing wave 4, after which the price may decline
toward my target zone.
After that, a breakout to the upside is expected —
and I think ASTER has the potential to rise toward 1.4–1.6.
But first, let’s see how it behaves during the upcoming decline.
This is just one of my possible scenarios —
not financial advice or a guaranteed outcome

ASTER : Soaring to the Stars or Heavy Plunge?This currency is currently sitting on a demand level (red zone). If it breaks the trend line (green line), it will head toward a supply zone (blue) in a lower timeframe. If it can't break through that zone, we expect continued decline; but if it does, we expect the uptrend to continue. If it doesn't break the trend line and drops below the demand zone, we expect a drop down to the green zone.

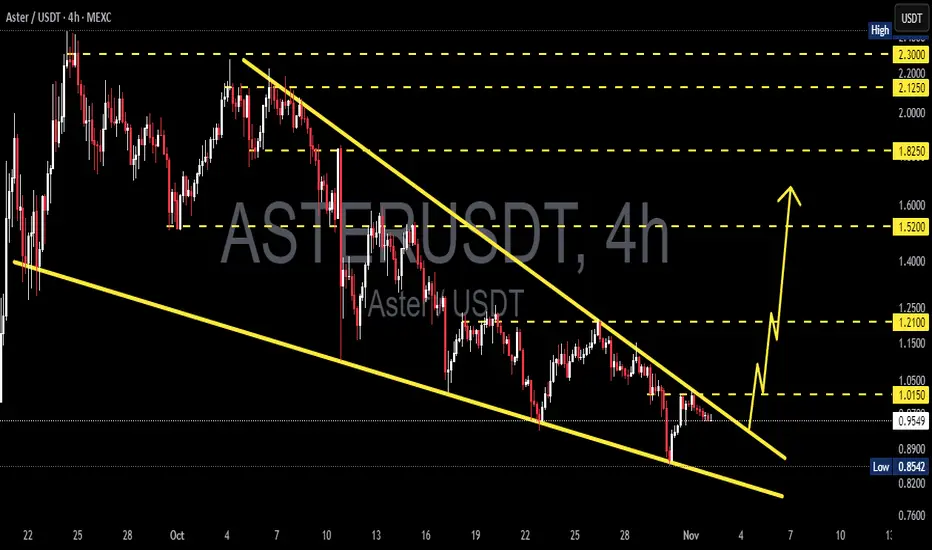
ASTER/USDT – Major Breakout Potential from a Falling Wedge?The ASTER/USDT pair currently shows a very interesting technical structure, where price has been moving inside a Falling Wedge pattern since mid-October.
This formation is widely recognized as one of the most powerful bullish reversal patterns, signaling that selling pressure is weakening while buyers begin to take control.
At the moment, price is hovering around $0.95, approaching the apex of the wedge, which indicates that the consolidation phase is nearing a breakout point. The contracting volume reflects that the market is waiting for confirmation of the next major move.
---
Main Pattern Characteristics
Falling Wedge Pattern:
Two converging downward-sloping trendlines clearly define this setup, showing that sellers are losing strength.
Historically, this pattern often ends with a bullish breakout, especially when it forms after a long downtrend.
Volume & Momentum:
Volume has been decreasing throughout the wedge formation, which is normal — but a strong breakout is typically confirmed by a sharp volume surge.
Watch for bullish RSI divergence (price making lower lows while RSI makes higher lows) as an early confirmation of a potential reversal.
---
Bullish Scenario
If ASTER manages to break and close above the wedge resistance area near $1.01 – $1.05 on the 4H timeframe, it would mark a strong bullish reversal signal.
Gradual upside targets:
1. $1.21 – First breakout confirmation target.
2. $1.52 – Key psychological resistance.
3. $1.82 – $2.10 – Momentum expansion zone where buyers could dominate.
4. $2.30 – Extended target if the bullish rally strengthens.
A strong breakout with rising volume could be the starting point of a new bullish trend for ASTER.
---
Bearish Scenario
Conversely, if price fails to break above resistance and drops back below $0.89 – $0.85, a breakdown scenario could unfold, targeting the $0.76 area.
A close below wedge support would confirm that sellers still have control.
However, statistically, falling wedge structures are more likely to resolve bullishly, as long as the price does not close decisively below the lower boundary.
---
Summary
The ASTER/USDT chart is currently at a critical decision point — between continued consolidation or the beginning of a major reversal.
Technically, the combination of a tightening wedge, declining volume, and possible RSI divergence indicates that a major breakout may be approaching.
If confirmed, bullish momentum could accelerate rapidly, supported by growing liquidity near the wedge’s lower range.
#ASTER #ASTRUSDT #FallingWedge #CryptoBreakout #TechnicalAnalysis #ChartPattern #BullishSetup #CryptoMarket #SwingTrade #PriceAction #ReversalPattern #CryptoAnalysis
ASTER Slide, Watch the Tide ASTER Update 🚀📉
👀 Current view: Consolidation around 1.0-1.112
🎯 Target 1: 1.05
🎯 Target 2: 0.989
❌ Invalidation level: 1,132
📌 Follow me to stay updated and never miss my forecasts!

ASTER Sell/Short Setup (1H)A structure has formed indicating potential reversal moves. We can enter a position at this point with the specified stop, targeting the levels marked on the chart.
Touching the invalidation level will invalidate this setup.
Let’s see what happens.
For risk management, please don't forget stop loss and capital management
When we reach the first target, save some profit and then change the stop to entry
Comment if you have any questions
Thank You

ASTERUSDT — Compression at Its Peak: A Major Breakout is Brewing1. Overview
ASTER/USDT is currently in a tight consolidation phase, forming a clear symmetrical triangle pattern on the 4-hour chart.
This pattern reflects an equilibrium between buyers and sellers, where volatility compresses and tension builds before a decisive move.
Price is hovering around $2.011, right in the middle of the narrowing range between the descending resistance and ascending support trendlines — a typical setup before a major breakout.
This is a classic indecision zone, where markets quietly prepare for their next expansion phase.
---
2. Technical Structure & Key Levels
Upper Resistance Zone:
$2.1267 (Fib 0.5) — first resistance and mid retracement point.
$2.2004 (Fib 0.618) — second resistance and key psychological level.
$2.4391 (Fib 1.0 / previous swing high) — first breakout target.
$2.8253 (Fib 1.618 extension) — extended bullish target on strong momentum.
Lower Support Zone:
$1.8145 (Fib 0.5) and $1.7405 (Fib 0.618) — demand zone highlighted in yellow; strong historical reaction area.
The ascending trendline coincides with this demand zone, making it a critical defense area for bulls.
---
3. Pattern Context — Symmetrical Triangle (Neutral Continuation)
The symmetrical triangle often acts as an accumulation or distribution zone within a larger trend.
Given that this pattern formed after a strong prior uptrend, the bias leans slightly toward bullish continuation.
However, confirmation is essential — a valid breakout requires a decisive candle close outside the triangle with notable volume.
---
4. Bullish Scenario — Breakout to the Upside
Confirmation trigger: A 4H candle closing above the upper trendline, ideally beyond the $2.13–$2.20 zone with strong volume.
This signals that buyers have successfully regained control after the compression phase.
Trade setup:
Entry: After a confirmed breakout (close above $2.13) or on a successful retest of the upper trendline.
Targets:
TP1: $2.44 — previous swing high / Fib 1.0 zone.
TP2: $2.82 — Fib 1.618 extension target.
Stop Loss: Below $1.95 or more conservatively below the demand zone at $1.8145.
Extra confirmation:
Volume must increase significantly (above 20-bar average).
RSI breaking above 60 supports bullish momentum buildup.
Narrative:
A confirmed breakout above this pattern could mark the start of the next impulsive leg in ASTER’s broader uptrend, transforming this triangle into a reaccumulation structure rather than distribution.
---
5. Bearish Scenario — Breakdown Below Support
Warning sign: A 4H candle closing below $1.74, breaking both the demand zone and ascending support line.
This indicates that buyers lost control and that supply pressure is starting to dominate.
Trade setup:
Entry: After a confirmed close below $1.74 with rising volume.
Targets:
TP1: $1.60 — minor structural support.
TP2: $1.35 — previous swing low.
TP3 (extended): $1.07 — if selling pressure accelerates.
Stop Loss: Above recent rejection highs or above the $1.90–$2.00 zone.
Narrative:
A breakdown here would invalidate the higher-low structure and suggest the beginning of a mid-term corrective wave before potential reaccumulation at lower levels.
---
6. Strategic Summary
ASTER/USDT is currently trapped in a compression zone, and volatility expansion is likely approaching.
Symmetrical triangles like this often precede sharp directional moves, as energy builds before release.
Overall bias: Neutral-to-bullish, given the preceding uptrend — but confirmation is mandatory.
While price remains within the triangle, the best approach is patience — wait for a 4H breakout candle with strong volume confirmation.
> “Patience during compression phases is what separates those who predict from those who profit.”
---
7. Risk & Management Notes
Always define a clear stop loss before entry.
Avoid over-leverage during consolidation periods.
Volume confirmation is key — low-volume breakouts often lead to traps.
This analysis is for educational and technical purposes only, not financial advice.
---
#ASTER #ASTERUSDT #Crypto #Altcoin #TechnicalAnalysis #PriceAction #Breakout #SymmetricalTriangle #CryptoSetup #MarketStructure #Fibonacci #CryptoChart

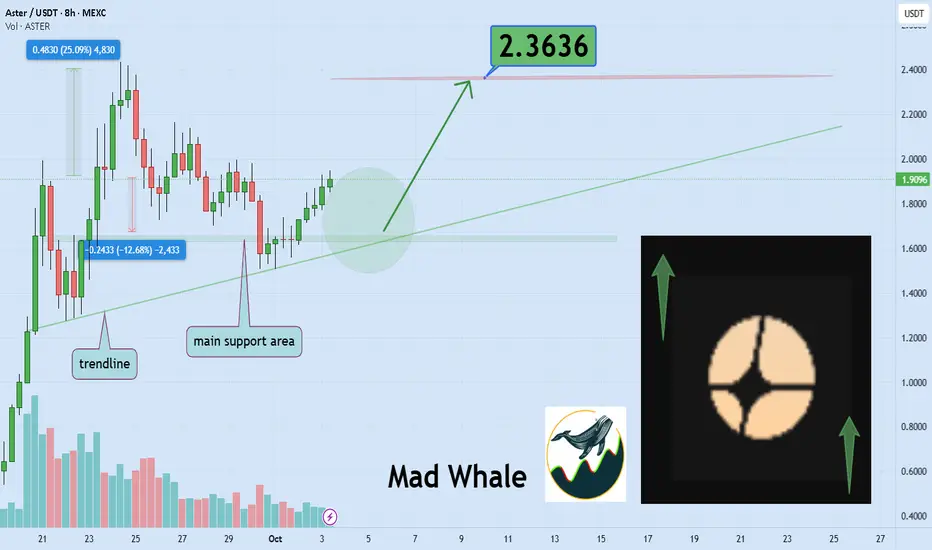
ASTER Approaches Trendline; 25% Upside Targeting $2.3636Hello✌️
Let’s analyze ASTER’s price action both technically and fundamentally 📈.
🔍Fundamental analysis:
BNB jumped 18% this week to $1,100, boosting related tokens like ASTER (+8.57% in 24H).
ASTER gains from BNB’s strength and new Binance integrations, but momentum depends on holding $1.95. Flat BNB Chain TVL (+2%) shows capital flows remain cautious.
📊Technical analysis:
MEXC:ASTERUSDT is approaching a critical support and trendline; holding here could trigger a potential 25% rally toward $2.3636.⚡
What is Astar (ASTER)?
Astar is a smart contract blockchain built on Polkadot. Think of it like a hub where developers can build apps — similar to Ethereum — but with lower fees, faster speed, and the ability to connect to many other chains.
🔹 Main Benefits:
Low fees & fast speed → Users can transact cheaply (good for payments & trading).
Multi-chain connections → Works smoothly with Polkadot and other blockchains.
Multi-Virtual Machine support → Developers can use both EVM (Ethereum-style) and WASM (WebAssembly) smart contracts.
Strong ecosystem → Supports DeFi apps, NFTs, gaming, and real-world assets.
Backed by integrations → Astar often gets attention when exchanges or big projects support it (like Binance adding perpetuals).
⚡ In simple words: Astar is like a faster, cheaper Ethereum that connects to Polkadot and other blockchains, making it attractive for developers and users.
📈Using My Analysis to Open Your Position:
You can use my fundamental and technical insights along with the chart. The red and green arrows on the left help you set entry, take-profit, and stop-loss levels, serving as clear signals for your trades.⚡️ Also, please review the TradingView disclaimer carefully.🛡
✨We put love into every post!
Your support inspires us 💛 Drop a comment we’d love to hear from you! Thanks, Mad Whale
ASTER/USDT — Retest the Fibonacci Zone: Rebound or Breakdown?ASTER is standing at a critical equilibrium zone, retesting a strong demand area between 1.75–1.83, which also aligns with the Fibonacci 0.5–0.618 retracement zone.
This area acts as the last line of defense for buyers to preserve the medium-term bullish structure.
---
📊 Structure & Pattern
After failing to break above the 2.43 resistance, ASTER corrected sharply and is now retesting its previous demand base.
This setup forms a Bullish Retest Pattern, where price seeks a new footing before the next potential leg up.
However, a confirmed break below this zone could shift the market structure into a bearish breakdown, signaling a possible trend reversal.
---
🟩 Bullish Scenario (Potential Rebound)
Buyers must defend the 1.75–1.83 area.
Bullish confirmation occurs when a 4H candle closes above 1.82 with increasing volume.
Upside targets:
→ 1.9469 (minor resistance)
→ 2.1319 (psychological resistance)
→ 2.3077 – 2.4331 (major distribution zone)
As long as demand holds, ASTER could form a new higher low and resume its bullish trajectory.
---
🟥 Bearish Scenario (Potential Breakdown)
A 4H close below 1.7485 (Fib 0.618) would signal that buyers are losing control.
Such a breakdown could trigger a deeper sell-off toward 1.50, possibly extending to 1.20 (major structural support).
A strong rejection at 1.95–2.13 without volume follow-through would also reinforce the bearish outlook.
---
📌 Technical Summary
ASTER is currently at a make-or-break zone where bulls and bears are battling for control.
Holding the 1.75–1.83 demand area keeps the door open for a +30% rebound toward the 2.43 region.
But a clean breakdown below 1.75 could invalidate the bullish setup and lead to a deeper correction toward 1.20.
The next few 4H candles will determine the dominant trend for the week.
---
🎯 Key Levels
Main Support: 1.8217 – 1.7485
Major Structural Support: 1.2000
Resistance Levels: 1.9469 / 2.1319 / 2.3077 / 2.4331
---
“ASTER is approaching a decision point — holding above 1.75–1.83 could trigger a sharp rebound to 2.43, but losing this zone might drag it down to 1.20.
A critical 4H battle between bulls and bears is underway.”
---
#ASTERUSDT #CryptoTrading #AltcoinAnalysis #TechnicalAnalysis #FibonacciRetracement #DemandZone

$ASTER \ Aster DEX Although there is no detailed chart history, my expectation is expressed on the chart based on momentum in the short term.

ASTERUSDT — Will Buy Zone Hold or Break?Overview
ASTER price is currently consolidating after a strong rally toward 2.42. On the 2-hour chart, we can clearly see two major highlighted areas: Buy Zone 1 (primary support) and Buy Zone 2 (deeper secondary support).
The structure still maintains a potential bullish continuation, but repeated weakness around support indicates risk of a breakdown if buyers fail to defend the current zone.
---
🔑 Key Levels
Nearest Support (Buy Zone 1): 1.75 – 1.95
Secondary Support (Buy Zone 2): 1.25 – 1.45
Minor Resistance: 2.12
Major Resistance: 2.33 – 2.42 (previous supply zone / local high)
Current Price: 1.91
---
📐 Technical Pattern
1. Bullish Flag / Rectangle
A sideways consolidation after a strong uptrend move, often a continuation pattern. A confirmed breakout to the upside could lead to a retest of 2.42.
2. Multiple Support Tests at Buy Zone 1
Several rejections at 1.8 – 1.9 confirm this zone as a critical short-term demand area. However, the more often a support is tested, the weaker it becomes.
3. Lower Highs Formation
Minor lower highs suggest mild selling pressure. This structure often precedes either a breakout or a breakdown, depending on which side gets taken out.
---
🚀 Bullish Scenario
Confirmation: A 2H close above 2.12 with rising volume.
Targets:
TP1 = 2.12 (breakout retest)
TP2 = 2.33
TP3 = 2.42 (previous high)
Extended Target: If 2.42 breaks, next psychological resistance sits around 2.80 – 3.00.
📌 Bullish entry ideas:
Aggressive: Buy within Buy Zone 1 with stop loss below 1.75.
Conservative: Wait for breakout above 2.12 + confirmed retest.
---
🐻 Bearish Scenario
Confirmation: A 2H close below 1.75 (breakdown from Buy Zone 1).
Targets:
TP1 = 1.50
TP2 = Buy Zone 2 (1.25 – 1.45)
Extended Target: If Buy Zone 2 fails, the structure shifts into a downtrend, potentially moving closer to 1.00.
📌 Bearish entry idea:
Enter short after breakdown (close <1.75), with stop above 1.95 (former support turned resistance).
---
📊 Risk Management
Always set stop losses below support (for longs) or above breakdown (for shorts).
Scale out profits at key resistance levels.
Keep risk per trade ≤2% of total capital.
---
⚠️ Things to Watch
False breakouts: Require volume confirmation.
Correlation with BTC/ETH: Broader market moves can strongly influence ASTER’s direction.
High volatility: Fakeouts may occur before the real move.
---
📌 Conclusion
As long as price holds above Buy Zone 1, the bullish continuation toward 2.12 – 2.42 remains valid.
A breakdown below 1.75 would invalidate the short-term bullish case and open the door toward Buy Zone 2.
Key decision point is very close — watch carefully for breakout or breakdown confirmation.
---
#ASTER #ASTRUSDT #CryptoAnalysis #BuyZone #SwingTrade #PriceAction #SupportResistance #BullishScenario #BearishScenario

Aster: Hidden Orders, Big Players & Q4 PotentialThe #Aster vs #HYPE confrontation could be one of the key narratives of Q4.
Main driver: hidden limit orders — a feature loved by whales for reducing exposure to monitoring groups.
Key points:
Bitfinex introduced this feature back in 2017 with higher fees compared to standard orders.
Current market conditions (advanced screeners, bots, higher liquidity, and demand for anonymity) make such functionality far more relevant.
CZ’s potential comeback adds additional weight to Aster’s expansion strategy.
Analysts estimate that for Aster to match Hype’s scale, the token would need to trade at $7.83.
Our accumulation zones (if correction occurs):
$1.70 — reasonable entry
$1.40 — ideal target
$0.90 — extended wish
Question remains: will Aster evolve into a Q4 market leader, or is it simply another hype cycle?
______________
◆ Follow us ❤️ for daily crypto insights & updates!
🚀 Don’t miss out on important market moves
🧠 DYOR | This is not financial advice, just thinking out loud.
