ASTERUSDT — Compression at Its Peak: A Major Breakout is Brewing1. Overview
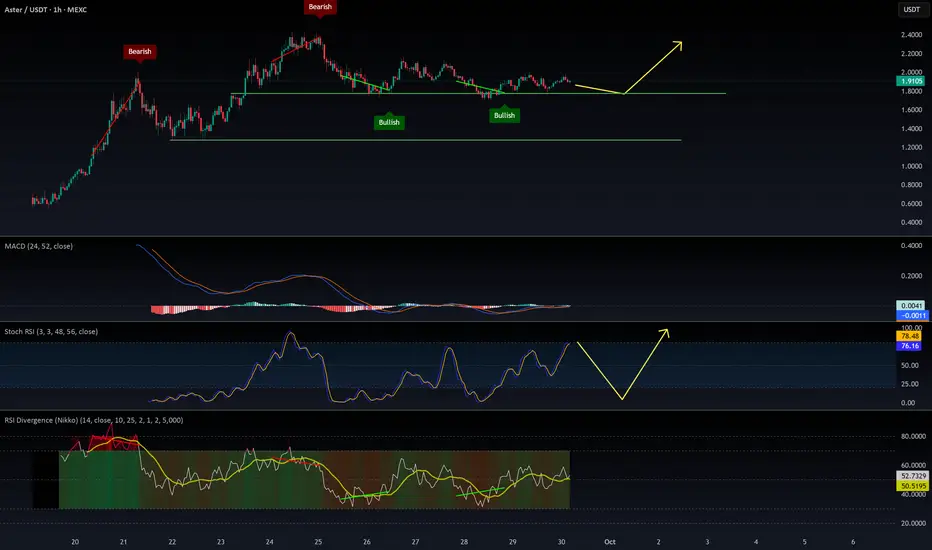
ASTER/USDT is currently in a tight consolidation phase, forming a clear symmetrical triangle pattern on the 4-hour chart.
This pattern reflects an equilibrium between buyers and sellers, where volatility compresses and tension builds before a decisive move.
Price is hovering around $2.011, right in the middle of the narrowing range between the descending resistance and ascending support trendlines — a typical setup before a major breakout.
This is a classic indecision zone, where markets quietly prepare for their next expansion phase.
---
2. Technical Structure & Key Levels
Upper Resistance Zone:
$2.1267 (Fib 0.5) — first resistance and mid retracement point.
$2.2004 (Fib 0.618) — second resistance and key psychological level.
$2.4391 (Fib 1.0 / previous swing high) — first breakout target.
$2.8253 (Fib 1.618 extension) — extended bullish target on strong momentum.
Lower Support Zone:
$1.8145 (Fib 0.5) and $1.7405 (Fib 0.618) — demand zone highlighted in yellow; strong historical reaction area.
The ascending trendline coincides with this demand zone, making it a critical defense area for bulls.
---
3. Pattern Context — Symmetrical Triangle (Neutral Continuation)
The symmetrical triangle often acts as an accumulation or distribution zone within a larger trend.
Given that this pattern formed after a strong prior uptrend, the bias leans slightly toward bullish continuation.
However, confirmation is essential — a valid breakout requires a decisive candle close outside the triangle with notable volume.
---
4. Bullish Scenario — Breakout to the Upside
Confirmation trigger: A 4H candle closing above the upper trendline, ideally beyond the $2.13–$2.20 zone with strong volume.
This signals that buyers have successfully regained control after the compression phase.
Trade setup:
Entry: After a confirmed breakout (close above $2.13) or on a successful retest of the upper trendline.
Targets:
TP1: $2.44 — previous swing high / Fib 1.0 zone.
TP2: $2.82 — Fib 1.618 extension target.
Stop Loss: Below $1.95 or more conservatively below the demand zone at $1.8145.
Extra confirmation:
Volume must increase significantly (above 20-bar average).
RSI breaking above 60 supports bullish momentum buildup.
Narrative:
A confirmed breakout above this pattern could mark the start of the next impulsive leg in ASTER’s broader uptrend, transforming this triangle into a reaccumulation structure rather than distribution.
---
5. Bearish Scenario — Breakdown Below Support
Warning sign: A 4H candle closing below $1.74, breaking both the demand zone and ascending support line.
This indicates that buyers lost control and that supply pressure is starting to dominate.
Trade setup:
Entry: After a confirmed close below $1.74 with rising volume.
Targets:
TP1: $1.60 — minor structural support.
TP2: $1.35 — previous swing low.
TP3 (extended): $1.07 — if selling pressure accelerates.
Stop Loss: Above recent rejection highs or above the $1.90–$2.00 zone.
Narrative:
A breakdown here would invalidate the higher-low structure and suggest the beginning of a mid-term corrective wave before potential reaccumulation at lower levels.
---
6. Strategic Summary
ASTER/USDT is currently trapped in a compression zone, and volatility expansion is likely approaching.
Symmetrical triangles like this often precede sharp directional moves, as energy builds before release.
Overall bias: Neutral-to-bullish, given the preceding uptrend — but confirmation is mandatory.
While price remains within the triangle, the best approach is patience — wait for a 4H breakout candle with strong volume confirmation.
> “Patience during compression phases is what separates those who predict from those who profit.”
---
7. Risk & Management Notes
Always define a clear stop loss before entry.
Avoid over-leverage during consolidation periods.
Volume confirmation is key — low-volume breakouts often lead to traps.
This analysis is for educational and technical purposes only, not financial advice.
---
#ASTER #ASTERUSDT #Crypto #Altcoin #TechnicalAnalysis #PriceAction #Breakout #SymmetricalTriangle #CryptoSetup #MarketStructure #Fibonacci #CryptoChart
ASTERUSDC

ASTER/USDT — Retest the Fibonacci Zone: Rebound or Breakdown?ASTER is standing at a critical equilibrium zone, retesting a strong demand area between 1.75–1.83, which also aligns with the Fibonacci 0.5–0.618 retracement zone.
This area acts as the last line of defense for buyers to preserve the medium-term bullish structure.
---
📊 Structure & Pattern
After failing to break above the 2.43 resistance, ASTER corrected sharply and is now retesting its previous demand base.
This setup forms a Bullish Retest Pattern, where price seeks a new footing before the next potential leg up.
However, a confirmed break below this zone could shift the market structure into a bearish breakdown, signaling a possible trend reversal.
---
🟩 Bullish Scenario (Potential Rebound)
Buyers must defend the 1.75–1.83 area.
Bullish confirmation occurs when a 4H candle closes above 1.82 with increasing volume.
Upside targets:
→ 1.9469 (minor resistance)
→ 2.1319 (psychological resistance)
→ 2.3077 – 2.4331 (major distribution zone)
As long as demand holds, ASTER could form a new higher low and resume its bullish trajectory.
---
🟥 Bearish Scenario (Potential Breakdown)
A 4H close below 1.7485 (Fib 0.618) would signal that buyers are losing control.
Such a breakdown could trigger a deeper sell-off toward 1.50, possibly extending to 1.20 (major structural support).
A strong rejection at 1.95–2.13 without volume follow-through would also reinforce the bearish outlook.
---
📌 Technical Summary
ASTER is currently at a make-or-break zone where bulls and bears are battling for control.
Holding the 1.75–1.83 demand area keeps the door open for a +30% rebound toward the 2.43 region.
But a clean breakdown below 1.75 could invalidate the bullish setup and lead to a deeper correction toward 1.20.
The next few 4H candles will determine the dominant trend for the week.
---
🎯 Key Levels
Main Support: 1.8217 – 1.7485
Major Structural Support: 1.2000
Resistance Levels: 1.9469 / 2.1319 / 2.3077 / 2.4331
---
“ASTER is approaching a decision point — holding above 1.75–1.83 could trigger a sharp rebound to 2.43, but losing this zone might drag it down to 1.20.
A critical 4H battle between bulls and bears is underway.”
---
#ASTERUSDT #CryptoTrading #AltcoinAnalysis #TechnicalAnalysis #FibonacciRetracement #DemandZone

$ASTER is a clear case of market manipulation$ASTER is a clear case of market manipulation:
6 wallets (likely one group) control 96% of the supply.
No functional product, only $500k daily volume on CRYPTOCAP:BTC pair, and shady practices.
Still, it’s valued at $10B.
Everyone sees it’s junk, but you can’t short it.
That’s why $ASTER is bullish—they control the price by owning nearly all the supply.
You can argue supply control is bad, but it works here.
Tight control by shady players = bearish. Tight control by “trusted” players = bullish.
You can call it a scam and say it shouldn’t be worth $10B when it’s barely worth $200M.
You’re right, but you won’t profit.
Accept the game: most altcoins are worthless tokens with no real use. Price isn’t driven by utility—it’s about who’s behind it and their money.
Understand that, and you can start making money.