ASTS 4H: space internet or orbital dream?AST SpaceMobile (ASTS) is consolidating above the $61–69 zone, right near the 0.618 Fibonacci level of its last major rally. On the 4H chart, momentum shows early reversal signs: falling volume on pullbacks, stochastic turning up, and buyers defending local lows. The bullish setup holds as long as price stays above $61, with upside targets at $100 and $135 where the extension projection aligns.
Fundamentally , as of November 2025, ASTS stands out as one of the most promising yet capital-intensive players in the satellite telecom industry. The company completed deployment of its BlueWalker test constellation and is preparing for commercial rollout of direct-to-cell satellite connectivity. Successful phone-to-satellite calls using standard smartphones - validated with AT&T and Vodafone - mark a true technological milestone, positioning ASTS as a potential first-mover in global space-based mobile internet.
Revenue for the first nine months of 2025 reached roughly $55M, almost double last year’s level, but operating losses still exceed $300M due to high manufacturing and launch costs. The company holds about $180M in cash versus ~$260M in debt, continuing to rely on strategic partnerships and funding programs to maintain liquidity. The key upcoming catalyst is the commercial network activation in 2026 in cooperation with AT&T, Vodafone, and Rakuten, which could dramatically change valuation if successful.
With investor attention shifting back to space communications, competition with Starlink and Lynk Global is heating up, but ASTS’s advantage lies in using standard smartphones without extra hardware. Risks remain - high capital needs, launch delays, and dependency on partner timelines - yet the reward potential is extraordinary if execution holds.
Tactically, staying above $61 keeps the bullish structure alive with $100 and $135 as primary targets. A breakdown below $60 would negate the setup.
They’ve already connected phones to space - now let’s see if they can connect revenue to profit.
Asts

AST SpaceMobile: The High-Stakes Race for Global CoverageAST SpaceMobile ( NASDAQ:ASTS ) is currently redefining the orbital telecommunications landscape. On December 24, 2025, the company achieved a historic milestone with the successful launch of BlueBird 6. This satellite represents the largest commercial communications array ever deployed in Low Earth orbit (LEO). Despite this technical triumph, investors are closely monitoring recent volatility. A significant share sale by American Tower Corporation ( NYSE:AMT ) has introduced a complex narrative to the stock’s 250% year-to-date rally.
Geostrategy: The US-India Aerospace Alliance
The launch of BlueBird 6 via India’s LVM3-M6 rocket underscores a strategic shift in aerospace logistics. By leveraging Indian launch capabilities, AST SpaceMobile reduces its dependence on domestic providers like SpaceX. This diversification strengthens the company's supply chain resilience. It also aligns with broader US geostrategy to deepen technological ties with India. This move secures reliable access to space amid a global shortage of heavy-lift launch windows.
Technology: The Patent Moat and AST5000 ASIC
AST SpaceMobile holds a formidable intellectual property portfolio with over 3,800 patents and pending claims. At the core of their technical advantage is the AST5000 ASIC. This proprietary chip enables peak speeds of 120 Mbps per coverage cell. Such capacity allows standard, unmodified smartphones to connect directly to broadband from space. This innovation effectively bypasses the need for specialized hardware, creating a massive competitive moat against traditional satellite providers.
Macroeconomics: Navigating Strategic Divestments
The mid-December sell-off by American Tower ( NYSE:AMT ) caught the market's attention. American Tower reduced its position by approximately 49%, generating nearly $160 million in proceeds. While some analysts view this as routine profit-taking after a massive run, others see a cautionary signal. However, AST SpaceMobile maintains a robust cash position of $3.2 billion as of late 2025. This liquidity supports the planned ramp-up to producing six satellites per month by early 2026.
Industry Trends: The MNO Integration Model
The company's business model relies on 50/50 revenue-sharing agreements with Mobile Network Operators (MNOs). Strategic partnerships with AT&T and Verizon have solidified AST SpaceMobile’s lead in the US market. These carriers provide the licensed spectrum necessary for space-based cellular service. As the "Direct-to-Device" (D2D) trend accelerates, AST SpaceMobile is positioned as a wholesale provider. This model allows for rapid scaling without the high cost of customer acquisition.
Management & Leadership: Executing the Scaled Vision
Founder and CEO Abel Avellan has transitioned the company from a visionary R&D firm to a manufacturing powerhouse. The Midland, Texas, facility now operates at nearly 500,000 square feet across five sites. This vertical integration allows for 95% of satellite components to be produced in-house. Management's ability to hit launch milestones in late 2025 has restored confidence following earlier delays. The leadership's focus remains on achieving continuous US coverage by the end of 2026.
---
Impact Summary for Traders
The successful BlueBird 6 launch validates the technology, but institutional selling suggests a near-term valuation peak.
* Bullish Factors: Successful orbital deployment of 2,400 sq ft array, $3.2B liquidity, and proprietary ASIC technology.
* Bearish Factors: High price-to-book ratio and significant discretionary selling by a strategic partner (American Tower).
* Key Watch: Launch frequency in Q1 2026 and the commencement of commercial beta testing in the US.

ASTS - Long here for a bounce upto 90ASTS has strong bounce here from the value area and point of control (intermediatory)
Started a position here, will add more above 57-58
- it's above POC
- above May low anchored VWAP
- completed the correction ABC wave
- bouncing above the trend line
Target 1 - 72
Target 2 - 80
Target 3 - 90
Stop loss - 50

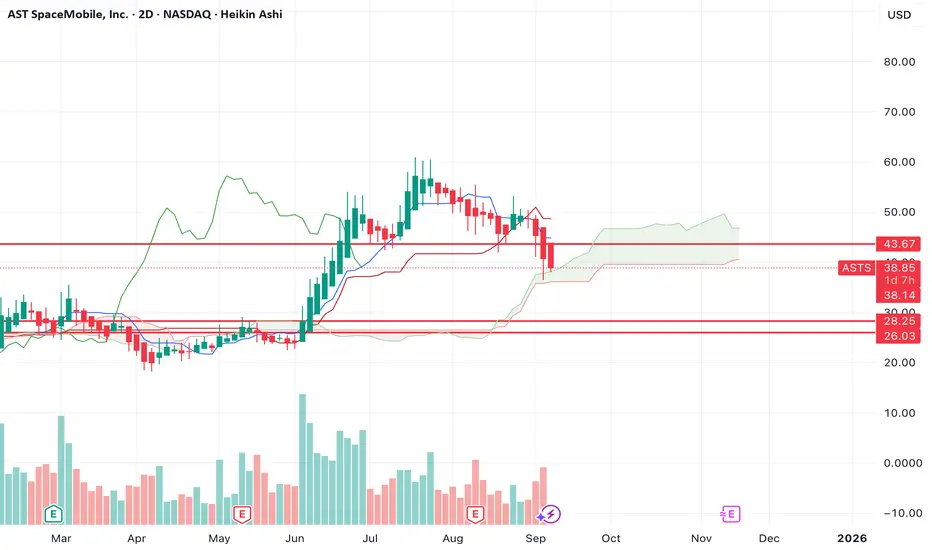
$ASTS H&S breakdown: target sub $30As you can see from the chart, ASTS has broken down from a H&S top.
The measured target of the move is the bottom two support levels. Those would mark great buying opportunities should price get down there.
Let's see how price action unfolds over the coming weeks.
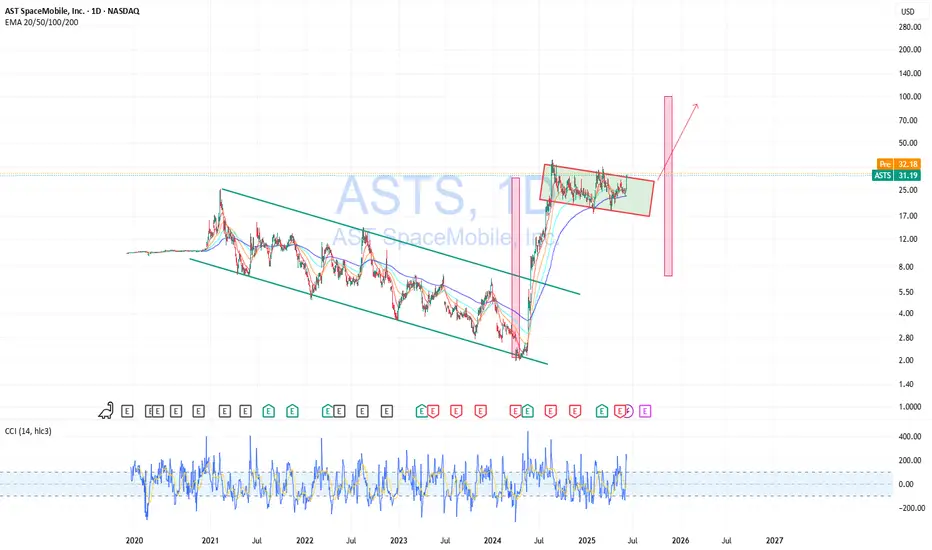
LONG-TERM $ASTSYou can't spell Sats without ASTS
This will be a trillion dollar company - here's the next few years, cheers!
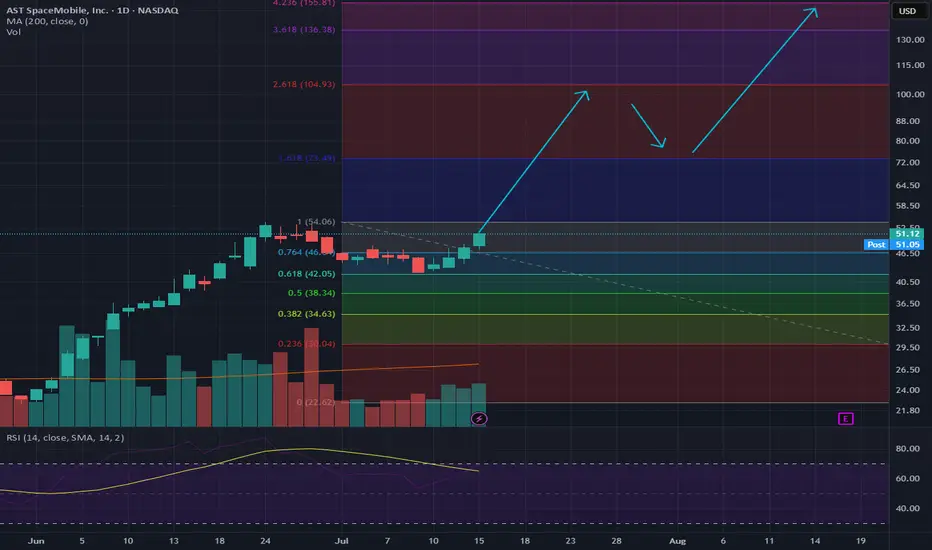
$ASTS Buying the dip. [Long]
Previous bull runs with 50.0% - 61.8% retracements each time.
Stock is still overvalued.
RSI on weekly and monthly confirm this.
50 SMA is still above 200 SMA, and better retracement will be healthy for a stronger bull run continuation.
Buying Zone: $35.50 - $40.65.
Key Levels and points of interest.
Wave 2 completion at 50%-61.8% retracement. This would place Wave 3 around a target range of $85 or higher.
$55-$57 range is around 45% increase from Wave 2 retracement. This happened during the second run and form a H&S pattern. We want our next run up to pass this $55-57 level.
This isn't intended for financial advice, merely personal analysis.
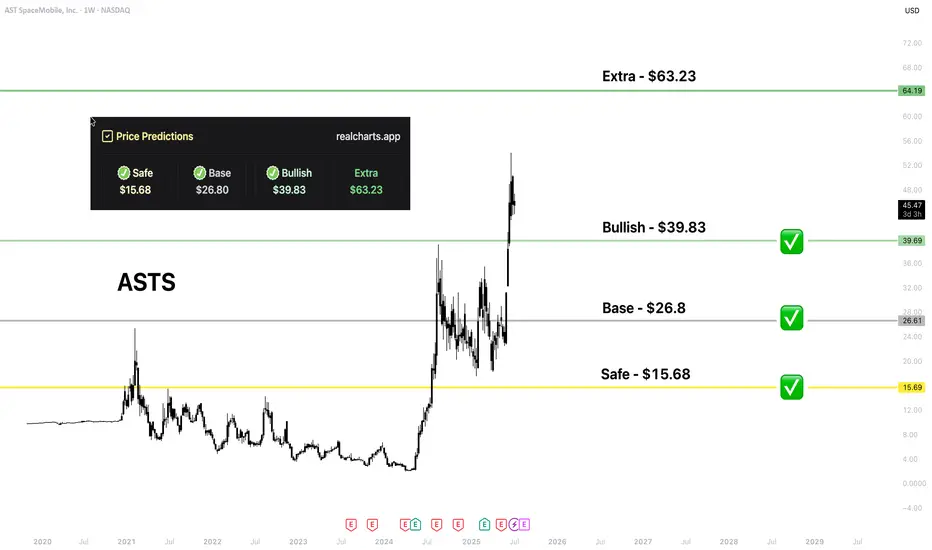
ASTS | Price PredictionNASDAQ:ASTS already hit 3 of 4 targets based on my platform. Massive upside, great asset!
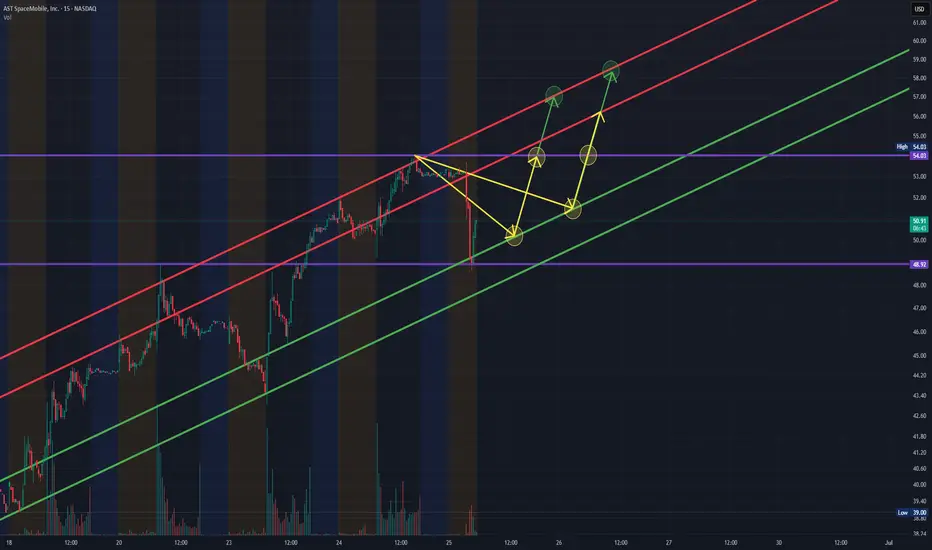
ASTS - Buying Opportunity on ConsolidationASTS set an ATH yesterday (6/25/25) and has consolidated in the pre-market, allowing for anyone who may have missed the stock's run off of those $48.92 Resistance Levels, which have also reversed and turned in support in today's pre-market sessions.
The dip in the stock in this morning's pre-market comes from the company announcing that they will be repurchasing $225M in Debt by selling 9.45M Shares to Participating Note Holders, removing 8.3 Million Underlying Shares in the process.
Looking for another potential re-entry in the stock around the $50.20's-$50.25 price levels with a stop at that previous level of resistance which should act as support if the stock goes any lower first, before heading northward.
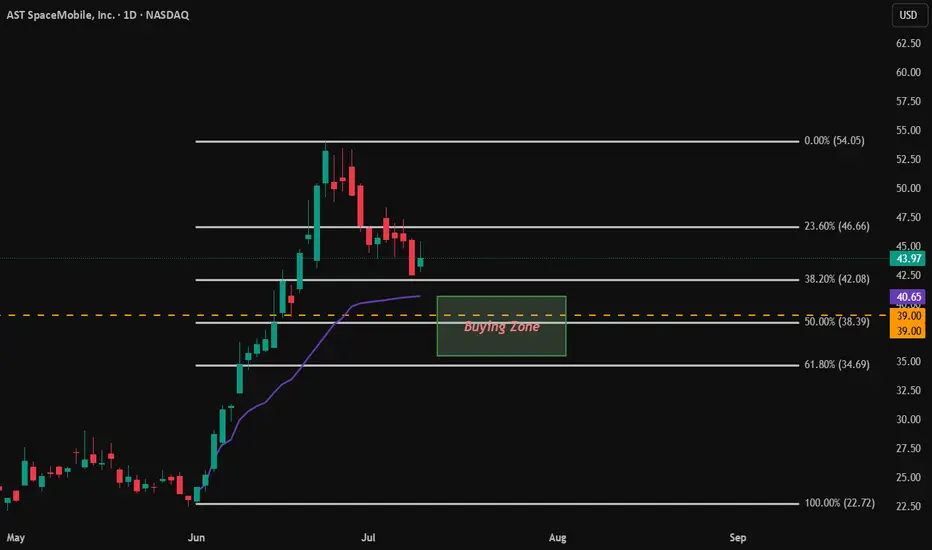
$ASTS Short PositionOvervaluation confirmed by RSI indicator.
Massive Doji, signaling pressure and resistance from sellers.
Entry Point: $45.94 (Last daily candle close price)
Stop/Loss: $52.25
Target Profit Price: $35.50
Disclaimer: Charting is strictly for personal analysis, and should not be used for financial advice.

These 2 Signals Made Members 80% Profit!NYSE:GE has had a massive rejection off of Monthly chart rejection.
We issued an alert to members om June 6th 2025. We entered a 245 Put (July 3) $5 con
We closed out our contracts today at $9 and roughly 80% gain.
This chart demonstrates the power of multiyear monthly chart resistance. Trades like these don't come around often but when they do you have to execute and forget about the noise!
This chart proves that technical trendlines do have power!

Buying ASTS — Waiting for BreakoutASTS has broken out of a long-term downtrend and is now consolidating in a tight range, forming a base after a strong impulse move. This kind of price action often leads to another breakout, especially when supported by rising volume and EMAs lining up underneath.
I’m buying in this current zone, expecting a breakout from the range and continuation to the upside. I’ll be watching for confirmation through volume spikes and a clean move above resistance. The chart structure looks strong, and the upside potential remains high.
Monster Breakout brewing for ASTS🔍 NASDAQ:ASTS Weekly Chart Analysis (Accurate)
Pattern: Massive bull flag / consolidation wedge after a parabolic run.
Current Price: ~$31.20, sitting near the midpoint of the descending channel.
Structure:
Price is compressing between lower highs and higher lows.
Volume spikes on up moves, low volume on pullbacks = bullish accumulation.
Testing upper trendline of the flag — breakout could trigger a new wave.
✅ Favorable Path:
Break and weekly close above ~$34.00 (channel resistance) confirms breakout. That opens up a measured move targeting $50–55 short-term, and possibly $70+ if momentum accelerates.
🎯 Measured Move Target:
Pole base ~$6 → Flag peak ~$36 = ~$30 range
Breakout above $34 → Target = $34 + 30 = $64
⚠️ Invalidation:
A breakdown below $24–25 zone would invalidate the flag and suggest distribution instead of continuation.
🔑 Summary:
Setup: Weekly bull flag after a parabolic leg
Bias: Strongly bullish with breakout potential
Trigger: Weekly close above $34.00
Short-term target: $50–55
Full measured move target: ~$64
Invalidation zone: Below $24
Smart money appears to be loading the dips. Breakout traders should watch $34 like a hawk.

GE Aerospace: How to go to the moon!GE's stock is soaring due to strong earnings and optimistic future guidance from its aerospace division.
1. Blowout Earnings: GE Aerospace reported earnings per share of $1.75, far exceeding analysts' expectations of $1.10.
2. Surging Orders: The company saw a 46% increase in orders last quarter, signaling strong demand for its products.
3. Revenue Growth: GE generated $10.8 billion in revenue, beating forecasts of $10 billion.
4. Wall Street Optimism: Analysts are raising price targets, with some predicting the stock could climb even higher.
5. Industry Momentum: The aerospace sector is experiencing a boom, with GE positioned as a key player.
I'm betting we are close to a pullback and then catapult to New ATH!

$ASTS Trade Alert Setup - 26% Upside🚨 NASDAQ:ASTS Trade Alert Setup 🚨
Falling Wedge Breakout at $24.37 =
🎯 $29.07 📏 $30.77
Trading Plan: July 11th $26 Calls on Breakout or shares

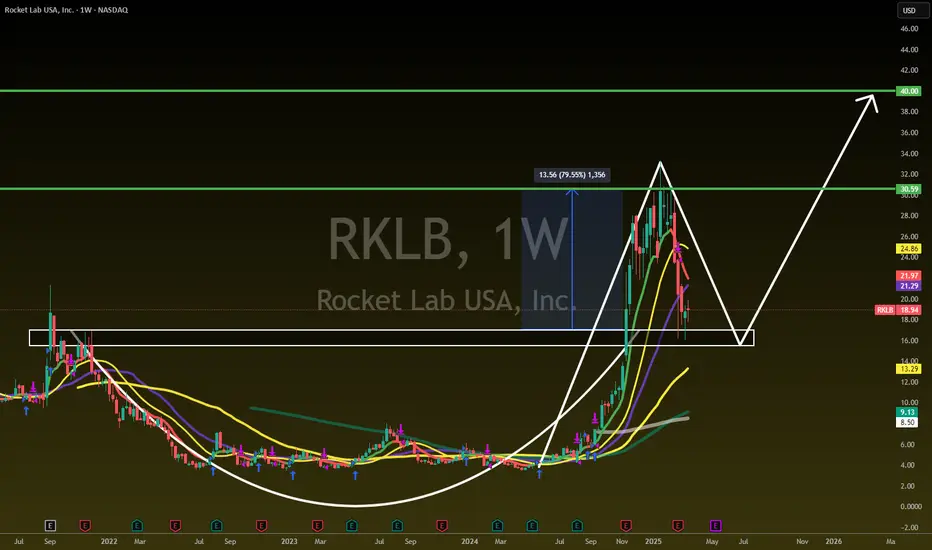
$RKLB - Has landed back at the launchpad! Ready to Re-LaunchNASDAQ:RKLB - Has landed back at the launchpad🚀
Rounded Bottom = $30.59 MM 🎯🏹
Retested and Confirmed with 2 Wick-Offs
Market goes higher = $40 🎯
Not financial advice
ASTS Sideways Daily Trade until Q2After the earnings and techincal call, banks have increased the price target but ASTS is not out of the woods. It needs to now meet those milestones which it plans to over the next 6 to 12 months. Obviously the stock is a great investment, but to the "moon" in a few days like 2024 is not realistic.

$ASTS - The next parabolic move?! $RKLB 2.0NASDAQ:ASTS
The next parabolic move?! NASDAQ:RKLB 2.0
I think we are getting close to that answer!
Breakout = 🎯$39🎯$45
Not financial advice

AST SpaceMobile (ASTS) Analysis Company Overview:
AST SpaceMobile NASDAQ:ASTS is pioneering a global space-based cellular broadband network, enabling mobile connectivity in remote and underserved areas. Its BlueBird satellite technology and strategic partnerships position ASTS as a disruptor in satellite communications.
Key Growth Drivers:
BlueBird Satellite Deployment:
Successful launch of the first five BlueBird satellites demonstrates AST’s ability to deliver innovative mobile broadband solutions globally.
This milestone positions the company to begin revenue generation through early adoption and partnerships.
Space Development Agency (SDA) HALO Program:
AST’s selection for the Highly Agile and Low Orbit (HALO) program opens a significant opportunity in the government and defense sectors.
This collaboration may lead to diversified revenue streams and further innovation in secure satellite communications.
Network Expansion Plans:
Agreements for up to 60 additional satellite launches in 2025-2026 will drive subscriber growth, enable broader network coverage, and accelerate revenue generation.
Strategic Partnerships and Investments:
Backing from industry giants like AT&T, Verizon, Google, and Vodafone highlights ASTS’s credibility and potential to reshape the global communications market.
These partnerships may also enhance access to established customer bases, supporting rapid scaling.
Investment Outlook:
Bullish Stance: We are bullish on ASTS above $19.50-$20.00, driven by its transformative technology, strategic partnerships, and extensive market opportunities.
Upside Target: Our price target is $40.00-$42.00, reflecting ASTS’s potential to capture a substantial share of the growing satellite broadband market.
🚀 AST SpaceMobile—Connecting the World, Beyond Boundaries! #SpaceTech #ASTS #SatelliteRevolution

DESPITE Q3 LOSS, AST SPACEMOBILE REMAINS A BUYThe level between 19.30 - 23 looks strong for ASTS, holding price since late September; and with Q3 loss declared by the company, the price still got rejected at this level. There is high possibility that buyers are accumulating at this mentioned level. Will ASTS witness upward movement in coming weeks. A price close below 17 is not favourable!
N.B!
- ASTS price might not follow the drawn lines . Actual price movements may likely differ from the forecast.
- Let emotions and sentiments work for you
- ALWAYS Use Proper Risk Management In Your Trades
#ASTS
#NASDAQ
#SP500

ASTS AST SpaceMobile Options Ahead of EarningsIf you haven`t bought ASTS before the major breakout:
Now analyzing the options chain and the chart patterns of ASTS AST SpaceMobile prior to the earnings report this week,
I would consider purchasing the 25usd strike price Calls with
an expiration date of 2025-5-16,
for a premium of approximately $6.60.
If these options prove to be profitable prior to the earnings release, I would sell at least half of them.

$ASTS analysisA detailed view of Elliot waves + Wyckoff + Market structure + supply and demand + chart patterns. For +1 month now ASTS has entered a down-trend IMHO and all the above confirm this assumption.
*Not a financial advice

ASTS Technical Analysis by Deno Trading: Key Levels NASDAQ:ASTS Quick Chart Overview:
On the 15-minute charts for AST SpaceMobile (ASTS), we see some critical price action that provides clear insights into potential future movements. The price recently faced a strong resistance around $37.26 but managed to make multiple attempts to break above it. However, the overall trend appears to be meeting significant overhead resistance, which might lead to some short-term challenges.
Key Levels That we Need to look at here:
Resistance:
$37.26: This level has proven to be a tough nut to crack for the bulls. We saw multiple attempts to break above this, but each time the price got rejected, indicating that sellers are active around this zone. If we can see a clean break and hold above this level, it could signal the start of a stronger upward move towards the $40.32 mark.
Support:
$36.73 - $36.36: This is the immediate support zone. The price has been holding above this level recently, but any break below could see a pullback towards $35.07 or even the stronger support at $33.83, which has held previously.
Expectations:
Bullish Scenario:
If ASTS can break and sustain above $37.26, especially with increasing volume, it could set the stage for a move towards $40.32. This would align with the broader bullish trend we’ve seen building over the past sessions. A breakout here could attract more buyers, pushing the stock higher.
Bearish Scenario:
On the downside, if the price fails to hold above the $36.73 level, we could see a retracement towards $35.07 or potentially even deeper towards the $33.83 level. This move could be accelerated if the price breaks below $36.36 with strong momentum.
Sideways Action:
There’s also the possibility that ASTS might consolidate between $36.73 and $37.26 as it gathers energy for its next big move. This could mean some choppy trading action in the near term before we see a decisive breakout or breakdown.
Final Thoughts:
ASTS is at a critical juncture right now. The resistance at $37.26 is a major level to watch, and whether the stock can break above it or not will likely dictate the next significant move. I’m keeping a close eye on both the support and resistance levels for clues about the direction the stock might take next.
Stay tuned for more updates!

ASTS Technical Analysis by Deno Trading: Key Levels Aspects.Lets start with the general chart analysis:
Looking at ASTS on both the 5-minute and 15-minute charts, we observe a sharp rally earlier in the session, pushing the price up to the $37.08 resistance level. However, the price has since shown signs of exhaustion, with two prominent downward moves indicated by the blue arrows on the chart.
Here are some Key Levels:
Resistance:
$37.08: This level represents the recent peak where the price action struggled to sustain momentum. It has acted as a significant ceiling and could continue to be a barrier if the price approaches it again.
Support:
$33.00 - $34.00: This zone served as a strong launchpad during the initial rally and is likely to act as support if the price retraces further. However, breaking below this could signal a deeper pullback.
Expectations:
Potential Pullback:
The chart shows potential for a pullback towards the $33.00 - $34.00 area, especially given the bearish divergence visible on the indicators and the price’s inability to maintain above the $37.08 resistance.
Bearish Scenario:
If ASTS fails to hold above $33.00, we could see further downside pressure, possibly pushing the price back into the $30.00 range, where the next level of significant support lies.
Bullish Scenario:
On the flip side, if ASTS manages to reclaim $37.08 convincingly, it could open the door for a retest of the $39.00 - $40.00 range, with momentum likely picking up as short-sellers cover their positions.
