This Aussie Tech Gem Is Screaming BUY – If This Zone Holds!SDR (SiteMinder) is showing massive potential both technically and fundamentally:
- Trading 75.4% below fair value
- Forecasted to grow 65.36% YoY
- Earnings up 28.2% p.a. over the last 5 years
- Analysts expect 91%+ upside
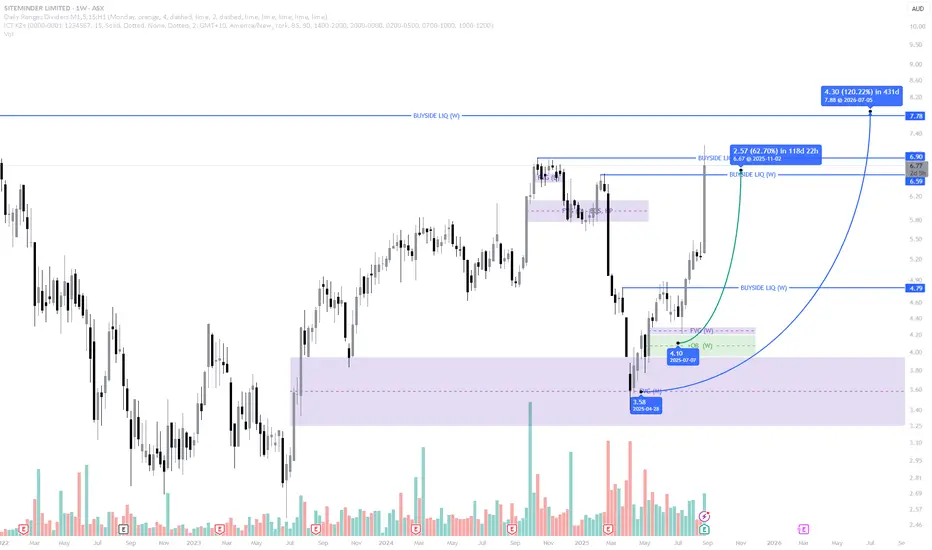
On the chart, we’re sitting right on a high-probability monthly FVG + OB zone. If respected, we could see a strong rally back toward the $6.90–$7.78 buyside liquidity levels and beyond.
Key Levels to Watch:
📍 FVG support: ~$3.50
📈 Targets: $6.90 – $7.78
🧠 Confirmation needed via strong candle closes
🔥 Could be a high-reward play — but as always, DYOR!
ASX

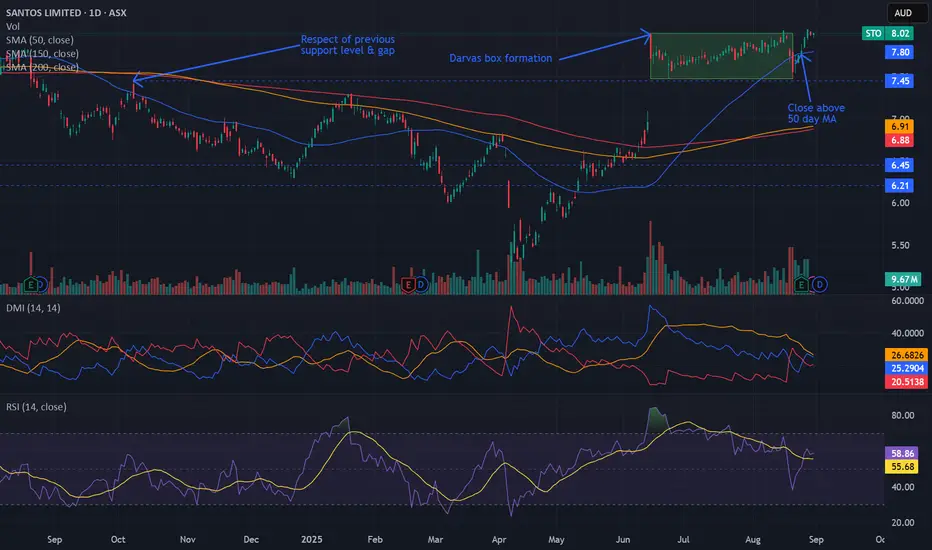
Bullish potential detected for STOEntry conditions:
(i) breach of the upper confines of the Darvas box formation for $ASX:STO.
- i.e.: above high of $8.02 of 16th June (most conservative entry), and
(ii) swing up of indicators such as DMI/RSI.
Stop loss for the trade (based upon the Darvas box formation) would be:
(i) below the support level from the low of 20th August (i.e.: below $7.48).
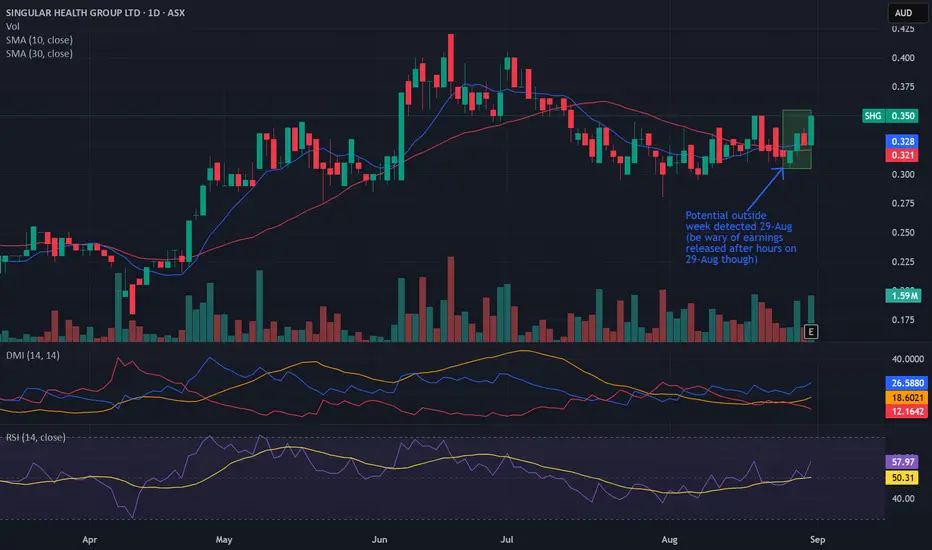
Potential outside week and bullish potential for SHGEntry conditions:
(i) higher share price for ASX:SHG above the level of the potential outside week noted on 29th August (i.e.: above the level of $0.355).
NOTE: Be wary of the market reaction on Monday, 1st September since the annual report was released after market hours on Friday, 29th August - don't chase the market if there is a severe gap up.
Stop loss for the trade would be:
(i) below the low of the outside week on 25th August (i.e.: below $0.305), should the trade activate.
Bullish potential detected for SPKEntry conditions:
(i) higher share price for ASX:SPK along with swing up of indicators such as DMI/RSI.
Depending on risk tolerance, the stop loss for the trade would be:
(i) below previous support of $2.23 from the open of 4th August, or
(i) below previous support of $2.19 from the open of 12th June.

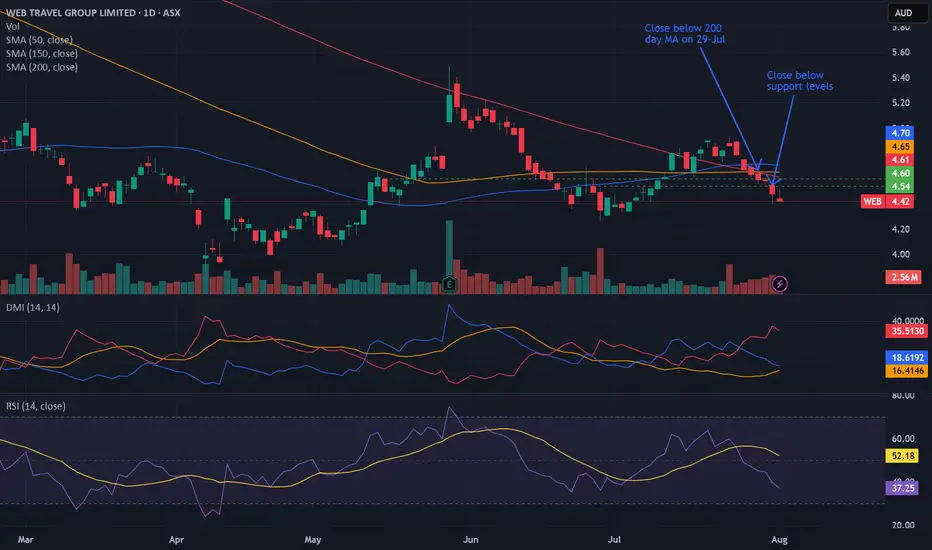
Bearish potential detected for WEBEntry conditions:
(i) lower share price for ASX:WEB along with swing of DMI indicator towards bearishness and RSI downwards, and
(ii) observing market reaction around the share price of $4.54 (open of 26th June).
Stop loss for the trade would be:
(i) above the declining 50 day moving average (currently $4.70), or
(ii) above the low of the candle on 24th July prior to the gap-down prior to the close below the 200 day moving average (i.e. just above $4.78), or
(iii) above the recent swing high on 23rd July (i.e.: above $4.93), depending on risk tolerance.
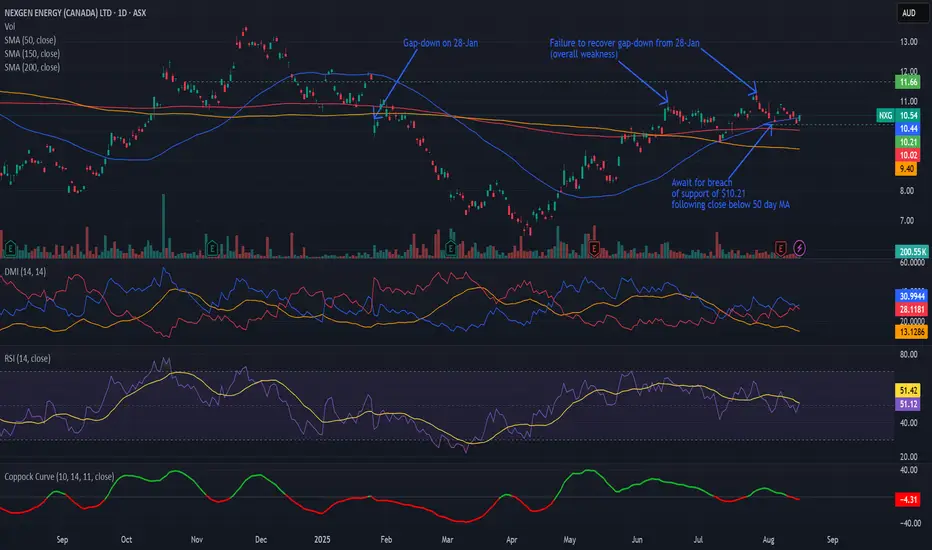
Bearish potential detected for NXGEntry conditions:
(i) lower share price for ASX:NXG along with swing of DMI indicator towards bearishness and RSI downwards, and
(ii) observing market reaction around the share price of $10.21 (open of 4th August).
Stop loss for the trade, depending on risk tolerance, would be:
(i) above the recent swing high of $10.92 of 7th August, or
(ii) above the potential prior resistance of $11.18 from the open of 28th July, or
(iii) above the potential prior resistance of $11.66 from the open of 28th October 2024.
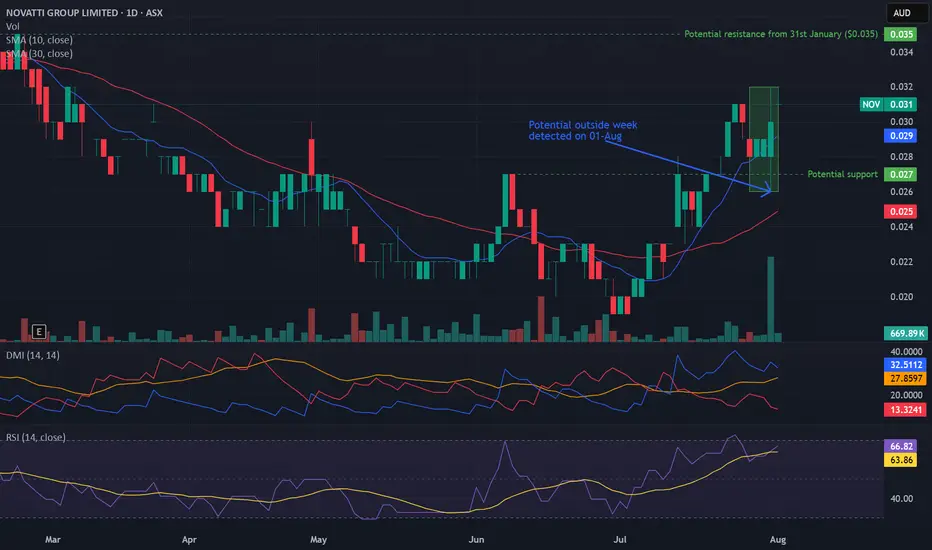
Potential outside week and bullish potential for NOVEntry conditions:
(i) higher share price for ASX:NOV above the level of the potential outside week noted on 31st July (i.e.: above the level of $0.032).
Stop loss for the trade would be:
(i) below the low of the outside week on 31st July (i.e.: below $0.026), should the trade activate.
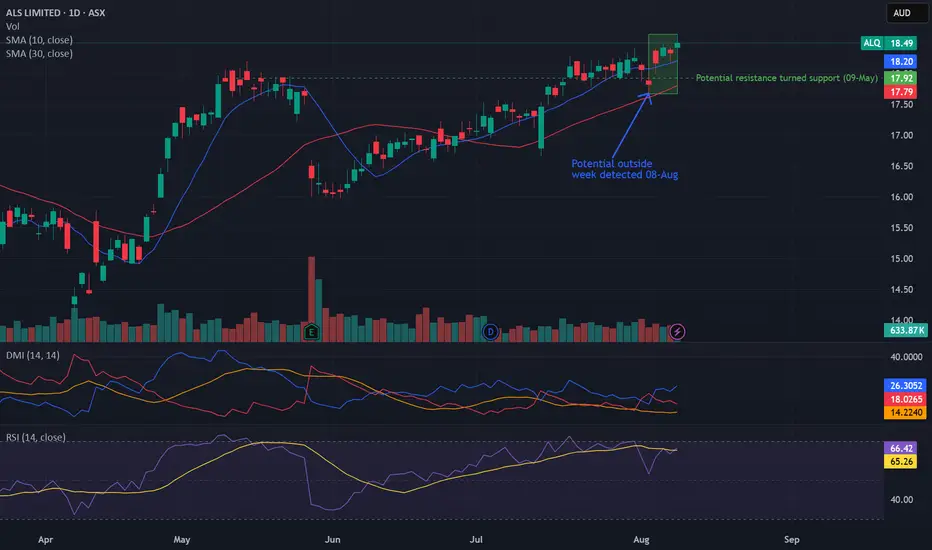
Potential outside week and bullish potential for ALQEntry conditions:
(i) higher share price for ASX:ALQ above the level of the potential outside week noted on 8th August (i.e.: above the level of $18.63).
Stop loss for the trade would be:
(i) below the low of the outside week on 4th August (i.e.: below $17.67), should the trade activate.
SDR – Textbook Respect of PD Arrays Leading to Explosive UpsideExplanation
The move we anticipated on SDR has now unfolded exactly as outlined, with price reacting strongly from the higher-timeframe PD arrays.
Fair Value Gap (FVG): Price tapped perfectly into the monthly/weekly FVG and used it as a springboard for accumulation. This zone served as the rebalancing point for inefficient pricing.
Order Block (OB): The bullish OB inside the FVG held as expected, providing the structural base for buyers to step in and defend.
Liquidity Dynamics: Prior to the move, sell-side liquidity was swept, clearing weak longs and fuelling the drive higher. Once liquidity was taken, momentum shifted sharply to the upside.
Buyside Targets: Price has now begun its run into the weekly buyside liquidity levels at 6.90 and beyond, with the higher target around 7.78 still in play.
This reaction is a textbook ICT move: sweep → rebalance via FVG → respect of OB → expansion toward buyside.
✅ Key Takeaway: The predictive model played out exactly, proving once again that respecting PD arrays across HTFs provides a high-probability roadmap for price action.
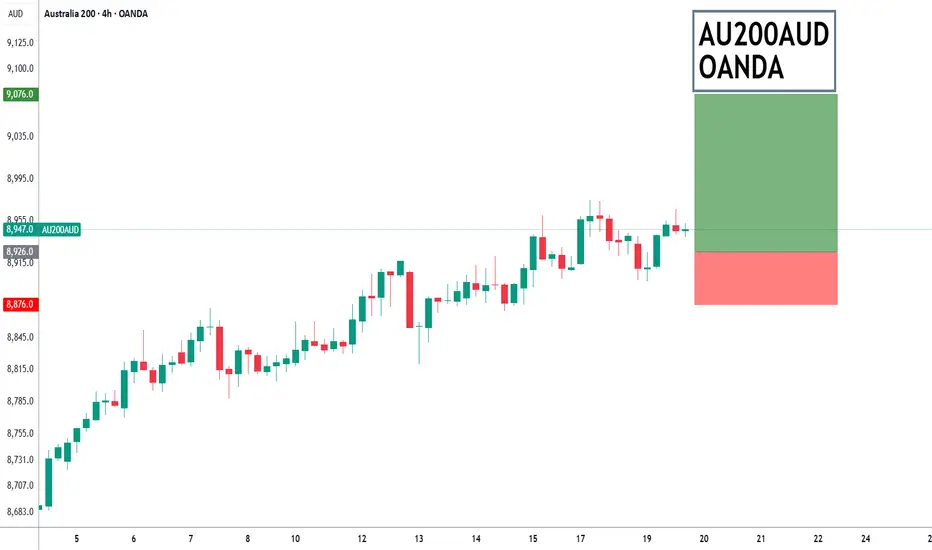
ASX intraday dips continue to attract buyers.ASX200 - 24h expiry
Price action resulted in a new all-time high at 8974.
Offers ample risk/reward to buy at the market.
Intraday dips continue to attract buyers and there is no clear indication that this sequence for trading is coming to an end.
Price action continues to trade around the all-time highs.
20 4hour EMA is at 8925.
We look to Buy at 8926 (stop at 8876)
Our profit targets will be 9076 and 9096
Resistance: 8974 / 9000 / 9050
Support: 8898 / 8820 / 8788
Risk Disclaimer
The trade ideas beyond this page are for informational purposes only and do not constitute investment advice or a solicitation to trade. This information is provided by Signal Centre, a third-party unaffiliated with OANDA, and is intended for general circulation only. OANDA does not guarantee the accuracy of this information and assumes no responsibilities for the information provided by the third party. The information does not take into account the specific investment objectives, financial situation, or particular needs of any particular person. You should take into account your specific investment objectives, financial situation, and particular needs before making a commitment to trade, including seeking, under a separate engagement, as you deem fit.
You accept that you assume all risks in independently viewing the contents and selecting a chosen strategy.
Where the research is distributed in Singapore to a person who is not an Accredited Investor, Expert Investor or an Institutional Investor, Oanda Asia Pacific Pte Ltd (“OAP“) accepts legal responsibility for the contents of the report to such persons only to the extent required by law. Singapore customers should contact OAP at 6579 8289 for matters arising from, or in connection with, the information/research distributed.
Bearish potential detected for SDFEntry conditions:
(i) lower share price for ASX:SDF along with swing of DMI indicator towards bearishness and RSI downwards, and
(ii) observing market reaction around the share price of $5.89 (open of 20th June).
Stop loss for the trade would be:
(i) above the potential prior resistance of $6.08 from the open of 4th December 2024, or
(i) above the potential prior resistance of $6.19 from the open of 3rd July 2024, depending on risk tolerance.

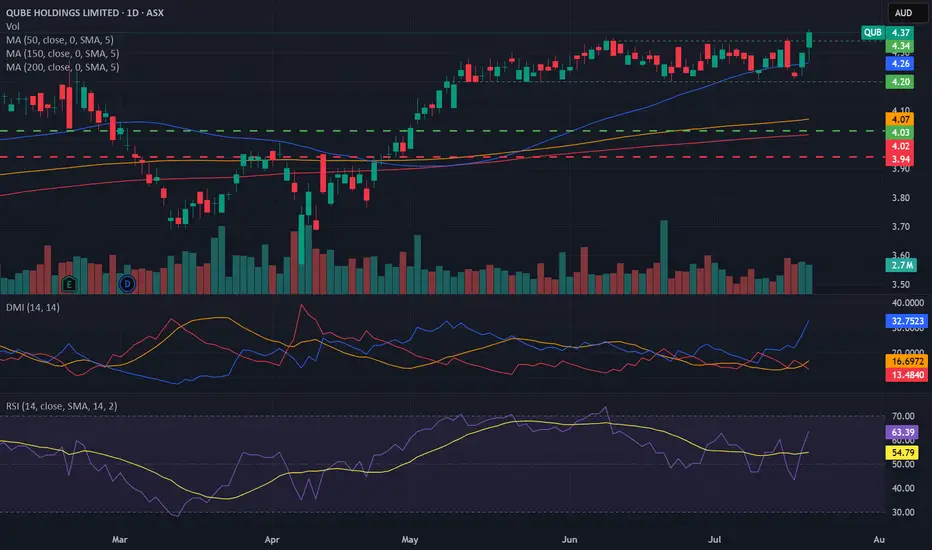
Bullish potential detected for QUBEntry conditions:
(i) higher share price for ASX:QUB along with swing up of indicators such as DMI/RSI.
Depending on risk tolerance, the stop loss for the trade would be:
(i) a close below the bottom of the formed channel (i.e.: below $4.20), or
(ii) below previous support of $4.11 from the open of 9th May, or
(iii) below the rising 150 day moving average (currently $4.07).
Potential outside week and bullish potential for CNIEntry conditions:
(i) higher share price for ASX:CNI above the level of the potential outside week noted on 4th July (i.e.: above the level of $1.795).
Stop loss for the trade would be:
(i) below the low of the outside week on 30th June (i.e.: below $1.655), should the trade activate.

ASX200 continues to trade around the all time highs.ASX200 - 24h expiry
Price action resulted in a new all-time high at 8910.
There is no clear indication that the upward move is coming to an end.
The lack of interest is a concern for bears.
Price action continues to trade around the all-time highs.
20 4hour EMA is at 8848.
We look to Buy at 8851 (stop at 8807)
Our profit targets will be 8981 and 9001
Resistance: 8910 / 8950 / 9000
Support: 8865 / 8830 / 8788
Risk Disclaimer
The trade ideas beyond this page are for informational purposes only and do not constitute investment advice or a solicitation to trade. This information is provided by Signal Centre, a third-party unaffiliated with OANDA, and is intended for general circulation only. OANDA does not guarantee the accuracy of this information and assumes no responsibilities for the information provided by the third party. The information does not take into account the specific investment objectives, financial situation, or particular needs of any particular person. You should take into account your specific investment objectives, financial situation, and particular needs before making a commitment to trade, including seeking, under a separate engagement, as you deem fit.
You accept that you assume all risks in independently viewing the contents and selecting a chosen strategy.
Where the research is distributed in Singapore to a person who is not an Accredited Investor, Expert Investor or an Institutional Investor, Oanda Asia Pacific Pte Ltd (“OAP“) accepts legal responsibility for the contents of the report to such persons only to the extent required by law. Singapore customers should contact OAP at 6579 8289 for matters arising from, or in connection with, the information/research distributed.

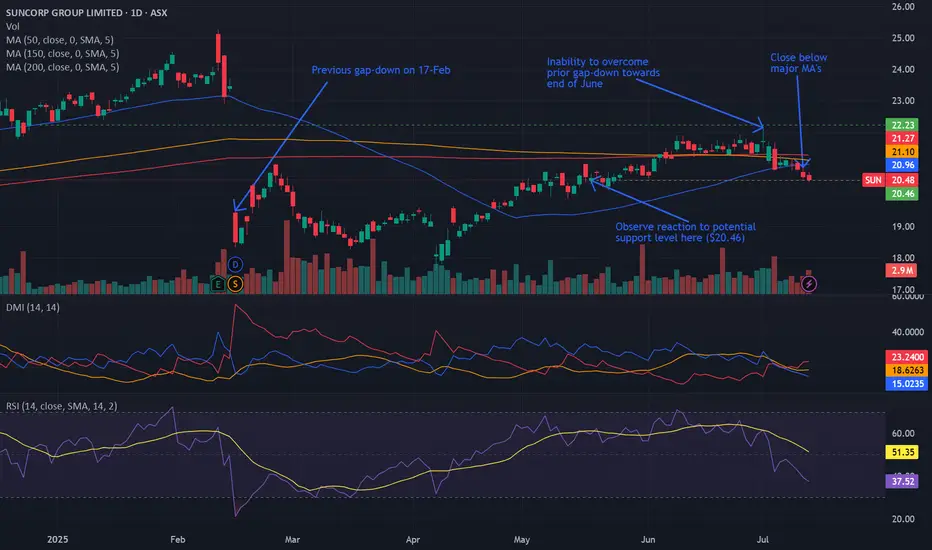
Bearish potential detected for SUNEntry conditions:
(i) lower share price for ASX:SUN along with swing of DMI indicator towards bearishness and RSI downwards, and
(ii) observing market reaction around the share price of $20.46 (open of 19th May).
Stop loss for the trade would be:
(i) above the potential prior resistance of $21.36 from the open of 5th June, or
(i) above the high of the recent swing high once the trade is activated (currently $22.14 from the high of 1st July), depending on risk tolerance.
Bearish potential detected for AGLEntry conditions:
(i) breach of the lower confines of the Darvas box formation for ASX:AGL
- i.e.: below low of $9.84 of 7th April, and
(ii) swing increased bearishness of indicators such as DMI/RSI along with a test of prior level of support of $10.02 from 11th March.
Stop loss for the trade (based upon the Darvas box formation) would be:
(i) above the high of 10th April (i.e.: above $10.89), or
(ii) above the prior support level from the open of 10th January (i.e.: above $11.15), depending on risk tolerance.

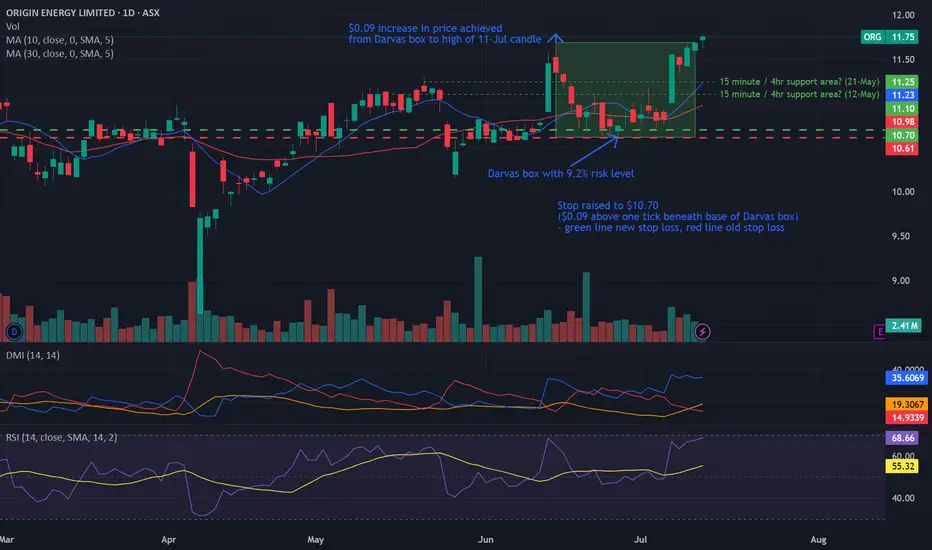
Bullish potential detected for ORGEntry conditions:
(i) breach of the upper confines of the Darvas box formation for ASX:ORG
- i.e.: above high of $11.69 of 16th June (most conservative entry), and
(ii) swing up of indicators such as DMI/RSI.
Stop loss for the trade (based upon the Darvas box formation) would be:
(i) below the support level from the low of 26th June (i.e.: below $10.62).
Bullish potential detected for TLCEntry conditions:
(i) higher share price for ASX:TLC along with swing up of the DMI indicators and swing up of the RSI indicator, and
(ii) observation of market reaction at the support/resistance level at $5.31 (from the open of 12th May).
Stop loss for the trade would be, dependent of risk tolerance (once the trade is activated):
(i) below the support level from the open of 21st November (i.e.: below $5.05), or
(ii) below the recent swing low of 3rd June (i.e.: below $4.96).

Potential outside week and bullish potential for CXOEntry conditions:
(i) higher share price for ASX:CXO above the level of the potential outside week noted on 27th June (i.e.: above the level of $0.1025).
Stop loss for the trade would be:
(i) below the low of the outside week on 20th June (i.e.: below $0.083), should the trade activate.

IPH 40% move coming?IPH has recently emerged from a descending wedge pattern, supported by bullish divergences in both the RSI and OBV, along with several divergences observed in shorter time frames. A pullback to the $5 level is anticipated, as the stock appears weaker on these smaller time frames. If IPH can maintain its position above the recent low of $4.40, it will indicate a structural shift, establishing higher highs and higher lows. My initial target is in the $6.50 range, followed by a potential move just above $7, representing a 40% increase. Good luck and happy trading 🍀

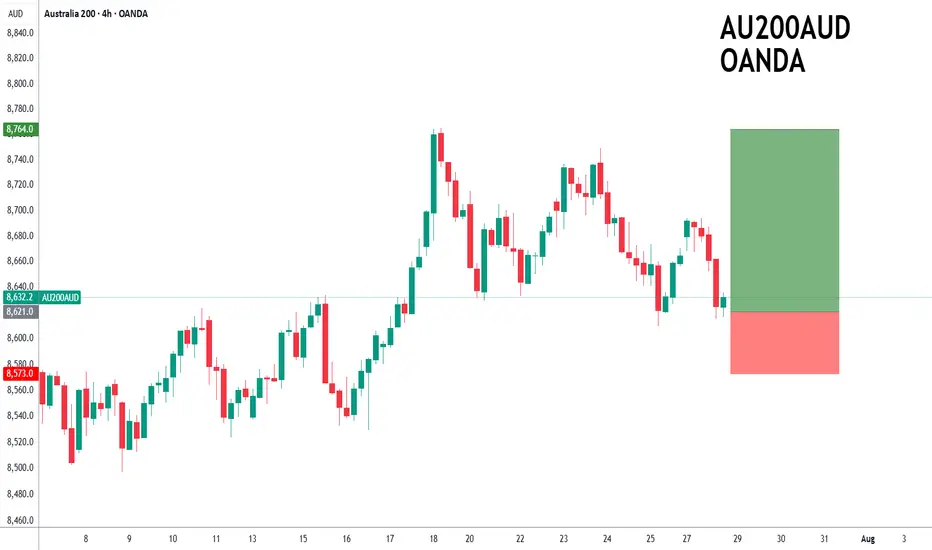
ASX200 to find support at current market price?ASX200 - 24h expiry
The primary trend remains bullish.
Price action continues to trade around the all-time highs.
20 1day EMA is at 8619.
Offers ample risk/reward to buy at the market.
Our outlook is bullish.
We look to Buy at 8621 (stop at 8573)
Our profit targets will be 8764 and 8794
Resistance: 8670 / 8694 / 8749
Support: 8610 / 8570 / 8524
Risk Disclaimer
The trade ideas beyond this page are for informational purposes only and do not constitute investment advice or a solicitation to trade. This information is provided by Signal Centre, a third-party unaffiliated with OANDA, and is intended for general circulation only. OANDA does not guarantee the accuracy of this information and assumes no responsibilities for the information provided by the third party. The information does not take into account the specific investment objectives, financial situation, or particular needs of any particular person. You should take into account your specific investment objectives, financial situation, and particular needs before making a commitment to trade, including seeking, under a separate engagement, as you deem fit.
You accept that you assume all risks in independently viewing the contents and selecting a chosen strategy.
Where the research is distributed in Singapore to a person who is not an Accredited Investor, Expert Investor or an Institutional Investor, Oanda Asia Pacific Pte Ltd (“OAP“) accepts legal responsibility for the contents of the report to such persons only to the extent required by law. Singapore customers should contact OAP at 6579 8289 for matters arising from, or in connection with, the information/research distributed.
Bullish potential detected for WDSEntry conditions:
(i) higher share price for ASX:WDS along with swing up of the DMI indicators and swing up of the RSI indicator, and
(ii) observation of market reaction at the support/resistance level at $24.87 (from the open of 14th February).
Stop loss for the trade would be, dependent of risk tolerance (once the trade is activated):
(i) below the support level from the open of 15th July (i.e.: below $23.95), or
(ii) below the recent swing low of 30th June (i.e.: below $23.24).
NOTE: Positive momentum move on 23rd July already in play (suggested not to chase this initial move and await a retracement back towards the support/resistance level of $24.87 and observe the market reaction - potentially overbought with resistance above current price area of $26.20 as at 25th July). If the move keeps going, let it go.

Potential outside week and bearish potential for HCWEntry conditions:
(i) lower share price for ASX:HCW below the level of the potential outside week noted on 4th July (i.e.: below the level of $0.72).
Stop loss for the trade would be:
(i) above the high of the outside week on 30th June (i.e.: above $0.785), should the trade activate.
