ATA/USDT — Historical Support: Major Accumulation or Breakdown?Overview:
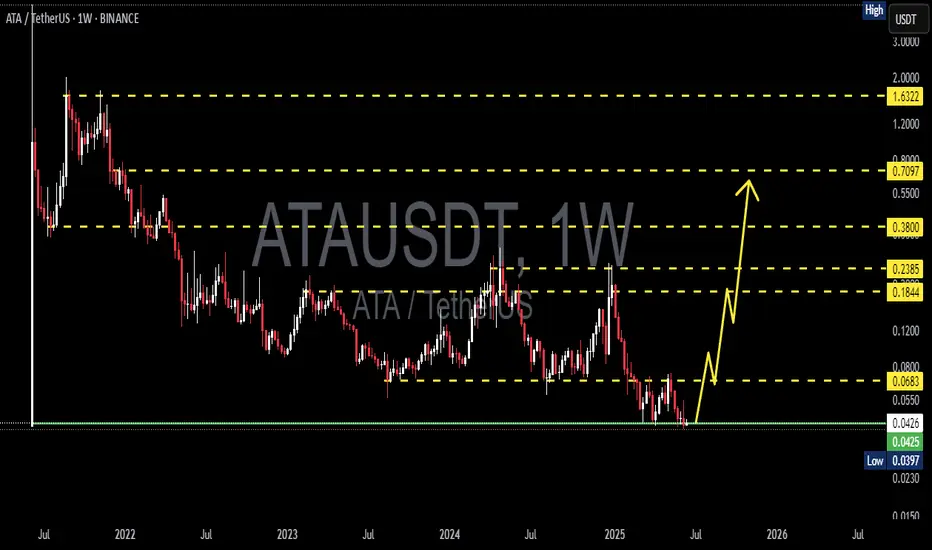
ATA/USDT has been in a long-term downtrend since 2021, consistently printing lower highs as selling pressure dominates. However, the market is now showing signs of a critical consolidation phase around the historical support zone at 0.028 – 0.044 (yellow box). This area has acted as a major demand zone multiple times, making it a key battleground to determine whether ATA is preparing for a potential accumulation base before a trend reversal, or if a deeper bearish continuation is on the horizon.
---
🔍 Pattern & Price Structure Analysis
1. Key Support (0.028 – 0.044):
Tested multiple times since 2022.
Long wicks suggest strong buying liquidity emerges here.
If it holds, this area may become the foundation for accumulation.
2. Major Resistance Levels:
0.0683 → the first key breakout level that must be reclaimed.
0.1844 – 0.3800 → mid-term targets if momentum builds.
0.7097 – 1.6322 → long-term recovery targets if a full reversal occurs.
3. Chart Pattern:
Long-term descending structure since 2021.
Now forming a horizontal range at the bottom, which can be read as a descending triangle or an early accumulation phase.
Volatility compression indicates the market is waiting for a major breakout catalyst.
---
📈 Bullish Scenario
Confirmation: Weekly close above 0.0683 + successful retest.
Short-term target: 0.0683 (first breakout checkpoint).
Mid-term target: 0.1844 → potential +300% from current levels.
Long-term targets: 0.3800 and even 0.7097 if strong momentum follows.
Bullish narrative: A breakout here would shift structure from downtrend to trend reversal, potentially leading to a parabolic phase.
---
📉 Bearish Scenario
Confirmation: Weekly close below 0.035 – 0.028.
Downside target: Fresh lows below 0.028, opening uncharted territory without strong historical support.
Bearish narrative: A breakdown would signal buyer exhaustion, leading to potential capitulation and deeper downside.
---
🧠 Strategy Notes
Conservative approach: Wait for breakout >0.0683 to confirm a trend reversal before entering.
Aggressive approach: DCA entries around 0.035 – 0.044 with disciplined stop-loss (e.g., <0.028).
Risk management: Crucial here, as the broader trend remains bearish until a breakout confirms otherwise.
---
✨ Conclusion
ATA/USDT is at a make-or-break level. Will this historical support zone serve as the foundation for a major accumulation phase that sparks a multi-month bullish reversal, or will it break down into new lows?
The answer will likely unfold in the coming weekly candles. Watch 0.0683 above and 0.028 below as the key decision levels.
---
#ATAUSDT #Crypto #Altcoins #TechnicalAnalysis #PriceAction #Accumulation #Breakout #BearishOrBullish #CryptoStrategy #SupportAndResistance
Ataanaylsis

ATAUSDT 1W AnalysisATA ~ 1W Analysis
#ATA This is the lowest price at the launch of this coin. Buy if you are ready to take the risk in this trade. Short term target is at least 15%+.
ATAUSDT 1D Analysis ATA ~ 1D Analysis
#ATA Buy after successfully breaking this resistance line or buy when retesting this support block with a short-term target of at least 10%++.

ATAUSDT 1WATA ~ 1W Analysis
#ATA This trade is very high risk. Buy from here with a short -term target of at least 15%+. This is the lowest support for now.

ATAUSDT 1WATA ~ 1W Analysis
#ATA Buy gradually from here if you still have a Conviction on this Coin.
This is the lowest price at the time of this coin launch.

ATAUSDT 1WATA ~ 1W Analysis
#ATA This is the lowest support for now, you can buy gradually from here with a minimum target of 20%+

ATAUSDT.4HThe 4-hour chart for Automata (ATA/USDT) shows a price attempting to stabilize after a recent drop. The current price is around $0.2453, with a strong resistance level (R1) indicated by the downward trendline. There’s a support level (S1) at $0.1224, which seems to have held through recent tests. A secondary support level (S2) is not clearly marked on this chart.
The RSI is slightly above the midpoint at 61.97, indicating a bit of bullish momentum in the short term. However, the MACD is quite close to the signal line, suggesting that there isn’t a strong momentum in either direction.
Traders might watch for potential bullish signs, such as a break above the trendline resistance R1, which could open the way for a move towards the previous high around $0.2994. Alternatively, a failure to break the resistance could lead to a retest of the S1 level. It would be wise to consider volume as a confirmation for any potential breakout or breakdown.

ATAUSDT.4HThe 4-hour chart for Automata (ATA/USDT) suggests a volatile market with a sharp decline followed by a swift recovery. The price has rebounded from the low around $0.0782, rallying past the $0.1200 support level, which is now acting as immediate support (S1). The RSI has recovered to a neutral position at 55.08, indicating some balance between buyers and sellers after the recent price movement.
Currently, the price is at $0.1746. The first resistance level (R1) to watch is at $0.2322. A break and close above this level could signal further bullish momentum, potentially targeting previous highs around $0.2749. For traders looking to enter a long position, a reasonable strategy might be to wait for a retest of the $0.1200 level as new support or a clear break above $0.2322, setting a stop loss below S1.
On the flip side, if the price falls back below the support at $0.1200, it would suggest weakness and could lead to a test of the lower levels. It's important to keep an eye on the RSI for divergence that might indicate a weakening of the current trend.

ATA/USDT Bullish ride boom from demand?🚀 ATA BOOM💎 Yello ladies and gentlemen! Get ready for an exciting chance with #ATAUSDT as we've spotted it bouncing around in a range, hinting at potential price movements ahead.
💎 Checking out #ATA, it's been giving a nod to its short-term resistance (RI). We're eyeing a bullish leap from the demand zone at $0.0835, but that's banking on the price keeping up its energy at this level. If it manages to do so, we might just see it bust through RI and embark on a bullish journey.
💎 Ready to catch every opportunity? Keep your eyes peeled if the ASX:ATA slips below the DZ. In that case, a cool, calculated wait for a bullish swing from the lower demand zone at $0.0782 is the move, thanks to the juicy liquidity waiting there. Dipping below that? Brace for a possible dip.

ATA is going bullish if this scenario happenedfirst thing we need to see a falsebreak out on this support level 0.919$ then go up and break the ressistance of 0.985$ and we see the firs higher high if that happened then ata is goin bollish
this is my analyse it's not a recomandation to buy or sell !!

Atausdt Breaks Falling Wedge In daily Timeframe Breakout Has Already Done
For Perfect Entry I Would Love To Enter On Retest
Expecting 200% bulish Wave In Midterm

ATA may bounce back from the support ATA may bounce back from the support and retest the upper side of the triangle.
Thanks and happy trading.
