ATA/USDT — Historical Support: Major Accumulation or Breakdown?Overview:
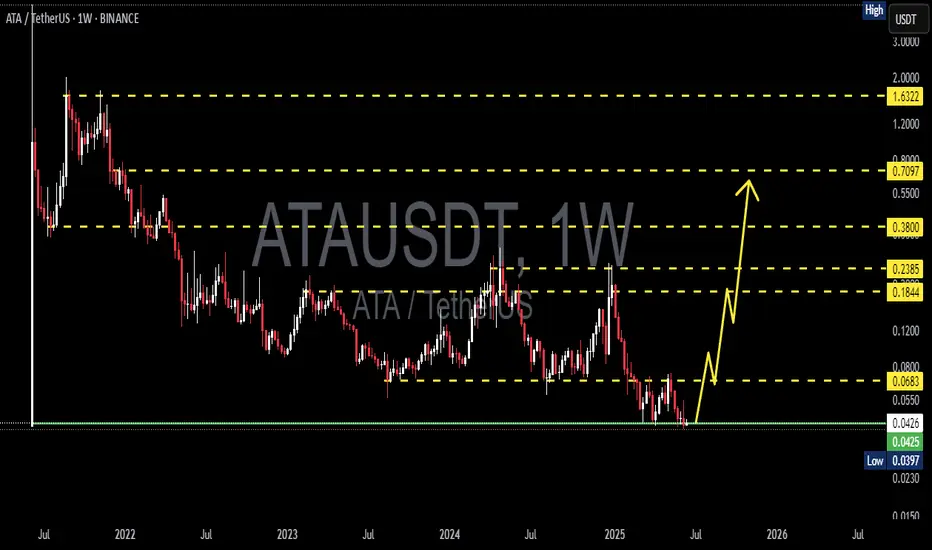
ATA/USDT has been in a long-term downtrend since 2021, consistently printing lower highs as selling pressure dominates. However, the market is now showing signs of a critical consolidation phase around the historical support zone at 0.028 – 0.044 (yellow box). This area has acted as a major demand zone multiple times, making it a key battleground to determine whether ATA is preparing for a potential accumulation base before a trend reversal, or if a deeper bearish continuation is on the horizon.
---
🔍 Pattern & Price Structure Analysis
1. Key Support (0.028 – 0.044):
Tested multiple times since 2022.
Long wicks suggest strong buying liquidity emerges here.
If it holds, this area may become the foundation for accumulation.
2. Major Resistance Levels:
0.0683 → the first key breakout level that must be reclaimed.
0.1844 – 0.3800 → mid-term targets if momentum builds.
0.7097 – 1.6322 → long-term recovery targets if a full reversal occurs.
3. Chart Pattern:
Long-term descending structure since 2021.
Now forming a horizontal range at the bottom, which can be read as a descending triangle or an early accumulation phase.
Volatility compression indicates the market is waiting for a major breakout catalyst.
---
📈 Bullish Scenario
Confirmation: Weekly close above 0.0683 + successful retest.
Short-term target: 0.0683 (first breakout checkpoint).
Mid-term target: 0.1844 → potential +300% from current levels.
Long-term targets: 0.3800 and even 0.7097 if strong momentum follows.
Bullish narrative: A breakout here would shift structure from downtrend to trend reversal, potentially leading to a parabolic phase.
---
📉 Bearish Scenario
Confirmation: Weekly close below 0.035 – 0.028.
Downside target: Fresh lows below 0.028, opening uncharted territory without strong historical support.
Bearish narrative: A breakdown would signal buyer exhaustion, leading to potential capitulation and deeper downside.
---
🧠 Strategy Notes
Conservative approach: Wait for breakout >0.0683 to confirm a trend reversal before entering.
Aggressive approach: DCA entries around 0.035 – 0.044 with disciplined stop-loss (e.g., <0.028).
Risk management: Crucial here, as the broader trend remains bearish until a breakout confirms otherwise.
---
✨ Conclusion
ATA/USDT is at a make-or-break level. Will this historical support zone serve as the foundation for a major accumulation phase that sparks a multi-month bullish reversal, or will it break down into new lows?
The answer will likely unfold in the coming weekly candles. Watch 0.0683 above and 0.028 below as the key decision levels.
---
#ATAUSDT #Crypto #Altcoins #TechnicalAnalysis #PriceAction #Accumulation #Breakout #BearishOrBullish #CryptoStrategy #SupportAndResistance
Atausdtanalysis

ATAUSDT 1W AnalysisATA ~ 1W Analysis
#ATA This is the lowest price at the launch of this coin. Buy if you are ready to take the risk in this trade. Short term target is at least 15%+.
ATAUSDT 1D Analysis ATA ~ 1D Analysis
#ATA Buy after successfully breaking this resistance line or buy when retesting this support block with a short-term target of at least 10%++.

ATAUSDT 1WATA ~ 1W Analysis
#ATA This trade is very high risk. Buy from here with a short -term target of at least 15%+. This is the lowest support for now.

ATAUSDT 1WATA ~ 1W Analysis
#ATA Buy gradually from here if you still have a Conviction on this Coin.
This is the lowest price at the time of this coin launch.

ATAUSDT 1WATA ~ 1W Analysis
#ATA This is the lowest support for now, you can buy gradually from here with a minimum target of 20%+

ATAUSDT Analysis: Patience Over ImpulsivenessATAUSDT Analysis: Patience Over Impulsiveness
In trading, a trade not taken is better than a losing one . ATAUSDT has shown significant volume increase , and the price has risen rapidly. Despite this, I have no intention of chasing it at these levels. Staying disciplined and waiting for meaningful setups is always preferable to impulsive entries.
Key Points:
Volume Surge: Exceptional increase in trading volume highlights strong activity.
Rapid Price Movement: Current price levels are overextended after a sharp rise.
Risk Management: Avoid chasing; wait for retracement or a better setup.
Confirmation Indicators: I will use CDV, liquidity heatmaps, volume profiles, volume footprints, and upward market structure breaks on lower time frames for validation.
Learn With Me: If you want to master how to use CDV, liquidity heatmaps, volume profiles, and volume footprints to identify precise demand zones, just DM me. I’d be happy to guide you!
Reminder: The market rewards patience and discipline. Don’t rush into trades without solid confirmation.
If you think this analysis helps you, please don't forget to boost and comment on this. These motivate me to share more insights with you! Wishing everyone success in their trades.
If you think this analysis helps you, please don't forget to boost and comment on this. These motivate me to share more insights with you!
I keep my charts clean and simple because I believe clarity leads to better decisions.
My approach is built on years of experience and a solid track record. I don’t claim to know it all, but I’m confident in my ability to spot high-probability setups.
If you would like to learn how to use the heatmap, cumulative volume delta and volume footprint techniques that I use below to determine very accurate demand regions, you can send me a private message. I help anyone who wants it completely free of charge.
My Previous Analysis (the list is long but I think it's kinda good : )
🎯 ZENUSDT.P: Patience & Profitability | %230 Reaction from the Sniper Entry
🐶 DOGEUSDT.P: Next Move
🎨 RENDERUSDT.P: Opportunity of the Month
💎 ETHUSDT.P: Where to Retrace
🟢 BNBUSDT.P: Potential Surge
📊 BTC Dominance: Reaction Zone
🌊 WAVESUSDT.P: Demand Zone Potential
🟣 UNIUSDT.P: Long-Term Trade
🔵 XRPUSDT.P: Entry Zones
🔗 LINKUSDT.P: Follow The River
📈 BTCUSDT.P: Two Key Demand Zones
🟩 POLUSDT: Bullish Momentum
🌟 PENDLEUSDT.P: Where Opportunity Meets Precision
🔥 BTCUSDT.P: Liquidation of Highly Leveraged Longs
🌊 SOLUSDT.P: SOL's Dip - Your Opportunity
🐸 1000PEPEUSDT.P: Prime Bounce Zone Unlocked
🚀 ETHUSDT.P: Set to Explode - Don't Miss This Game Changer
🤖 IQUSDT: Smart Plan
⚡️ PONDUSDT: A Trade Not Taken Is Better Than a Losing One
💼 STMXUSDT: 2 Buying Areas
🐢 TURBOUSDT: Buy Zones and Buyer Presence
🌍 ICPUSDT.P: Massive Upside Potential | Check the Trade Update For Seeing Results
🟠 IDEXUSDT: Spot Buy Area | %26 Profit if You Trade with MSB
📌 USUALUSDT: Buyers Are Active + %70 Profit in Total
🌟 FORTHUSDT: Sniper Entry +%26 Reaction
🐳 QKCUSDT: Sniper Entry +%57 Reaction
📊 BTC.D: Retest of Key Area Highly Likely
I stopped adding to the list because it's kinda tiring to add 5-10 charts in every move but you can check my profile and see that it goes on..

ATA COIN PRICE ANALYSIS AND NEXT POSSIBLE MOVES!!ASX:ATA Coin!!
• 2 major areas where we can expect now potential bounce back in its price🥷
• On First Support Don't Build trade without SL🚨
Warning : That's just my analysis DYOR Before Taking any trade.

ATAUSDT 1WATA ~ 1W
#ATA So far it continues to maintain this support block. Buy gradually on this support block,. with a short term target of at least 20%++

ATAUSDT 1WATA ~ 1W
#ATA ~ If you still have Conviction on this coin,. Buy gradually within this support block,. with a minimum target of 20%+. Breaking this resistance line is only a matter of time.

ATAUSDTATA ~ 1W
#ATA So far this support block has been able to hold the price from falling lower. if you have Conviction on this coin. maybe buying on this support block would be a good buy for now.

Ata price analysis! Main targets on the wayHow high Automata can move this cycle? It's hard to say always about the exact top, but we can build a strategy where to fix profit step by step! DCA works in both ways, for accumulation and distribution. BINANCE:ATAUSDT
Possible Targets and explanation idea
➡️Weekly tf. IAP model on W. August 2023 formed main sell side liquidity
➡️Same time period accumulation big investors by Direction indicator
➡️Blue column showed on Money Power Indicator where money inflow
➡️Step by step usually after 50-100% profit you could see money outflow from main capital, they leave free coins because dont want to risk full amount of money! smart move
➡️Targets marked by flags where ok fix profit step by step
➡️First middle term target will be Monthly FVG and 27 block zone.
➡️ Top can be around 2$ - 1b market cap in most positive scenario
Hope you enjoyed the content I created, You can support with your likes and comments this idea so more people can watch!
✅Disclaimer: Please be aware of the risks involved in trading. This idea was made for educational purposes only not for financial Investment Purposes.
---
• Look at my ideas about interesting altcoins in the related section down below ↓
• For more ideas please hit "Like" and "Follow"!

Ideas you need when investing "ATAUSDT"Hello, friends. Nice to meet you
This chart exhibits a classic Adam and Eve pattern. A decisive breach above the red neckline (resistance) could propel prices towards the green line (target).

ATAUSD 1WATA ~ 1W 📈
#ATA Retest of the support line of this pattern has been successful. we will start making purchases gradually from here with a minimum target of 15%+

Long trade setup for ATAUSDTFor the BINANCE:ATAUSDT.P Long Trade Setup, the following values are suitable for our interval trade:
Entry: 0.0796
Target: 0.0836
Stop: 0.0775
Cost Reduction: -
The profit is reasonable relative to the risk.
*This is not investment advice; you can lose money. Crypto AI Signals is not responsible for any trades. 🚫💰

ATAUSDT Triple Bottom!ATAUSDT Technical analysis update
Buy zone : Below $0.0820
Stop loss : $0.0775
Take Profit 1 : $0.086
Take Profit 2 : $0.093
Take Profit 3 : $0.104
Thanks
Hexa

ATA : UPCOMING VOLUMEATA seems to have an upcoming volume, we will follow it to see if it's able to get confirmation.

ATAUSDTWhat Is Automata (ATA)?
Automata is a high-performance compute protocol that empowers Web 3.0 applications and businesses with privacy-first, high assurance, and friction-less transactions. Its mission is to provide the functionalities and infrastructure necessary to realize the vision of a seamless Web 3.0 experience. It tackles the lack of transparency in data ownership, censorship, and intrusion into personal privacy.
Automata’s products include:
Privacy-first cross-chain service plane: Automata offers privacy services for various blockchains that let users control their data.
Shielded and unbiased compute plane:the degree of privacy of computation in Automata can be stronger than in centralized web services like AWS.
Elastic and scalable control plane: it is operated by a group of staking nodes and governs interactions between participants of the protocol.
Ledger plane: Automata provides interfaces for multiple blockchains to exchange data and cooperate on the agreed set of data in an atomic and privacy-preserving manner.

ALong

Automata Network (ATA) formed Gartley for upto 1300% big moveHi dear friends, hope you are well and welcome to the new update on Automata Network ( ATA ) token with BTC pair.
Previously we had a nice trade of ATA:
On a weekly time frame chart, the price action of ATOM has formed a big bullish Butterfly pattern.
Note: Above idea is for educational purpose only. It is advised to diversify and strictly follow the stop loss, and don't get stuck with trade.

Automata Network (ATA) Price PredictionAutomata Network (ATA) Price Prediction. chart pattern
this is not financial advice

ATAUSDT BEARISH FLAG FORMATIONATAUSDT BEARISH FLAG FORMATION
Just follow when break below. Trade target is in graph. Enjoy it!

#ATAUSDT Scalp Setup 90% profit expected.This is a quick trade setup.
Scalping Setup:-
ATA broke out of the resistance and is currently trading above 2 important MAs.
Currently trading inside a microchannel. Breakout looks imminent. Break above $.4185 will trigger a 15%+ Rally!
ATAUSDT :- Long Position
Entry :- $.3847 to $.4080
Targets:-
$.4177
$.4376
$.4462
$.4582
Stop Loss :- $.3756
SL is a must and enter partially!
Leverage:- As per your convenience.
with 5x leverage and an 18% pump from the current market price could give us a 90% profit.
DYOR before taking this trade.
Thank you
