Apple Stock Setup: Momentum and Patterns Point Toward New ATHA deep dive into Apple’s latest technical setup, analyzing MACD momentum, RSI strength, and emerging chart patterns that signal a potential breakout toward a new all-time high around $290.
Athbreakout

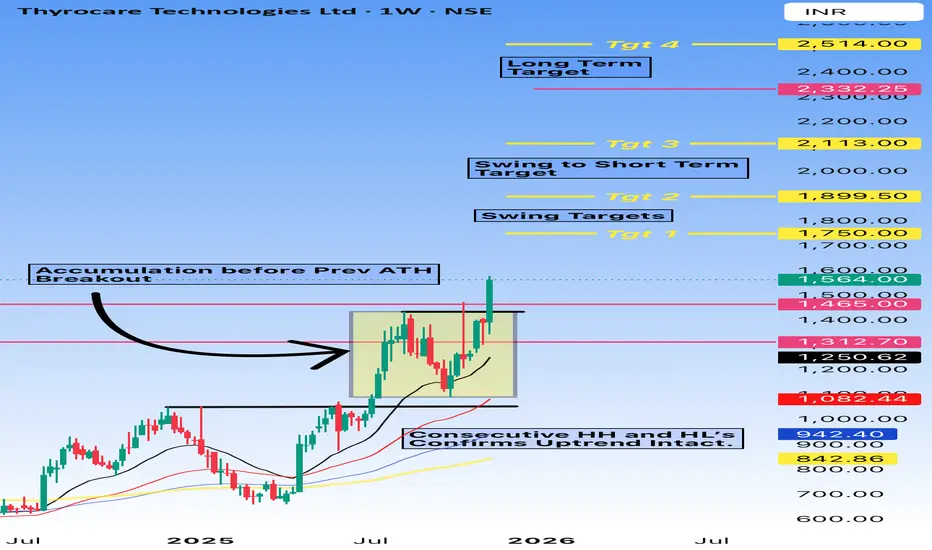
Thyrocare Long - ATH BreakoutThe Chart says it all.
Thyrocare is displaying strong #bullish #momentum, breaking out confidently after a solid period of #accumulation.
The structure is clean—consecutive higher highs and higher lows keep the #uptrend firmly intact.
Price has surged above key resistance levels, turning them into support, and is now marching toward multiple #swing and long-term #targets.
Overall, the chart reflects renewed strength, buyer dominance, and clear upside potential as the trend continues to build. 🚀📈
Levels and Targets in chart.
Disclaimer:
I am not a SEBI-registered advisor. The analysis shared is purely for educational and informational purposes and should not be considered investment or trading advice. Please consult a SEBI-registered financial advisor before making any investment decisions.
Trading and investing in the markets involve risk; you should perform your own research and due diligence.
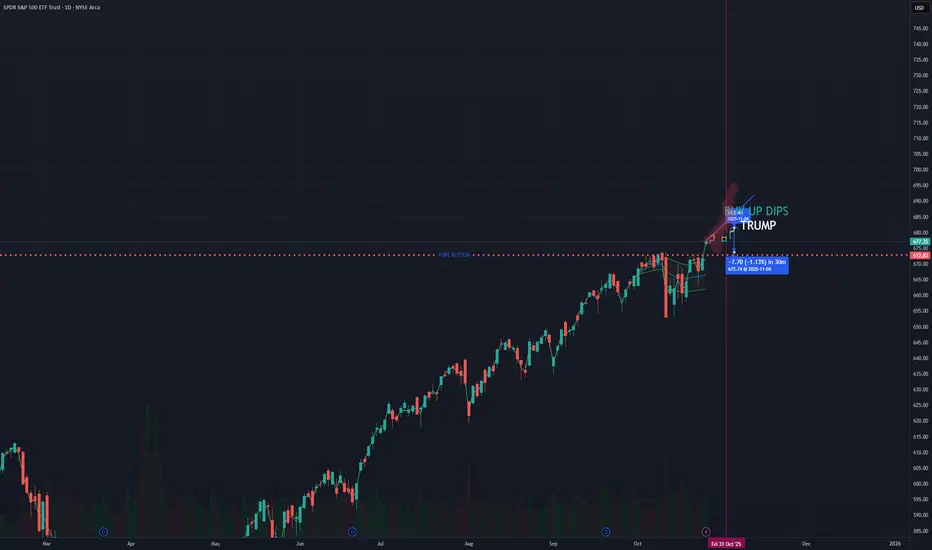
Trading week 10/27 - 10/31 ATH INCOMING! we are the quant and a big week is approaching us we used all the data with economic data, earnings & geopolitical events coming up.
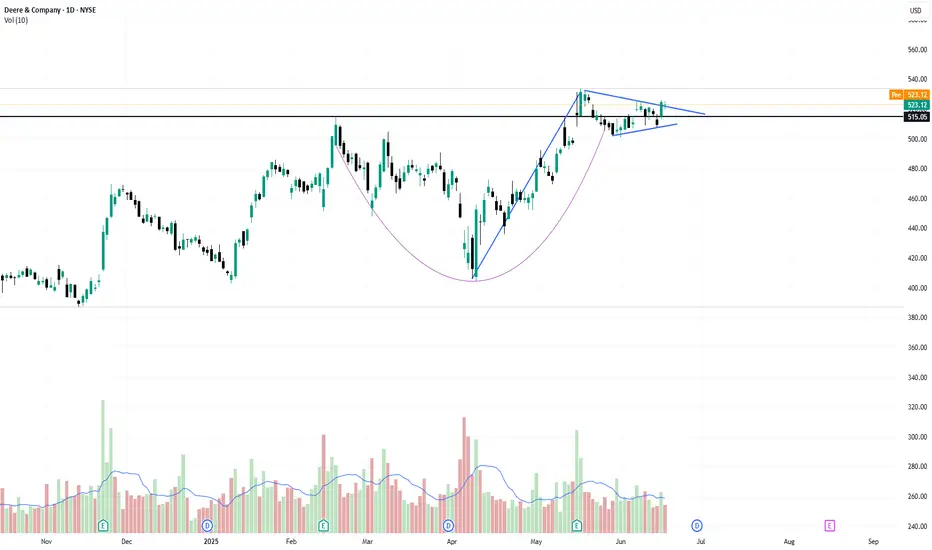
the wedge pattern breakout near ATHStock is outperforming the index and trading near its all-time high and forming a small wedge pattern, indicating consolidation before a potential breakout. A sustained move above $507.50 could trigger bullish momentum. Targeting $553 in the near term. Risk-reward remains favorable with strong price structure and bullish sentiment.
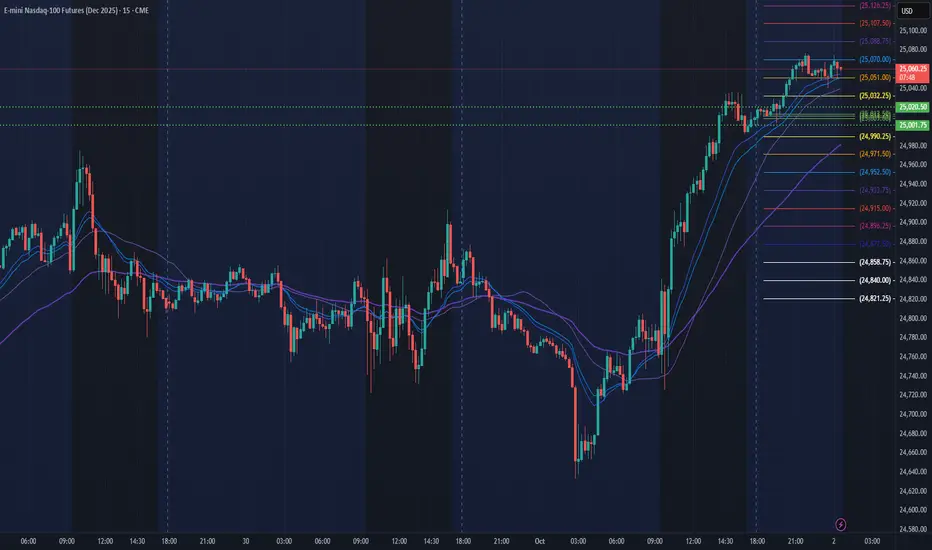
NQ Power Range Report with FIB Ext - 10/2/2025 SessionCME_MINI:NQZ2025
- PR High: 25020.25
- PR Low: 25001.75
- NZ Spread: 41.5
Key scheduled economic events:
08:30 | Initial Jobless Claims
ATH push continues
Session Open Stats (As of 12:15 AM)
- Session Open ATR: 271.02
- Volume: 21K
- Open Int: 285K
- Trend Grade: Long
- From BA ATH: -0.0% (Rounded)
Key Levels (Rounded - Think of these as ranges)
- Long: 25204
- Mid: 23571
- Short: 21939
Keep in mind this is not speculation or a prediction. Only a report of the Power Range with Fib extensions for target hunting. Do your DD! You determine your risk tolerance. You are fully capable of making your own decisions.
BA: Back Adjusted
BuZ/BeZ: Bull Zone / Bear Zone
NZ: Neutral Zone
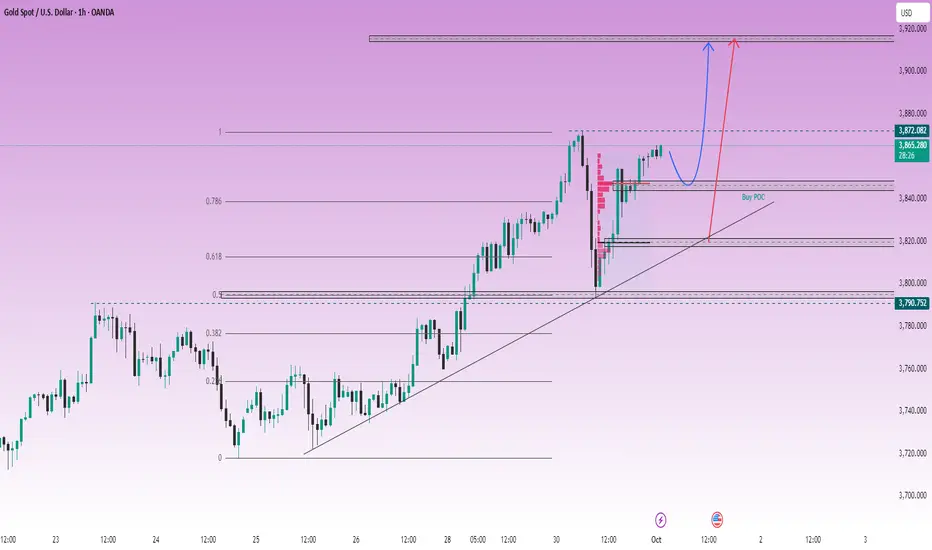
LiamTrading – Follow the Buy trend, target ATH 3915
The gold market continues to show the strength of the upward trend. After yesterday's shakeout, we witnessed a very clear Long Squeeze: all buying forces were forced to exit, but immediately after, the price quickly rebounded. This is the hallmark of a strong trend – the more it shakes out, the more momentum it creates for a new peak.
Today's perspective:
Continue to follow Buy, do not SELL against the trend.
The Buy position from 3797 is still held, if the price returns to retest, we will continue to add orders.
Prioritize observing the POC of the Volume Profile to place Buy orders, in case the price adjusts deeper, the VAL area coinciding with the rising trendline will be an extremely safe buying point.
Trading scenario
Buy 3847–3844, SL 3840, TP 3868 – 3880 – 3900 – 3915
Buy 3821–3819, SL 3814, TP 3835 – 3850 – 3868 – open
In summary: The upward trend remains extremely strong, the short-term target is ATH 3915. Just follow the trend, prioritize Buy to maximize profits.
This is my personal view on XAUUSD. Please follow the scenario and follow me to get the earliest updates.
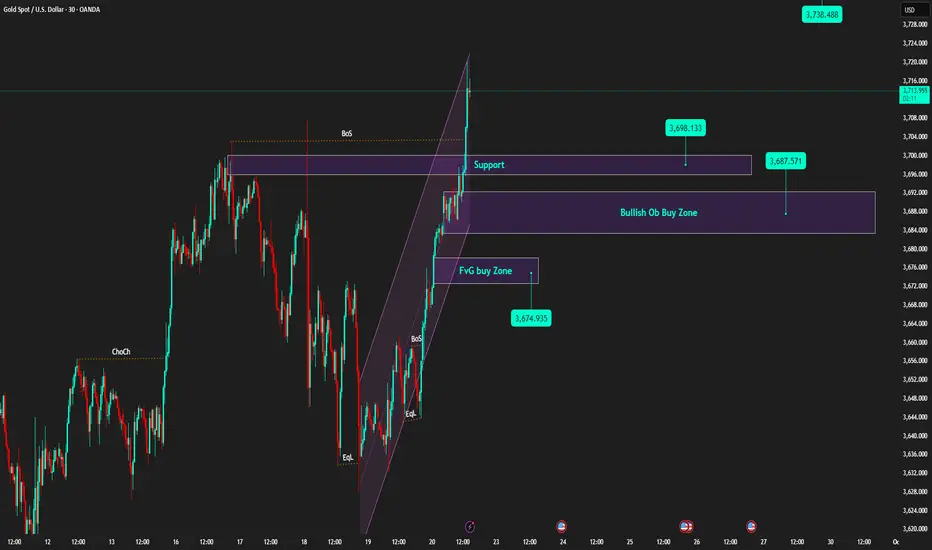
Weekly Candle High | Buy on Pullbacks to Support🟡 XAU/USD – 09/22 | Captain Vincent ⚓
🔎 Captain’s Log – Quick Overview
Last week, gold closed around 3,685, paving the way for further advances and the creation of a new ATH.
After the FED cut 25bps, Powell's 'brake' comments tempered the rise, but the overall trend remains bullish.
This morning, prices surged to 3,697.xx, currently adjusting slightly around 3,692 – 3,690 → a sensible strategy: wait for a pullback to continue Buying.
⏩ Captain’s Summary: The gold voyage still heads North, Buying remains the main choice, but wait for a pullback to board.
📈 Captain’s Chart – Technical Analysis
Golden Harbor (Support / Buy Zone):
Thin support: ~3,698 (recently broken old range peak).
OB Dock: 3,687 – 3,690.
FVG Dock: 3,672 – 3,676 (liquidity check on deep adjustments).
Storm Breaker (Resistance / Sell Zone):
3,714 – 3,720 (supply cluster / old ATH – likely to react).
Price Structure:
Continuous BoS series, price breaks out of short-term rising channel and creates higher highs → bullish remains the main trend.
🎯 Captain’s Map – Trading Plan (before US session)
✅ Buy (trend priority)
Buy Zone 1
Entry: 3,698 – 3,701
SL: 3,688
TP: 3,706 – 3,714 – 3,720+
Buy Zone 2 (OB)
Entry: 3,687 – 3,690
SL: 3,680
TP: 3,698 – 3,706 – 3,714 – 3,72x
Buy Zone 3 (FVG)
Entry: 3,672 – 3,676
SL: 3,664
TP: 3,687 – 3,706 – 3,714
⚡ Sell (only scalp when overbought)
Sell Zone (ATH test)
Entry: 3,740 – 3,738
SL: 3,750
TP: 3,730 – 3,720 – 3,695
Captain’s Note ⚓
“The new week opens with a high-closing candle, the gold ship continues its bullish course. Golden Harbor 🏝️ (3,690 – 3,672) is a safe anchorage for the crew to watch for Buys. Storm Breaker 🌊 (3,714 – 3,720) is a wave peak prone to gusts, suitable for Quick Boarding 🚤 short-term scalps. Before the US session, the sea might be choppy – hold the wheel tight and manage volume wisely.”
XAUUSD| POSSIBLE SELL MOVE AFTER NEWS EFFECT I am closely monitoring a significant price zone after observing that the market pushed upward, taking out liquidity above the order block (OB) before closing back below it. This movement appears to be influenced by recent news. As the price stabilizes, I am considering a selling opportunity, but only under specific conditions:
1. The price must first sweep Friday's high, then touch and react from the daily order block.
2. There should be a clear change of character (CHOCH) or break of structure (BOS) on the 1-hour chart.
3. A refined entry signal must be established on the 15-minute chart.
4. Execution of the trade can be either through limit orders or instant execution.
If these criteria are met, I will proceed with the trade. Otherwise, I will remain sidelines and wait for the London session, focusing on the potential for Asian liquidity.

NQ Power Range Report with FIB Ext - 9/18/2025 SessionCME_MINI:NQZ2025
- PR High: 24574.25
- PR Low: 24495.25
- NZ Spread: 176.5
Key scheduled economic events:
08:30 | Initial Jobless Claims
- Philadelphia Fed Manufacturing Index
Session Open Stats (As of 12:15 AM 9/18)
- Session Open ATR: 279.81
- Volume: 29K
- Open Int: 249K
- Trend Grade: Long
- From BA ATH: -0.0% (Rounded)
Key Levels (Rounded - Think of these as ranges)
- Long: 25217
- Mid: 22503
- Short: 21790
Keep in mind this is not speculation or a prediction. Only a report of the Power Range with Fib extensions for target hunting. Do your DD! You determine your risk tolerance. You are fully capable of making your own decisions.
BA: Back Adjusted
BuZ/BeZ: Bull Zone / Bear Zone
NZ: Neutral Zone

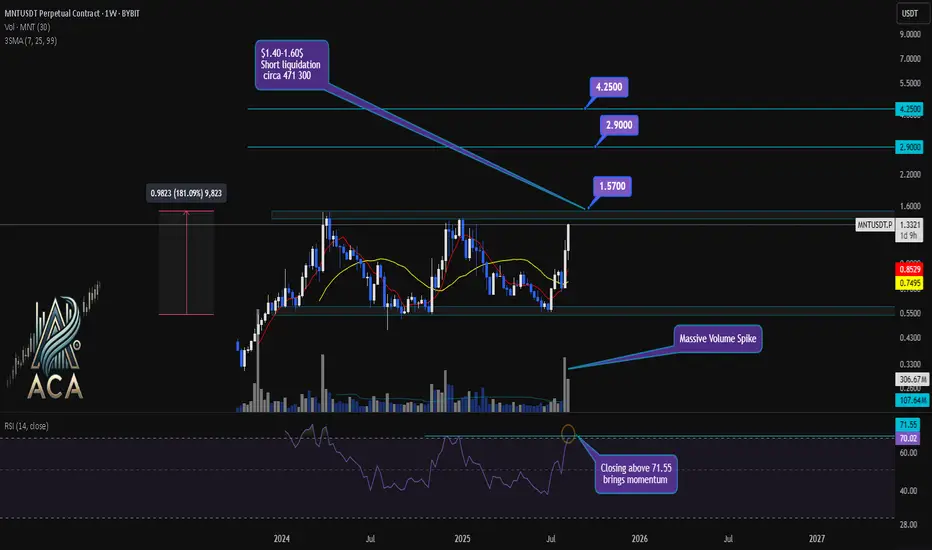
MNTUSDT Weekly Chart Analysis | Momentum & Key Targets UnveiledMNTUSDT Weekly Chart Analysis | Momentum & Key Targets Unveiled
🔍 Let’s dive into MNTUSDT perpetual contracts and decode the current price action, focusing on order flow, volume, liquidations, and momentum for top trading setups.
⏳ Weekly Overview
The weekly chart shows MNTUSDT surging out of a prolonged consolidation box, supported by a massive volume spike. This breakout is adding significant bullish momentum, as the RSI closes above the 71.55 level — a classic signal for trend acceleration and institutional interest.
🔺 Key Bullish Setup:
- Consolidation Box Break: Closing above the $1.57 level marks a safe entry; the order book above is lighter, giving price more freedom to move.
- Short Liquidation Cluster: Between $1.40-$1.60, nearly 471,300 MNT shorts are set for liquidation. Once price pushes through, liquidity fuel could trigger rapid upside.
- Upside Targets: Next objectives are $2.90 (approx. 90% up) and $4.25 (approx. 180% from the breakout), perfectly aligning with RR1 projections out of consolidation.
- Volume & Momentum: A massive volume influx supports the move, and RSI bolting past 71.55 on weeklies brings undeniable momentum.
📊 Order Flow & Futures Netflow:
- CoinGlass Futures Netflow: Recent statistics point to a healthy net inflow for MNT after a period of outflows, reflecting renewed market interest and capital rotation into longs.
- Market Cap: $4.50B, cementing its presence among high-liquidity altcoins.
🚨 Conclusion:
Breaking the current consolidation box, backed by a huge volume spike and overbought weekly RSI, signals powerful momentum. The $1.57 level offers a low-risk entry, and clearing short liquidation pockets between $1.40-$1.60 could send MNT to $2.90 and $4.25 in quick succession. Order book dynamics favor further upside, especially as resistance thins above $1.57.
Stay sharp, watch volume and RSI, and monitor liquidations for confirmation of the bullish continuation.
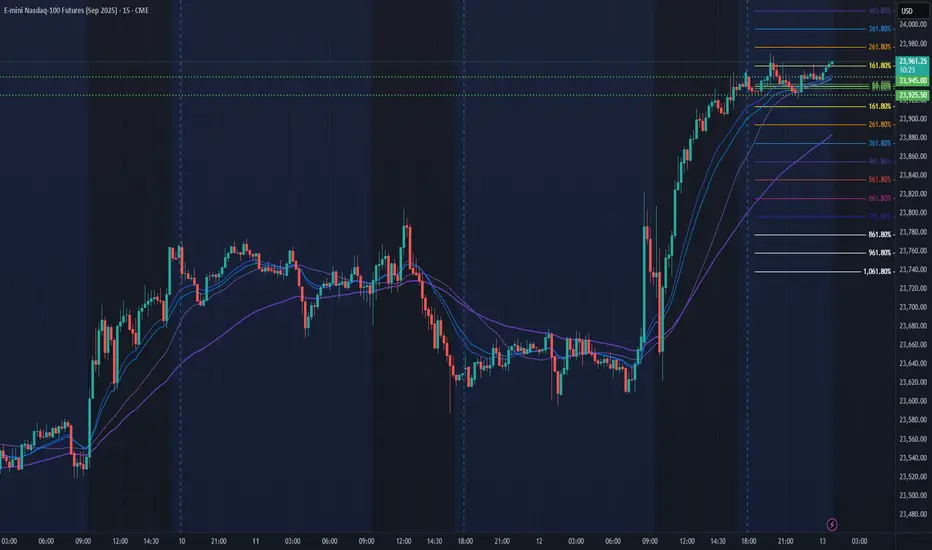
NQ Power Range Report with FIB Ext - 8/13/2025 SessionCME_MINI:NQU2025
- PR High: 23945.00
- PR Low: 23925.50
- NZ Spread: 43.5
Key scheduled economic events:
10:30 | Crude Oil Inventories
ATH climb continues
Session Open Stats (As of 12:25 AM 8/13)
- Session Open ATR: 294.04
- Volume: 21K
- Open Int: 302K
- Trend Grade: Long
- From BA ATH: -0.0% (Rounded)
Key Levels (Rounded - Think of these as ranges)
- Long: 23811
- Mid: 22096
- Short: 20383
Keep in mind this is not speculation or a prediction. Only a report of the Power Range with Fib extensions for target hunting. Do your DD! You determine your risk tolerance. You are fully capable of making your own decisions.
BA: Back Adjusted
BuZ/BeZ: Bull Zone / Bear Zone
NZ: Neutral Zone
Energy printing fresh highs within weeksHere's a better chart than the one shared in October, showing that energy has been consolidating above an upward sloping triangle formation, over 900 days in the making .
With just under 4% remaining to reach prior highs set in April, fresh highs could be just weeks away. Looking at the height of the triangle to project potential gains, there could be a whopping 30% upside ahead.
Lately I've stepped back to ponder the fundamental underpinnings of this move. During the same period, the price of oil has cratered by 40%.
Charting XLE/BRENT shows an astonishing double during the bullish XLE triangle formation
Could it be something to do with the hot war in Ukraine? Anecdotally we know OPEC+ (Saudio Aramco et al) has continued to hold on output increases, while their western peers (XLE) are pushing more product than ever. One theory is XLE companies have taken market share to account for the decline in prices.
Two questions remain:
would oil prices in the $40's be enough to tank XLE shares?
if XLE can hold historic value during a deeper oil price decline, where could its valuation be headed during the next bull cycle in oil?

New targets for Reddit RDDT In this video I recap the previous reddit analysis where we looked for the long which is playing out really well .
I also look at the current price action and simulate what I think could be a target for the stock moving forward using Fib expansion tools as well as levels below for price to draw back too.
Welcome any questions below the chart . Thanks for viewing

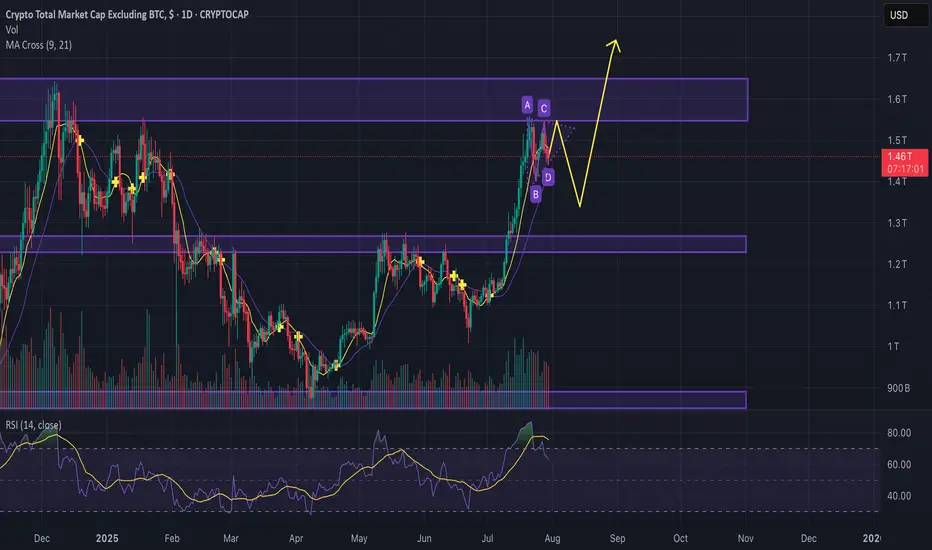
Is altcoin season over before it even started?Guys,
Gonna break down the situation on the chart to see where we can go next with the altcoins.
We see the key resistance levels and now we moving in kinda bullish pennant, but considering descending volumes we can easily test the support line and go back to the 1.25T. (maybe even lower)
After that, seems like we can try to go back and break the 1.64T resistance zone and previous ATH.
Anyway current market is going to be way more different from previous cycles, because huge institutions can feel nice only in hyper volatile, so divide your strategy between short, mid and long term investments to take profits.
Good trades and share your thoughts down to see what others think.
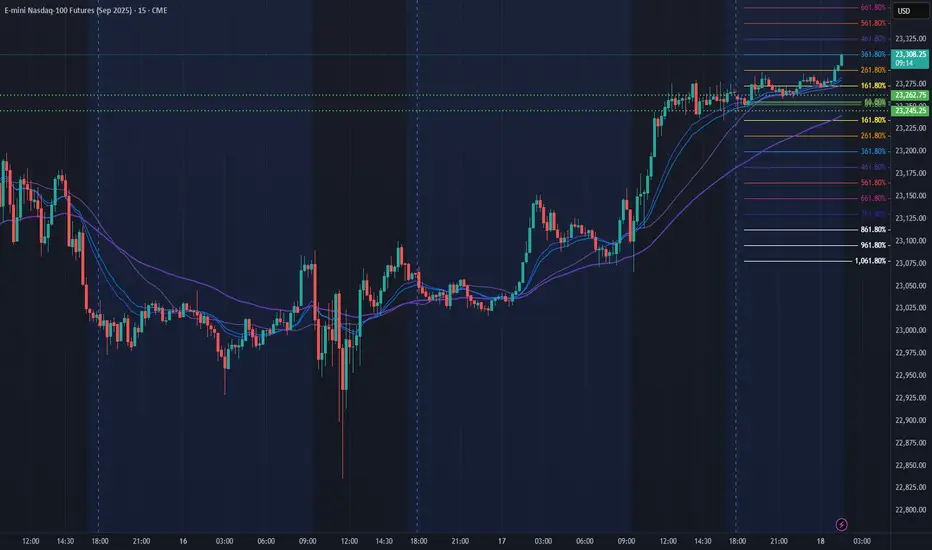
NQ Power Range Report with FIB Ext - 7/18/2025 SessionCME_MINI:NQU2025
- PR High: 23262.75
- PR Low: 23245.25
- NZ Spread: 39.0
No key scheduled economic events
Pushing ATH through overnight hours
Session Open Stats (As of 1:15 AM 7/18)
- Session Open ATR: 272.56
- Volume: 18K
- Open Int: 286K
- Trend Grade: Neutral
- From BA ATH: -0.0% (Rounded)
Key Levels (Rounded - Think of these as ranges)
- Long: 23811
- Mid: 22096
- Short: 20383
Keep in mind this is not speculation or a prediction. Only a report of the Power Range with Fib extensions for target hunting. Do your DD! You determine your risk tolerance. You are fully capable of making your own decisions.
BA: Back Adjusted
BuZ/BeZ: Bull Zone / Bear Zone
NZ: Neutral Zone
Bitcoin in New Ascending channel wait for 160K$As we can see Price broke previous ATH & channel resistance together and is holding strong, if it continue soon new channel is path to claim for Price based on chart and targets like 160K is just easy to hit.
So get Ready for new Highs and ATH here also this breakout to upside was mentioned in previous analysis and now that it is happening don't get surprise if you see notifications like Bitcoin new ATH 150K$.
DISCLAIMER: ((trade based on your own decision))
<<press like👍 if you enjoy💚

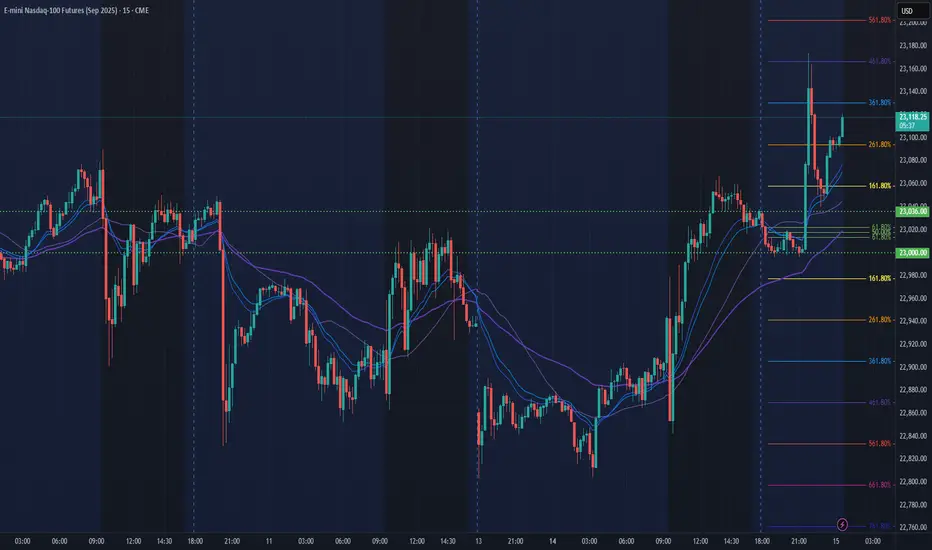
NQ Power Range Report with FIB Ext - 7/15/2025 SessionCME_MINI:NQU2025
- PR High: 23036.00
- PR Low: 23000.00
- NZ Spread: 80.5
Key scheduled economic events:
08:30 | CPI (Core|MoM|YoY)
Asian hours vol spike breakout swing into new ATHs
Session Open Stats (As of 12:15 AM 7/15)
- Session Open ATR: 290.39
- Volume: 42K
- Open Int: 276K
- Trend Grade: Neutral
- From BA ATH: -0.3% (Rounded)
Key Levels (Rounded - Think of these as ranges)
- Long: 23239
- Mid: 21525
- Short: 20383
Keep in mind this is not speculation or a prediction. Only a report of the Power Range with Fib extensions for target hunting. Do your DD! You determine your risk tolerance. You are fully capable of making your own decisions.
BA: Back Adjusted
BuZ/BeZ: Bull Zone / Bear Zone
NZ: Neutral Zone
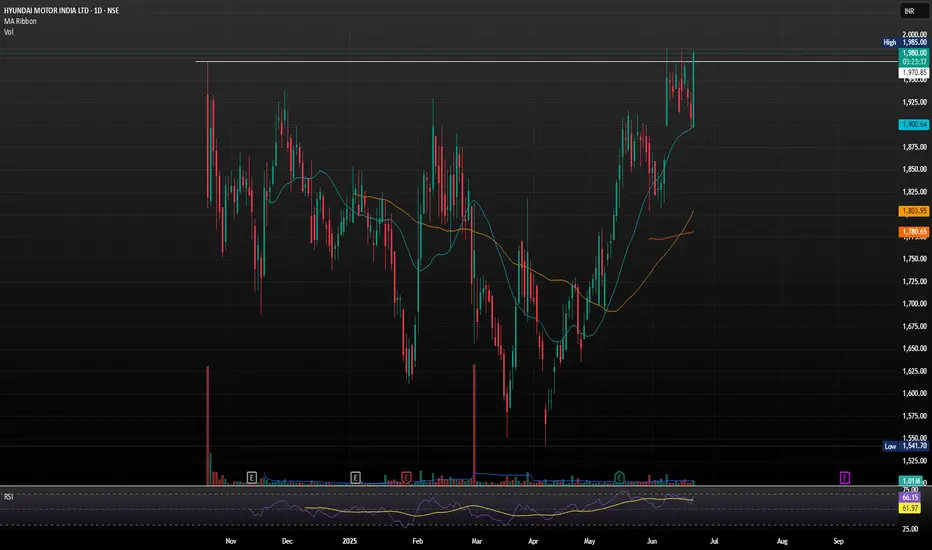
HYUNDAI MOTORS LTD BREACHING ATHHyundai Motor India is one of the leading car manufacturers in the country, known for its wide range of vehicles—from hatchbacks and sedans to SUVs and electric cars. Some of its most popular models include the Creta, Venue, Verna, and the all-electric Ioniq 5.
If Hyundai Motor India has broken past the 2000 mark it may setting their sights even higher. UBS has issued the most bullish call so far, with a target of 2350, citing strong capacity expansion, export momentum, and premium product positioning. Other projections suggest a broader range between 2291 and 2328, depending on market conditions and quarterly performance.
XRP at $7 in 50 days!Like the rest of the market XRP has been stalling a bit for the last few days.
The coming 50 days will give us several new ATHs, though.
For this scenario to play out, we need a strong break out from $2.57 and a strong support from $2.60.
Look at the chart and find the minor pullbacks going up to around $7 !
God speed to all of you !

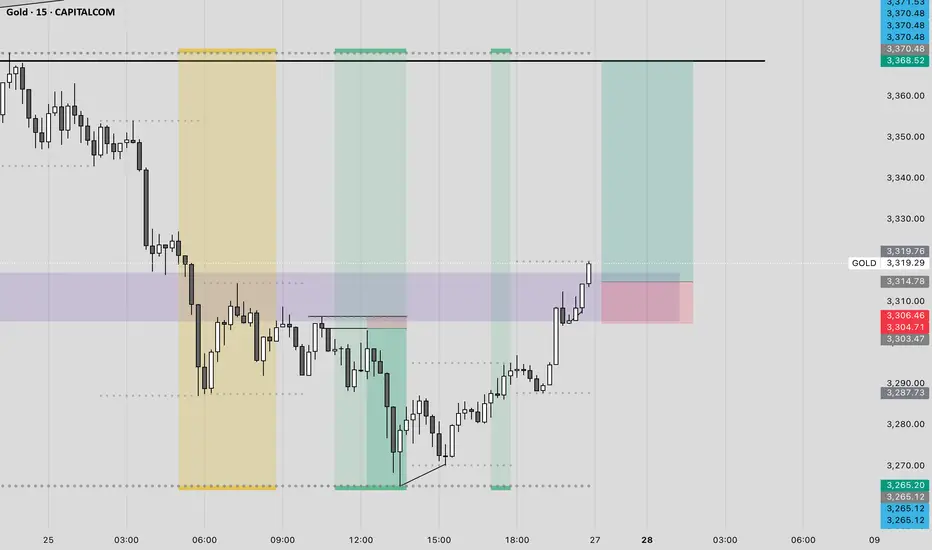
premium priceI’m initiating a long position on XAU/USD based on recent bullish momentum and technical indicators signaling a potential upward move.
Technical Analysis:
• Trend: The price has been trading within an ascending channel on the 4-hour timeframe, indicating a strong uptrend. 
• Breakout: A recent breakout above the upper boundary of the channel with strong momentum suggests a continuation of the bullish trend. 
• Support Levels: The price has found support around the $3,280 level, where buyers have stepped in previously. 
Trade Setup:
• Entry Point: Around $3,327–$3,331 
• Target Price: $3,350 
• Stop Loss: Below $3,303 to maintain tight risk management. 
XAUUSD Alert: Critical Zones in Play — Trade Smart, Trade Safe!📊 XAUUSD Market Insight 🌍
Gold is heating up once again, currently testing a tight range between 3160 and 3174. A breakout in either direction could set the tone for the next big move.
🔻 If price breaks below, we may see a slide toward 3150 and 3130—potential areas to watch for bearish momentum.
🔺 However, a strong push above 3174 could spark bullish energy, aiming for short-term targets at 3200 and 3227.
💡 Trade Smart
The market is full of opportunity, but don’t forget: risk management is key. Use proper position sizing, set clear stop-losses, and never overexpose your capital. Stay sharp, trade safe, and let the market come to you. 🧠💼

NFP REPORT IMPACT ON XAUUSD ALERT!🚨 XAUUSD Market Alert 🚨
🔥 Current Action: XAUUSD is currently range-bound between 3101 and 3114—will it break out soon? The market’s at a critical point, and a sharp move could be on the horizon!
📉 Bearish Scenario: If price slips below this zone, keep an eye on potential support levels at 3070 and 3054. A downward shift could set up fresh opportunities for sellers.
📈 Bullish Scenario: On the flip side, a solid break above 3114 could trigger buying pressure, with targets at 3140 and 3170. A move like this could spark a new uptrend, especially with NFP data on the way, which could impact the gold market!
💬 Let’s Talk Strategy: What’s your take on the XAUUSD setup? Share your insights, and let’s navigate this golden opportunity together! 💰🚀

XAUUSD UNEMPLOYEMENT CLAIM BREAKOUT ALERT!🚨 XAUUSD Update 🚨
🔥 Price Action: XAUUSD is locked between 3144 and 3151—breakout imminent?
📉 Bearish View: If it drops below this range, watch for targets at 3130 and 3120. Stay sharp!
📈 Bullish View: A break above 3151 could set up buying opportunities. Target 3165 and 3200.
💬 Join the Discussion: Drop your thoughts and strategies below! Let’s ride the golden wave together! 💰🚀
