#ATM/USDT UPDATE#ATM
The price is moving in a descending channel on the 1-hour timeframe. It has reached the lower boundary and is heading towards breaking above it, with a retest of the upper boundary expected.
We have a downtrend on the RSI indicator, which has reached near the lower boundary, and an upward rebound is expected.
There is a key support zone in green at 0.880. The price has bounced from this level multiple times and is expected to bounce again.
We have a trend towards consolidation above the 100-period moving average, as we are moving close to it, which supports the upward movement.
Entry price: 0.888
First target: 0.906
Second target: 0.922
Third target: 0.941
Don't forget a simple principle: money management.
Place your stop-loss below the support zone in green.
For any questions, please leave a comment.
Thank you.
ATMBTC

ATMUSDT Forming Falling WedgeATMUSDT is showing a classic falling wedge pattern, which is widely considered a strong bullish reversal signal in technical analysis. After a sustained downtrend, the price action is narrowing within a wedge, and this often leads to an explosive breakout to the upside. With good trading volume accompanying this formation, the conditions are aligning well for a potential sharp move higher once the breakout is confirmed.
The projection suggests a possible gain of 90% to 100%+, making this setup highly attractive for traders looking for strong risk-to-reward opportunities. Falling wedges often mark the end of bearish pressure and the beginning of a new bullish phase, and the current price structure of ATMUSDT is reflecting this shift.
Investor interest is growing around this project, further strengthening the bullish outlook. If the wedge breakout is sustained with solid momentum, it could open the door to a powerful rally and attract even more market participants. This makes ATMUSDT a pair worth close attention in the coming sessions.
✅ Show your support by hitting the like button and
✅ Leaving a comment below! (What is You opinion about this Coin)
Your feedback and engagement keep me inspired to share more insightful market analysis with you!

ATMUSDT UPDATE#ATM
UPDATE
ATM Technical Setup
Pattern: Bullish Falling Wedge Pattern
Current Price: $1.325
Target Price: $2.04
Target % Gain: 55.66%
LSE:ATM is breaking out of a falling wedge on the 1D timeframe. Current price is $1.325 with a target near $2.04, showing over 55% potential upside. The breakout confirms bullish momentum and continuation is favored if support holds. Always use proper risk management.
Time Frame: 1D
Risk Management Tip: Always use proper risk management.

ATMUSDT Forming Falling WedgeATMUSDT is showing a classic falling wedge pattern, which is widely considered a strong bullish reversal signal in technical analysis. After a sustained downtrend, the price action is narrowing within a wedge, and this often leads to an explosive breakout to the upside. With good trading volume accompanying this formation, the conditions are aligning well for a potential sharp move higher once the breakout is confirmed.
The projection suggests a possible gain of 90% to 100%+, making this setup highly attractive for traders looking for strong risk-to-reward opportunities. Falling wedges often mark the end of bearish pressure and the beginning of a new bullish phase, and the current price structure of ATMUSDT is reflecting this shift.
Investor interest is growing around this project, further strengthening the bullish outlook. If the wedge breakout is sustained with solid momentum, it could open the door to a powerful rally and attract even more market participants. This makes ATMUSDT a pair worth close attention in the coming sessions.
✅ Show your support by hitting the like button and
✅ Leaving a comment below! (What is You opinion about this Coin)
Your feedback and engagement keep me inspired to share more insightful market analysis with you!
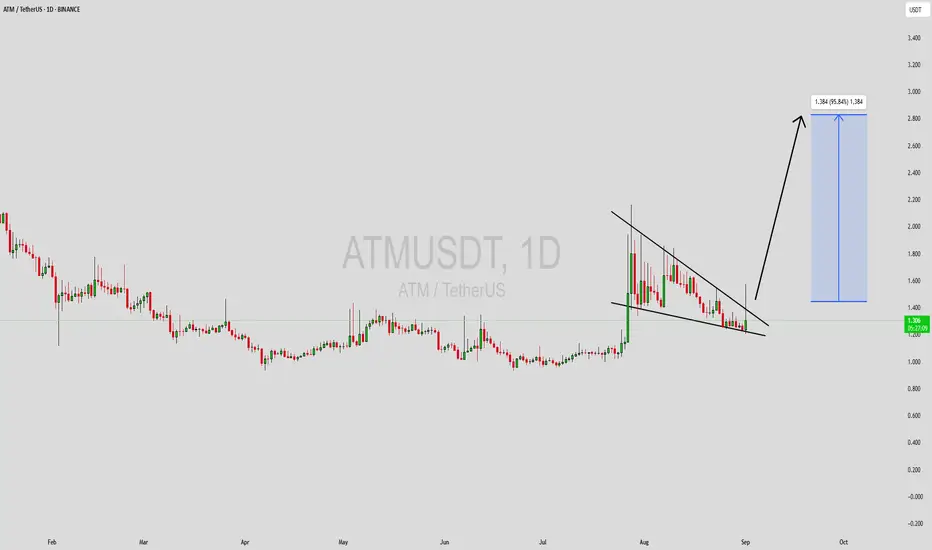
ATMUSDT Forming Falling WedgeATMUSDT is currently forming a classic falling wedge pattern, which is widely recognized as a strong bullish reversal signal in technical analysis. After a prolonged corrective phase, the price has started showing signs of accumulation within this wedge formation, and the breakout potential looks increasingly favorable. With good trading volume supporting the structure, the probability of a powerful upside rally has significantly increased, matching the expected gain range of 80% to 90%+.
The falling wedge setup suggests that selling pressure is weakening while buyers are gradually stepping back into the market. This compression of price action often precedes a breakout rally, where momentum can accelerate quickly once resistance is broken. If confirmed, ATMUSDT could initiate a strong upward surge, attracting both short-term traders and long-term investors who are looking for high-risk, high-reward setups.
Investor sentiment toward this project has been improving as well, with increasing market activity indicating growing confidence in its upside potential. The combination of technical strength, good liquidity, and rising investor interest creates a favorable environment for a strong bullish move. Traders should watch closely for breakout confirmation as it could mark the beginning of a sharp trend reversal.
✅ Show your support by hitting the like button and
✅ Leaving a comment below! (What is You opinion about this Coin)
Your feedback and engagement keep me inspired to share more insightful market analysis with you!
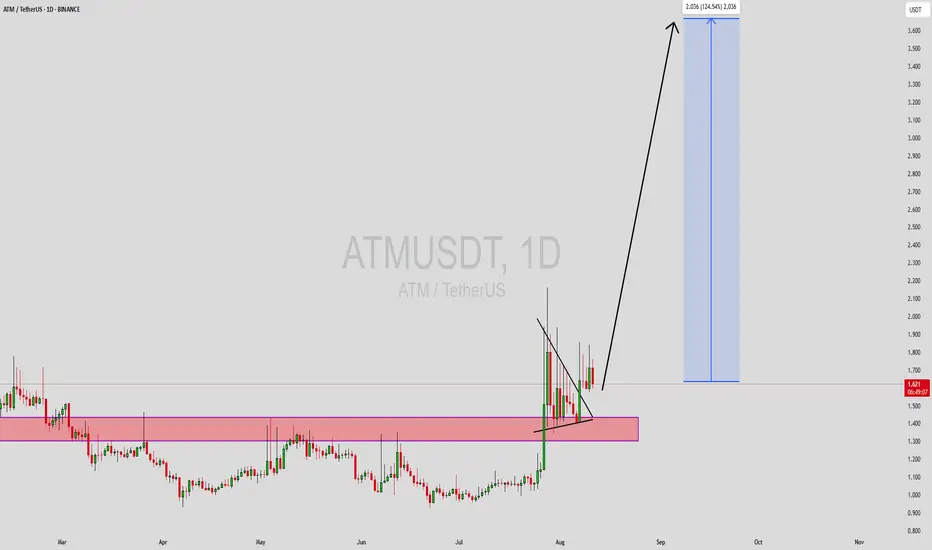
ATMUSDT UPDATE#ATM
UPDATE
ATM Technical Setup
Pattern: Bullish Pennant pattern
Current Price: $1.565
Target Price: $3.00
Target % Gain: 92.33%
Technical Analysis: ATM is forming a bullish pennant on the 1D chart. After a strong impulse move, the price is consolidating within a narrowing range. A breakout from this structure backed by a strong trend continuation is likely, with volume supporting momentum.
Time Frame: 1D
Risk Management Tip: Always use proper risk management.

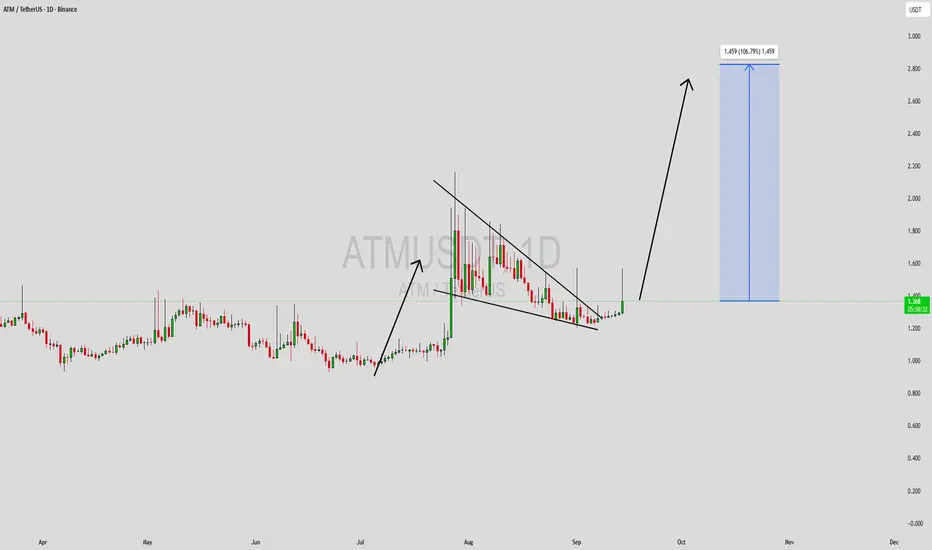
ATMUSDT Forming Descending TriangleATMUSDT is currently tracing a descending triangle pattern, typically viewed as a bearish continuation formation—but it can also flip into a bullish reversal when occurring at market lows or consolidation zones. This chart structure features a series of lower highs pushing into a flat support level, indicating that bullish interest is holding firm despite weakening upside momentum. A breakout above the upper trendline, particularly backed by strong volume, would signal a trend shift.
Volume has stayed solid throughout the pattern's formation, suggesting accumulation near support. If ATM can convincingly break upward through the upper boundary, we could see a robust rally in the range of 90% to 100%+—a substantial opportunity for swing traders.
Investor focus is heating up, with technical setups like symmetrical triangles and ABCD formations hinting at upside potential. Such pattern recognition, combined with rising volume and sentiment, makes this a high-probability trade setup.
Watch for a breakout above resistance with confirming volume and consider it a possible entry zone. Proper risk control around the support area will be key in capitalizing on this potential rally.
✅ Show your support by hitting the like button and
✅ Leaving a comment below! (What is your opinion about this Coin)
Your feedback and engagement keep me inspired to share more insightful market analysis with you!
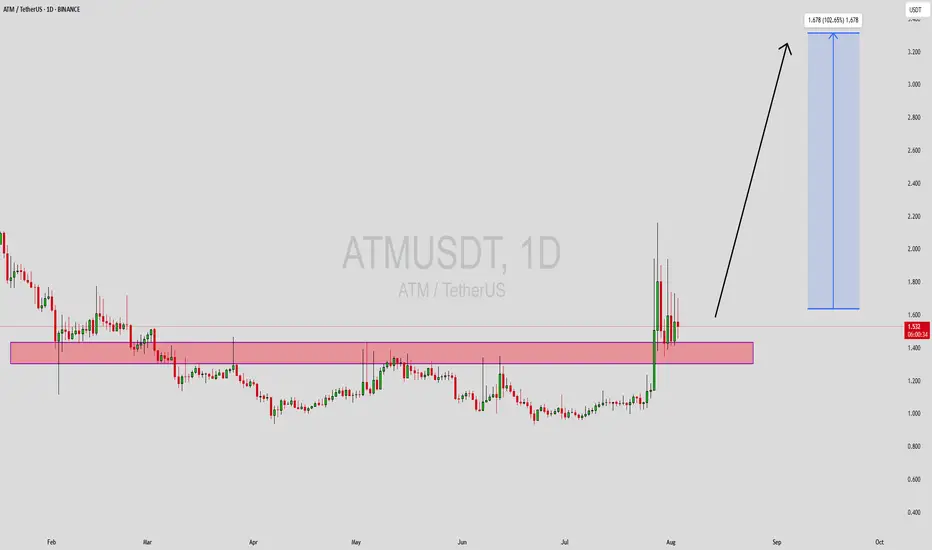
ATMUSDT Forming Bullish ContinuationATMUSDT is displaying a strong bullish continuation signal following its recent breakout from a prolonged consolidation zone. The price has surged above a critical resistance range, now turned into a support zone (highlighted in pink), which held the price down for months. This shift in structure signals renewed bullish sentiment, with price action stabilizing just above the breakout area — a textbook sign of accumulation before the next leg upward.
The trading volume accompanying this breakout is notably strong, reinforcing the legitimacy of the move. With an expected gain of 90% to 100%+, the current market structure suggests there's still substantial upside potential. The projection points to a move towards the $3.20 area, aligning with previous high-volume sell zones. If bulls maintain control and the price remains above the new support zone, this target becomes increasingly realistic in the short-to-mid term.
Investors are beginning to show strong interest in ATM, which is likely due to both technical and fundamental reasons. As the crypto market regains momentum, low-cap or mid-tier altcoins with solid breakout structures tend to outperform. The chart setup on ATMUSDT is appealing to both swing traders and breakout traders who are targeting high-reward scenarios with proper risk control.
ATMUSDT is a coin to watch closely. Any retest of the support zone could be a solid entry opportunity for those who missed the initial breakout. As long as the structure holds, this setup remains bullish and could offer one of the most rewarding trades on Binance’s spot market in the coming weeks.
✅ Show your support by hitting the like button and
✅ Leaving a comment below! (What is You opinion about this Coin)
Your feedback and engagement keep me inspired to share more insightful market analysis with you!
ATMUSDT: Potential for Movement and Key Demand ZoneI believe that Fan tokens could experience some significant movement in the near future. The demand zone I’ve identified looks promising and could act as a strong support area for a potential price reversal.
With growing interest in these tokens and market conditions aligning, this could be a key opportunity to watch. I’m keeping an eye on this demand zone for a potential entry point if the price reacts positively here.
Key Points:
Fan Tokens: Anticipating a possible surge in activity.
Demand Zone: A strong support area where price could reverse.
Watch For Entry: Looking for a reaction at this zone before considering entries.
If you think this analysis helps you, please don't forget to boost and comment on this. These motivate me to share more insights with you!
I keep my charts clean and simple because I believe clarity leads to better decisions.
My approach is built on years of experience and a solid track record. I don’t claim to know it all, but I’m confident in my ability to spot high-probability setups.
If you would like to learn how to use the heatmap, cumulative volume delta and volume footprint techniques that I use below to determine very accurate demand regions, you can send me a private message. I help anyone who wants it completely free of charge.
My Previous Analysis
🐶 DOGEUSDT.P: Next Move
🎨 RENDERUSDT.P: Opportunity of the Month
💎 ETHUSDT.P: Where to Retrace
🟢 BNBUSDT.P: Potential Surge
📊 BTC Dominance: Reaction Zone
🌊 WAVESUSDT.P: Demand Zone Potential
🟣 UNIUSDT.P: Long-Term Trade
🔵 XRPUSDT.P: Entry Zones
🔗 LINKUSDT.P: Follow The River
📈 BTCUSDT.P: Two Key Demand Zones
🟩 POLUSDT: Bullish Momentum
🌟 PENDLEUSDT.P: Where Opportunity Meets Precision
🔥 BTCUSDT.P: Liquidation of Highly Leveraged Longs
🌊 SOLUSDT.P: SOL's Dip - Your Opportunity
🐸 1000PEPEUSDT.P: Prime Bounce Zone Unlocked
🚀 ETHUSDT.P: Set to Explode - Don't Miss This Game Changer
🤖 IQUSDT: Smart Plan
⚡️ PONDUSDT: A Trade Not Taken Is Better Than a Losing One
💼 STMXUSDT: 2 Buying Areas
🐢 TURBOUSDT: Buy Zones and Buyer Presence
🌍 ICPUSDT.P: Massive Upside Potential | Check the Trade Update For Seeing Results
🟠 IDEXUSDT: Spot Buy Area | %26 Profit if You Trade with MSB
📌 USUALUSDT: Buyers Are Active + %70 Profit in Total
🌟 FORTHUSDT: Sniper Entry +%26 Reaction
I stopped adding to the list because it's kinda tiring to add 5-10 charts in every move but you can check my profile and see that it goes on..

ATMUSDT 3D LONG📈Hi all. Timeframe 3D. ATM is at strong support and has formed a triangle. The price is being squeezed. Increased buyer volume. I assume a powerful way out. Enter spot now and/or enter long on a breakout/retest of the trend. Marked goals and levels.

ATMUSDT potential bullish momentumThe recent price movement of ATMUSDT suggests potential bullish momentum. At the current price of $2.480, several indicators indicate an upward trend for this cryptocurrency:
1. Moving Averages: One commonly used indicator in technical analysis is the moving average. If the short-term moving average (e.g., 50-day) crosses above the long-term moving average (e.g., 200-day), it can be considered a bullish signal. This crossover may indicate that the trend is shifting upward.
2.Relative Strength Index (RSI): RSI is a momentum oscillator that measures the speed and change of price movements. An RSI above 70 suggests that an asset may be overbought, while an RSI below 30 suggests it may be oversold. If the RSI for ATMUSDT is trending upwards and approaching the overbought threshold, it can be seen as a bullish sign.
3.Volume Increasing trading volume can be an indication of growing interest and participation in the market. A surge in trading volume alongside a rising price often confirms a bullish trend.
4.Fundamental Developments:** It's crucial to consider any recent news or fundamental developments related to ATMUSDT. Positive news such as partnerships, adoption, or technological advancements can be strong drivers of price appreciation.
5.Support and Resistance Levels:** Analyzing key support and resistance levels on the price chart can provide insights into potential price movements. If ATMUSDT has broken through significant resistance levels and is holding above them, it may indicate a bullish breakout.

Atletico De Madrid Fan Token (ATM) formed Gartley upto 21% moveHi dear members , hope you are well and welcome to the new trade setup of Atletico De Madrid Fan Token (ATM) with US Dollar pair.
Our last successful trade of ATM was as below:
Now on a 4-hr time frame, ATM has formed a bullish Gartley move for another price reversal.
Note: Above idea is for educational purpose only. It is advised to diversify and strictly follow the stop loss, and don't get stuck with trade

$ATM 2,7 m supply? very good priceBear markets sometimes make people rich.
because it causes assets with low supply to be free.
Come to the ATM door before the big hit.

Atletico De Madrid Fan Token (ATM) formed Gartley for upto 11%Hi dear friends, hope you are well and welcome to the new trade setup of Atletico De Madrid Fan Token (ATM) with US Dollar pair.
Previously we caught a nice pump of ATM
Now on a 4-hour time frame, ATM has formed a bullish Gartley pattern.
Note: do you own research, the content is for educational purposes only.

Atletico De Madrid Fan Token (ATM) formed Gartley for upto 70%Hi dear patrons, hope you are well and welcome to the new trade setup of Atletico De Madrid Fan Token (ATM).
On a 4-hr time frame, ATM has formed a bullish Gartley pattern:
Note: Above idea is for educational purpose only. It is advised to diversify and strictly follow the stop loss, and don't get stuck with trade

ATM - Atletico De Madrid Fan Token ATMUSDT ATMBTCATM - Atletico De Madrid Fan Token knocked out Manchester United , Bullish on longer time frame..
Next Support - 5.6/5.5
ATL - 4.1

ATM to the moon 2022Gem coin 2022
ATM analysis
ATM showing some pattern as shown before .
and i am holding this till 2.5X to 7.23X
GEM GEM GEM
2X can be happen anytime
just hold it tightly
thanks me later

$ATM/BTC 4h (Binance Spot) Falling wedge breakoutAtlético de Madrid Fan Token broke out bullish and confirmed the end of the local downtrend, up we go!
Current Price= 0.0003569
Buy Entry= 0.0003543 - 0.0003393
Take Profit= 0.0003945 | 0.0004485 | 0.0004904
Stop Loss= 0.0003149
Risk/Reward= 1:1.5 | 1:3.19 | 1:4.5
Expected Profit= +13.75% | +29.33% | +41.41%
Possible Loss= -9.20%
Fib. Retracement= 0.382 | 0.618 | 0.786
Margin Leverage= 1x
Estimated Gain-time= 2 weeks

ATMUSDT 4H: Possible LONGATMUSDT 4H: Possible LONG
Bounce from support level 16 and possible rise to level 25

ATMUSDT: HEAD AND SHOULDERS IN THE BUY ZONE!!atmusdt has formed head and shoulders pattern at the key support.
could be a good buy opportunity here!!

ATM
#ATM/USDT
(Binance Spot)
~ Brokeout Strong Resistance
~ Now Should Act as a Support
Buy : 13.5 - 12.18 (place a bid)
Sell Targets : 16 - 18 - 22 - 24.75 - 27.8
StopLoss : 10.05
CALL OF CRYPTO


$ATM/BTC 1h (Binance Spot) Descending wedge breakoutAtlético de Madrid Fan Token is looking bullish again, let's enter on the retest.
Current Price= 0.0004397
Buy Entry= 0.0004356 - 0.0004212
