ATOM is still bullish (8H)ATOM price has recently shown a sharp and powerful impulsive move from the bottom, which clearly indicates the presence of strong institutional and smart money buyers. This aggressive reaction from demand zones suggests that buyers are in control of the market structure at the moment.
The bullish momentum is very strong, and price is respecting higher highs and higher lows. As long as this momentum remains intact, minor pullbacks and shallow corrections can be considered healthy and optimal opportunities to enter Buy/Long positions, rather than signs of weakness.
From a market structure perspective, we can clearly identify a Bullish Change of Character (CHoCH) on the chart. This CH confirms that the previous bearish structure has been broken and the market has officially shifted into a bullish phase. Additionally, price is currently trading around key levels, which further increases the importance of this zone and validates the bullish scenario.
Entry Strategy (DCA Approach)
We have two potential entry zones, marked on the chart. These entries can be executed using a DCA (Dollar Cost Averaging) strategy to reduce risk and improve the average entry price. This approach allows better position management in case of short-term volatility.
Targets & Trade Management
All targets are clearly marked on the chart.
At Target 1, it is recommended to secure partial profits to reduce exposure.
After reaching the first target, move the stop loss to Break Even to protect capital and allow the trade to run risk-free.
Remaining positions can be held towards higher targets as long as bullish structure and momentum remain valid.
Final Thoughts
As long as price holds above key support levels and maintains its bullish structure, the overall bias remains bullish. Always manage risk properly and avoid over-leveraging, especially in volatile market conditions.
⚠️ This analysis is not financial advice. Always do your own research and manage risk accordingly.
If you would like us to analyze a coin or altcoin for you, first like this post, then comment the name of your altcoin below.
ATOM

BRIEFING Week #2 / Happy New Year !Here's your weekly update ! Brought to you each weekend with years of track-record history..
Don't forget to hit the like/follow button if you feel like this post deserves it ;)
That's the best way to support me and help pushing this content to other users.
Kindly,
Phil

COSMOS ATOM; Nice bounce possible short consolidationA few days ago, I mentioned that ATOM had likely bottomed and that we could see a strong move in January. As expected, price has already climbed about 46%.
At this point, ATOM may need a short consolidation as some investors take profits. There’s a possibility we see a retrace toward the 0.5 Fibonacci level around $2.23, which could act as a healthy reset and provide the momentum needed for the next leg up.
From there, a bounce could set us up to challenge the EMA 100 near $2.71. Once we reach that area, market sentiment will be key. If bullish momentum continues, that should give ATOM enough strength to push toward — and potentially break — the EMA 200.
What are your thoughts? Don’t forget to follow and share. 🚀

ATOM - +21% Weekly Rally at $1.16B | Tokenomics Redesign
Executive Summary
Cosmos (ATOM) market cap trading at $1.16B after a massive +21.17% weekly rally on the 4H timeframe. Price surged from $880M support to test $1.18B resistance. Major catalysts ahead: tokenomics redesign (Q1 2026), Solana/Ethereum L2 IBC integrations, and THORChain cross-chain swaps live. Strong momentum but approaching resistance.
BIAS: BULLISH - Strong Momentum, Watch Resistance
Current Market Data
Current: $1.16B (+0.33%)
Day's Range: $1.14B - $1.16B
52-Week: $803.29M - $2.8B
Volume: 63.52M (above 30D avg of 53.47M)
Performance:
1W: +21.17% | 1M: +7.14% | 3M: -39.69%
6M: -31.52% | YTD: +23.37% | 1Y: -59.76%
Key Catalysts
Tokenomics Redesign (Q1 2026) - Lower inflation, fee capture from appchains
IBC Integrations - Solana and Ethereum L2s connectivity coming
THORChain Cross-Chain Swaps - Native ATOM swaps live (no bridges)
CometBFT Upgrades - Targeting 10k+ TPS for enterprise
Enterprise Blockchain Fleet Manager - SWIFT, SMBC adoption potential
Stablecoin Surge - Cosmos Labs predicts new issuers in 2026
Technical Structure - 4H
Strong Uptrend:
Clean rally from $880M to $1.16B
Higher highs and higher lows
Now testing upper resistance at $1.18B
Volume above average - confirms momentum
Key Levels (Market Cap):
Resistance:
$1.16B - $1.18B - Current resistance zone
$1.20B - Psychological resistance
$1.40B+ - Extended bullish target
Support:
$1.10B - Immediate support
$1.00B - Psychological support
$880M - Major support (red line at bottom)
SCENARIO ANALYSIS
BULLISH: Breakout Above $1.18B
Trigger: Close above $1.18B with volume
Targets: $1.20B → $1.40B → $1.60B
Catalyst: Tokenomics redesign approval, IBC integrations
BEARISH: Rejection at Resistance
Rejection at $1.18B resistance
Pullback to $1.00B-$1.10B support
Healthy consolidation before next leg
My Assessment
Strong +21% weekly rally with volume confirmation. Approaching resistance at $1.18B. Major catalysts ahead: tokenomics redesign to lower inflation and capture fees, IBC integrations with Solana/ETH L2s, and enterprise adoption push. Bullish structure intact - watch for breakout or pullback to support.
Strategy:
Long on breakout above $1.18B → Target $1.20B, $1.40B
Or buy pullback to $1.00B-$1.10B support
Stop below $880M major support
Tell me your thoughts below!

ATOM / USDT – Weekly OutlookATOM is still trading in a long-term downtrend, but price is currently resting on a major historical support zone.
Market Structure
Clear sequence of lower highs, confirming bearish structure
Strong support zone that has been defended multiple times in the past
No confirmed trend shift yet
Key Zones
Support: current range where price is consolidating
Resistance: previous support that must be reclaimed and held
Above resistance, upside momentum can accelerate
Scenario
As long as support holds, a relief bounce is possible
Rejection at resistance would confirm trend continuation
Only a clean reclaim and hold above resistance would signal trend reversal
Do you expect ATOM to bounce from support or continue lower?
MrC

TradeCityPro | ATOM Testing Support as Bears Dominate👋 Welcome to TradeCityPro’s first analysis of 2026!
In this analysis, I want to review the ATOM coin for you. One of the DeFi projects in the Osmosis ecosystem, which with a market cap of $937 million is ranked 63rd on CoinMarketCap.
⏳ 4-hour timeframe
On the 4-hour timeframe, this coin has a bearish trend and has now entered a correction and ranging phase, preparing to start its next move.
✨ The main support level we have on ATOM is 1.834. However, the price has also formed another support at 1.916, which it has previously touched several times and has now reached again.
✔️ After the previous bearish wave ended, the price corrected upward, and after reaching 2.103, bearish momentum entered the market again.
🧮 Currently, the price is sitting on the 1.916 support. Given the bearish momentum and the increasing selling volume, the probability of breaking 1.916 has increased.
⚡️ With the break of 1.916, we can open a short position.The main trigger for confirming ATOM turning bearish is the break of the 1.834 level.
⛏ However, if the price gets supported from this area and moves upward, breaking 2.103 will give us the first confirmation of ATOM turning bullish.
📈 Personally, I prefer to only open short positions on ATOM for now, since it has a strong bearish trend, and for long positions, we can use other coins that have bullish structures.
📝 Final Thoughts
Stay calm, trade wisely, and let's capture the market's best opportunities!
This analysis reflects our opinions and is not financial advice.
Share your thoughts in the comments, and don’t forget to share this analysis with your friends! ❤️

ATOM/USDT short-term🔍 Market Structure
Clear downtrend – price is moving within a descending channel (lower highs and lows).
Each bounce is sold at the upper band of the channel.
No signal of a change in structure yet (no HH + HL).
📉 Current Price Status
Price is at the lower end of the channel.
Consolidation after a downward impulse → typical bearish continuation or short technical rebound.
Current Zone:
~2.02–2.05 USDT – local support + demand reactions.
🟢 Key Levels
Support
2.049 – local support (current reaction)
1.999 – strong psychological support
1.951
1.878 – lower demand zone (important!)
Resistance
2.099
2.125
2.201 – key resistance / S→R flip.
Upper channel line (~2.20–2.23)
📊 Stochastic RSI
Oscillator often in oversold territory.
Currently recovering from the low → possible short rebound.
BUT: in a downtrend. The Stoch RSI is not a long-term signal.
➡️ More likely a pullback, not a trend change.
🧠 Scenarios
🔴 Baseline scenario (most likely)
Bounce to:
2.09 → 2.12
Rejection + further decline:
1.99
then 1.95 / 1.88
➡️ Short at resistance levels in line with the trend.
🟢 Alternative scenario (less likely)
Breakout of 2.20 + close of the 1H candle above the channel
Retest from above
Then targets:
2.28
2.35–2.40
➡️ Only then can we talk about a change in structure.

BRIEFING Week #50 : Post FOMC updateHere's your weekly update ! Brought to you each weekend with years of track-record history..
Don't forget to hit the like/follow button if you feel like this post deserves it ;)
That's the best way to support me and help pushing this content to other users.
Kindly,
Phil

BRIEFING Week #49 : Watch Oil & USDJPYHere's your weekly update ! Brought to you each weekend with years of track-record history..
Don't forget to hit the like/follow button if you feel like this post deserves it ;)
That's the best way to support me and help pushing this content to other users.
Kindly,
Phil

BRIEFING Week #48 : Monthly Hanging ManHere's your weekly update ! Brought to you each weekend with years of track-record history..
Don't forget to hit the like/follow button if you feel like this post deserves it ;)
That's the best way to support me and help pushing this content to other users.
Kindly,
Phil

ATOM Update🚨📊 ATOM Update
ATOM has also formed a new resistance zone in red 🔴.
This level is now acting as a strong ceiling,
and price must break out above this red resistance
to show any real bullish momentum again.
Until that breakout happens,
sellers remain in control and upside stays limited.
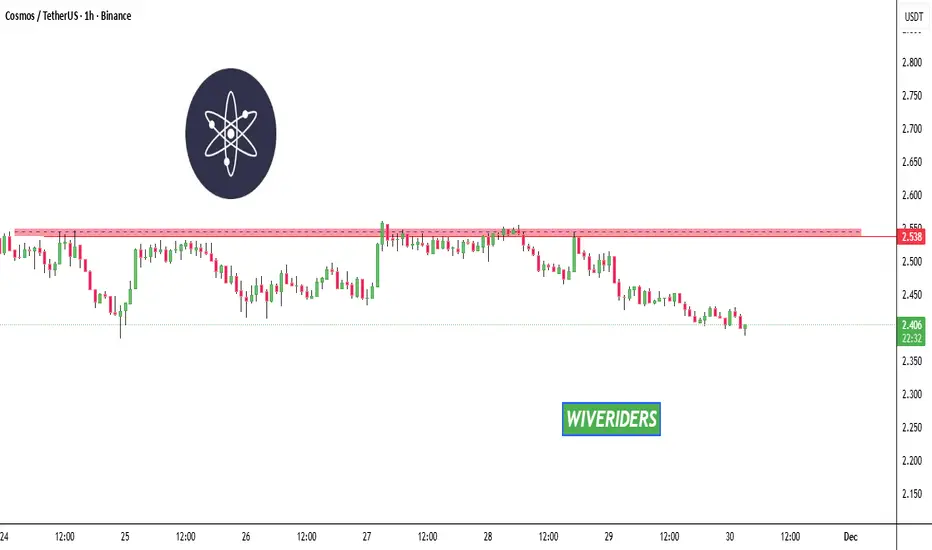
#ATOM/USDT | ATOMUSDT Preparing for a Potential Drop#ATOM
The price is moving in a descending channel on the 1-hour timeframe. It has reached the lower boundary and is heading towards breaking above it, with a retest of the upper boundary expected.
We have a downtrend on the RSI indicator, which has reached near the lower boundary, and an upward rebound is expected.
There is a key support zone in green at 2.40. The price has bounced from this zone multiple times and is expected to bounce again.
We have a trend towards stability above the 100-period moving average, as we are moving close to it, which supports the upward movement.
Entry price: 2.51
First target: 2.58
Second target: 2.66
Third target: 2.75
Don't forget a simple principle: money management.
Place your stop-loss below the support zone in green.
For any questions, please leave a comment.
Thank you.

BRIEFING Week #47 : Monthly Reversal in ?Here's your weekly update ! Brought to you each weekend with years of track-record history..
Don't forget to hit the like/follow button if you feel like this post deserves it ;)
That's the best way to support me and help pushing this content to other users.
Kindly,
Phil

Breaking: Cosmos ($ATOM) Spike 11% Today Albeit Market Dip The price of ( NASDAQ:ATOM ) soared 11% today despite the market bloodbirth that saw Ethereum tanked to $2900 zone and CRYPTOCAP:BTC to the $80k zone.
NASDAQ:ATOM is constricted in a tight symmetrical triangle pattern with the RSI at 53. Should the altcoin break the ceiling of the triangle to the $5 resistance, the asset will be eyeing the $40 resistant.
In another news, South Korea’s leading exchange Bithumb has announced a crucial temporary suspension affecting ATOM transactions. Starting November 10 at 9:00 AM UTC, the platform will temporarily halt all ATOM deposits and withdrawals to facilitate an essential network upgrade. This proactive measure ensures the Cosmos ecosystem continues to evolve securely and efficiently.
What Is Cosmos (ATOM)?
In a nutshell, Cosmos bills itself as a project that solves some of the “hardest problems” facing the blockchain industry. It aims to offer an antidote to “slow, expensive, unscalable and environmentally harmful” proof-of-work protocols, like those used by Bitcoin, by offering an ecosystem of connected blockchains.
Cosmos Price Data
Cosmos price today is $3.04 USD with a 24-hour trading volume of $189,904,725 USD. Cosmos is up 10.03% in the last 24 hours. The current CoinMarketCap ranking is #52, with a market cap of $1,457,333,330 USD. It has a circulating supply of 478,764,540 ATOM coins.

BRIEFING Week #46 : Make or BreakHere's your weekly update ! Brought to you each weekend with years of track-record history..
Don't forget to hit the like/follow button if you feel like this post deserves it ;)
That's the best way to support me and help pushing this content to other users.
Kindly,
Phil

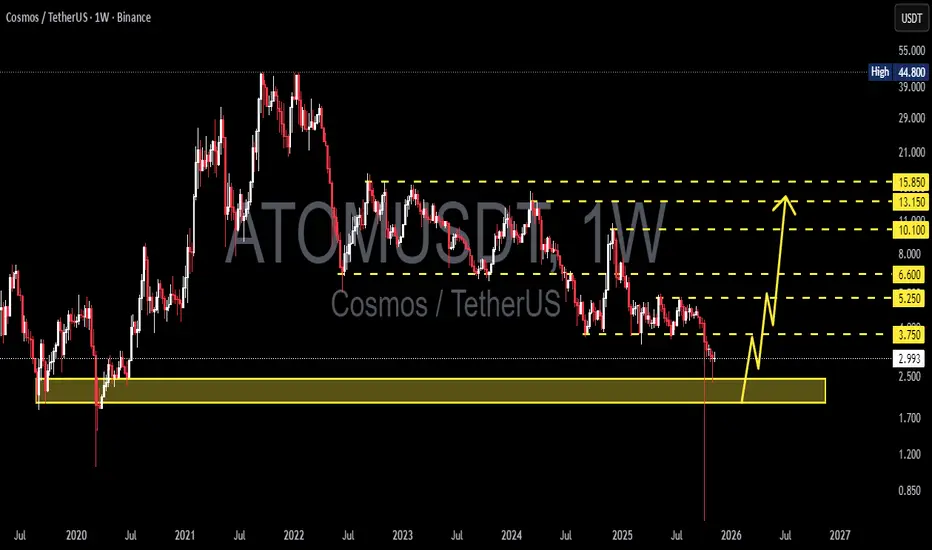
ATOM/USDT — Diving into the Zone 2.4–1.9: Breakout or breakdown?Cosmos (ATOM) is now standing at its most critical point in recent years, precisely within the historical support zone of 2.45–1.95, which has served as a major accumulation area since the early phase of the 2020 bull run. This zone isn’t just a number—it represents the psychological foundation of ATOM’s market.
In recent weeks, the weekly chart has shown a sharp decline followed by a long lower wick, signaling a massive liquidity sweep. In other words, many long positions were flushed out before price was pulled back up — an indication that smart money might be accumulating here, though no confirmed reversal has occurred yet.
Technically, ATOM remains in a medium- to long-term downtrend, forming a series of lower highs and lower lows since 2022. However, the current level opens two major possibilities — the beginning of a new accumulation phase, or the continuation of the final capitulation wave.
---
Pattern Structure & Technical Context
1. Main Trend: The multi-year downtrend remains intact.
2. Golden Zone (Historical Support): 2.45–1.95 — the same accumulation area that fueled the 2021 bull run.
3. Fakeout & Liquidity Sweep: The long wick below the zone shows liquidity collection, a potential reversal signal if confirmed by a bullish weekly candle.
4. Reversal Confirmation: Requires a weekly close above 3.75, followed by a successful retest.
5. Volume & Divergence: Watch for bullish divergence on RSI or MACD to reinforce reversal strength.
---
BULLISH SCENARIO – “The Rebirth Zone”
If price holds and rebounds strongly from the 2.45–1.95 zone, this could mark the beginning of a major re-accumulation phase. The bullish case strengthens if:
A weekly close above 3.75 occurs (reclaiming old structural support).
The move is supported by strong volume and a solid bullish candle.
A higher low forms above 2.45.
Step-by-step target levels:
➡️ 3.75 → 5.25 → 6.60 → 10.10 → 13.15 → 15.85
If momentum continues, a potential Adam & Eve Reversal or Inverse Head & Shoulders could form in this zone, signaling the transition from bear market to a new bull trend.
Core Bullish Idea: The 2.45–1.95 zone is a “life-or-death point” — holding above it offers a high-reward setup compared to the downside risk.
---
BEARISH SCENARIO – “Break the Floor”
However, if a weekly close occurs below 1.95, this historical support would be officially invalidated.
This could trigger:
A final capitulation wave toward 1.20 or even 0.85, levels that previously acted as a base before the 2020 rally.
A failed retest of the 2.45–1.95 zone (flipping it into resistance).
Weakening market sentiment, pushing ATOM into a prolonged bearish continuation phase.
In this case, traders should wait for a confirmed bottom before accumulating, as further downside risk remains open.
---
CONCLUSION
ATOM is now at the ultimate battlefield between buyers and sellers.
If the 2.45–1.95 zone holds, we could witness the early stages of ATOM’s major recovery, potentially heading back toward the 5–10 USD range. But if it breaks down, the long-term bull structure officially collapses, and the market may seek equilibrium much lower.
The coming weeks will determine whether this zone becomes the foundation of a rebirth, or the gateway to deeper decline.
---
#ATOMUSDT #Cosmos #CryptoAnalysis #WeeklyChart #SupportZone #MarketStructure #SwingTrade #BullishReversal #BearishBreakdown #TradingViewAnalysis #TechnicalAnalysis
$ATOM / USDT Cosmos has finally reached its long-term NASDAQ:ATOM / USDT
Cosmos has finally reached its long-term accumulation zone the same area that triggered explosive rallies in the past. As long as the price holds above the $2.5–$3.0 support region, this zone represents a major bottom formation.
The next macro phase could lead to a powerful multi-year breakout, with potential targets between $10 – $20, and eventually $30+ as momentum builds into 2027–2028.
SHORT TERM TARGET: $4 - $8
This is where patience pays off accumulation here could turn into one of the biggest comeback stories of the next cycle. 🚀
NYSE:PUMP CRYPTOCAP:ZEC $WLFI SEED_WANDERIN_JIMZIP900:ASTER GETTEX:HYPE LSE:FIL CRYPTOCAP:ICP NASDAQ:DASH CRYPTOCAP:NEAR

BRIEFING Week #45 : Growth made the TopHere's your weekly update ! Brought to you each weekend with years of track-record history..
Don't forget to hit the like/follow button if you feel like this post deserves it ;)
That's the best way to support me and help pushing this content to other users.
Kindly,
Phil

BRIEFING Week #43 : The Value Trade
Here's your weekly update ! Brought to you each weekend with years of track-record history..
Don't forget to hit the like/follow button if you feel like this post deserves it ;)
That's the best way to support me and help pushing this content to other users.
Kindly,
Phil

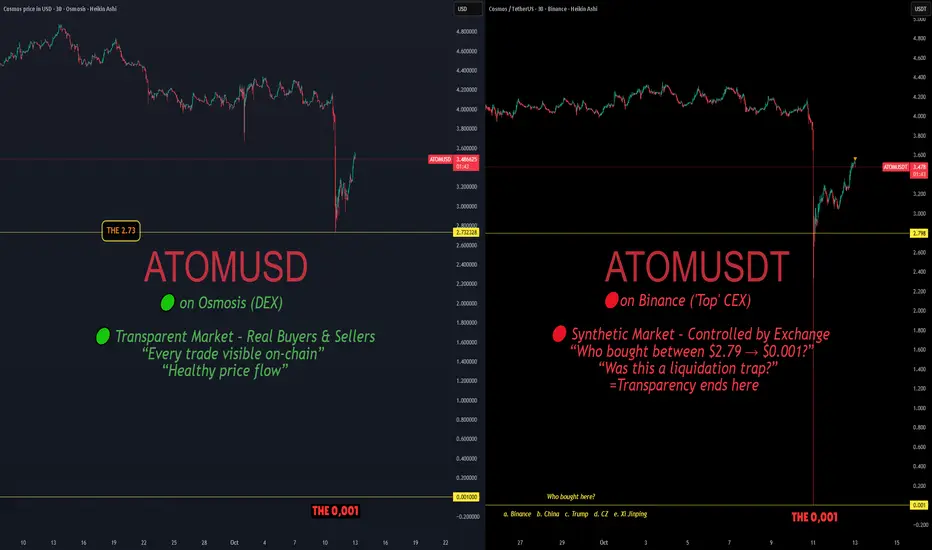
The Problem With Crypto –Part2: The Illusion of Decentralization🧠 The Problem With Crypto – Part 2: The Illusion of Decentralization
Same token.
Same moment.
Two realities.
🟢 ATOM/USD on Osmosis (DEX)
Transparent market — every trade visible on-chain.
Real buyers. Real sellers. Healthy price flow.
🔴 ATOM/USDT on Binance (CEX)
Synthetic market — controlled by the exchange.
Price collapsed to 0.001 USDT.
Who bought there?
Was it a trader, a market maker… or the house itself?
If it was the exchange — we deserve answers.
If it was a “partner” — expose it.
If it was “normal system behavior,” then the system is built to harvest.
On-chain markets move by human action.
Off-chain markets move by design.
And behind that design… there’s the Dragon behind the curtain. 🐉
We’ll dive deeper into that in a next episode.
One Love,
The FXPROFESSOR💙
BRIEFING Week #41 : Havoc on CryptosHere's your weekly update ! Brought to you each weekend with years of track-record history..
Don't forget to hit the like/follow button if you feel like this post deserves it ;)
That's the best way to support me and help pushing this content to other users.
Kindly,
Phil

BRIEFING Week #40 : What could cause VIX>100Here's your weekly update ! Brought to you each weekend with years of track-record history..
Don't forget to hit the like/follow button if you feel like this post deserves it ;)
That's the best way to support me and help pushing this content to other users.
Kindly,
Phil

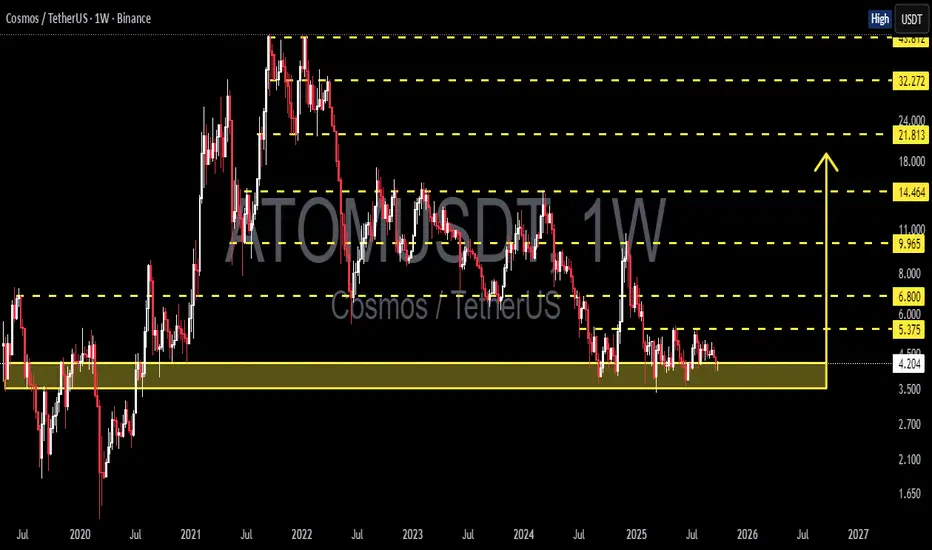
ATOMUSDT — Holding at Historical Support, Rebound or Break Down?📊 Overview
The Cosmos (ATOM/USDT) Weekly chart is at a decisive point. Price is currently sitting inside the historical support zone around 3.5 – 4.5 USDT, which has acted as a strong defense since 2020. Every time ATOM touched this area, a rebound followed — but this time the repeated tests suggest the support is getting weaker.
The macro structure still shows a pattern of lower highs since the 2021 peak, indicating a dominant bearish bias. However, the prolonged pressure has also pushed ATOM into an attractive long-term accumulation zone — if the support holds.
---
🔑 Key Technical Levels
Main Support Zone (Current): 3.5 – 4.5 USDT
Next Support: 2.7 USDT (structural low from 2020)
Resistance 1: 5.375 USDT
Resistance 2: 6.800 USDT
Resistance 3: 9.965 USDT
Major Resistances: 14.464 – 21.813 – 32.272 – 45.612 USDT
These levels provide the roadmap for ATOM’s mid-to-long-term direction.
---
🟢 Bullish Scenario
1. Confirmation: a weekly close above 5.375 – 5.5 USDT with strong volume.
2. Implication: signals that selling pressure is fading and the support zone has held.
3. Targets:
Initial: 6.8 USDT
Mid-term: 9.965 USDT
Extended: 14.4 – 21.8 USDT if market momentum strengthens.
4. Pattern potential: a double bottom or accumulation base may form if the zone continues to hold and buyers step in aggressively.
---
🔴 Bearish Scenario
1. Confirmation: a weekly close below 3.5 USDT.
2. Implication: breakdown of historical support → opens the path for deeper downside.
3. Targets:
First: 2.7 USDT (2020 structural support).
Extended: 2.1 – 1.6 USDT if selling accelerates.
4. Warning: repeated testing of the same support weakens it, making a breakdown scenario highly possible if buyers fail to defend.
---
📌 Structure & Pattern Insights
Horizontal consolidation within support zone, small weekly candles → market indecision.
Lower highs keep pressuring the structure downward.
Potential double bottom if ATOM holds above 3.5 and reverses strongly.
Beware of false breaks — always confirm with volume and retest.
---
🎯 Trader & Investor Takeaways
Short-term traders: watch closely for reaction inside 3.5–4.5. Aggressive entries possible here with tight stops below 3.3. Safer entries only after a weekly close above 5.5.
Long-term investors: this zone is historically a strong accumulation area, but patience and risk management are crucial due to breakdown risks.
Strategy: scale into positions gradually, risk max 1–2% per trade, and rely on weekly confirmation.
---
📝 Conclusion
ATOM is at a crossroads. Holding the 3.5–4.5 support zone could spark a rebound toward 6.8 – 10 USDT, while a confirmed breakdown below 3.5 would expose ATOM to 2.7 or even lower.
The next weekly close will likely decide the medium-term trend. ATOM now stands like a last fortress under siege — either it defends and rallies, or it crumbles into deeper lows.
---
#ATOM #Cosmos #ATOMUSDT #Crypto #TechnicalAnalysis #PriceAction #SupportResistance #CryptoMarket #SwingTrading #InvestInCrypto