ATOM/USDT — Diving into the Zone 2.4–1.9: Breakout or breakdown?Cosmos (ATOM) is now standing at its most critical point in recent years, precisely within the historical support zone of 2.45–1.95, which has served as a major accumulation area since the early phase of the 2020 bull run. This zone isn’t just a number—it represents the psychological foundation of ATOM’s market.
In recent weeks, the weekly chart has shown a sharp decline followed by a long lower wick, signaling a massive liquidity sweep. In other words, many long positions were flushed out before price was pulled back up — an indication that smart money might be accumulating here, though no confirmed reversal has occurred yet.
Technically, ATOM remains in a medium- to long-term downtrend, forming a series of lower highs and lower lows since 2022. However, the current level opens two major possibilities — the beginning of a new accumulation phase, or the continuation of the final capitulation wave.
---
Pattern Structure & Technical Context
1. Main Trend: The multi-year downtrend remains intact.
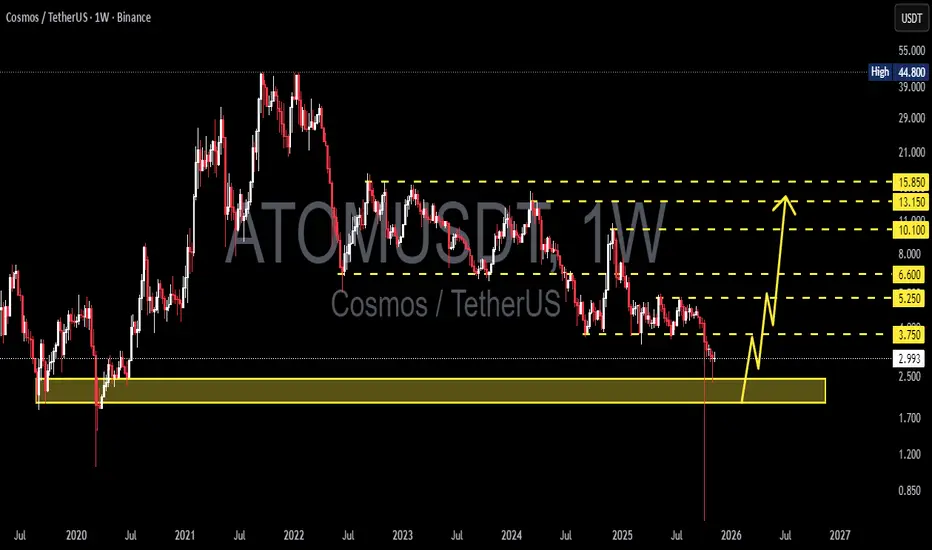
2. Golden Zone (Historical Support): 2.45–1.95 — the same accumulation area that fueled the 2021 bull run.
3. Fakeout & Liquidity Sweep: The long wick below the zone shows liquidity collection, a potential reversal signal if confirmed by a bullish weekly candle.
4. Reversal Confirmation: Requires a weekly close above 3.75, followed by a successful retest.
5. Volume & Divergence: Watch for bullish divergence on RSI or MACD to reinforce reversal strength.
---
BULLISH SCENARIO – “The Rebirth Zone”
If price holds and rebounds strongly from the 2.45–1.95 zone, this could mark the beginning of a major re-accumulation phase. The bullish case strengthens if:
A weekly close above 3.75 occurs (reclaiming old structural support).
The move is supported by strong volume and a solid bullish candle.
A higher low forms above 2.45.
Step-by-step target levels:
➡️ 3.75 → 5.25 → 6.60 → 10.10 → 13.15 → 15.85
If momentum continues, a potential Adam & Eve Reversal or Inverse Head & Shoulders could form in this zone, signaling the transition from bear market to a new bull trend.
Core Bullish Idea: The 2.45–1.95 zone is a “life-or-death point” — holding above it offers a high-reward setup compared to the downside risk.
---
BEARISH SCENARIO – “Break the Floor”
However, if a weekly close occurs below 1.95, this historical support would be officially invalidated.
This could trigger:
A final capitulation wave toward 1.20 or even 0.85, levels that previously acted as a base before the 2020 rally.
A failed retest of the 2.45–1.95 zone (flipping it into resistance).
Weakening market sentiment, pushing ATOM into a prolonged bearish continuation phase.
In this case, traders should wait for a confirmed bottom before accumulating, as further downside risk remains open.
---
CONCLUSION
ATOM is now at the ultimate battlefield between buyers and sellers.
If the 2.45–1.95 zone holds, we could witness the early stages of ATOM’s major recovery, potentially heading back toward the 5–10 USD range. But if it breaks down, the long-term bull structure officially collapses, and the market may seek equilibrium much lower.
The coming weeks will determine whether this zone becomes the foundation of a rebirth, or the gateway to deeper decline.
---
#ATOMUSDT #Cosmos #CryptoAnalysis #WeeklyChart #SupportZone #MarketStructure #SwingTrade #BullishReversal #BearishBreakdown #TradingViewAnalysis #TechnicalAnalysis
ATOMUSDC
ATOMUSDT — Holding at Historical Support, Rebound or Break Down?📊 Overview
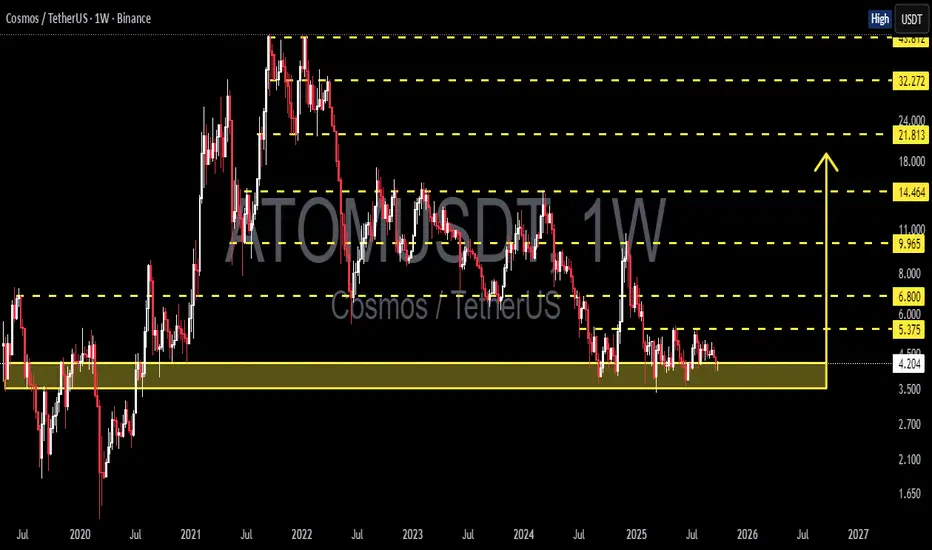
The Cosmos (ATOM/USDT) Weekly chart is at a decisive point. Price is currently sitting inside the historical support zone around 3.5 – 4.5 USDT, which has acted as a strong defense since 2020. Every time ATOM touched this area, a rebound followed — but this time the repeated tests suggest the support is getting weaker.
The macro structure still shows a pattern of lower highs since the 2021 peak, indicating a dominant bearish bias. However, the prolonged pressure has also pushed ATOM into an attractive long-term accumulation zone — if the support holds.
---
🔑 Key Technical Levels
Main Support Zone (Current): 3.5 – 4.5 USDT
Next Support: 2.7 USDT (structural low from 2020)
Resistance 1: 5.375 USDT
Resistance 2: 6.800 USDT
Resistance 3: 9.965 USDT
Major Resistances: 14.464 – 21.813 – 32.272 – 45.612 USDT
These levels provide the roadmap for ATOM’s mid-to-long-term direction.
---
🟢 Bullish Scenario
1. Confirmation: a weekly close above 5.375 – 5.5 USDT with strong volume.
2. Implication: signals that selling pressure is fading and the support zone has held.
3. Targets:
Initial: 6.8 USDT
Mid-term: 9.965 USDT
Extended: 14.4 – 21.8 USDT if market momentum strengthens.
4. Pattern potential: a double bottom or accumulation base may form if the zone continues to hold and buyers step in aggressively.
---
🔴 Bearish Scenario
1. Confirmation: a weekly close below 3.5 USDT.
2. Implication: breakdown of historical support → opens the path for deeper downside.
3. Targets:
First: 2.7 USDT (2020 structural support).
Extended: 2.1 – 1.6 USDT if selling accelerates.
4. Warning: repeated testing of the same support weakens it, making a breakdown scenario highly possible if buyers fail to defend.
---
📌 Structure & Pattern Insights
Horizontal consolidation within support zone, small weekly candles → market indecision.
Lower highs keep pressuring the structure downward.
Potential double bottom if ATOM holds above 3.5 and reverses strongly.
Beware of false breaks — always confirm with volume and retest.
---
🎯 Trader & Investor Takeaways
Short-term traders: watch closely for reaction inside 3.5–4.5. Aggressive entries possible here with tight stops below 3.3. Safer entries only after a weekly close above 5.5.
Long-term investors: this zone is historically a strong accumulation area, but patience and risk management are crucial due to breakdown risks.
Strategy: scale into positions gradually, risk max 1–2% per trade, and rely on weekly confirmation.
---
📝 Conclusion
ATOM is at a crossroads. Holding the 3.5–4.5 support zone could spark a rebound toward 6.8 – 10 USDT, while a confirmed breakdown below 3.5 would expose ATOM to 2.7 or even lower.
The next weekly close will likely decide the medium-term trend. ATOM now stands like a last fortress under siege — either it defends and rallies, or it crumbles into deeper lows.
---
#ATOM #Cosmos #ATOMUSDT #Crypto #TechnicalAnalysis #PriceAction #SupportResistance #CryptoMarket #SwingTrading #InvestInCrypto
ATOMUSDT Channel Breakout Alert!ATOMUSDT Technical analysis update
NASDAQ:ATOM is bouncing from a major support zone and has formed a descending channel at the bottom of the zone on the 4H chart. Currently, the price is breaking above the channel's trend resistance and trading above both the 50 and 100 EMAs on the 4H timeframe — a bullish signal for ATOM.

Cosmos (ATOM) Price Forecast: Key Buy Zones and Future TargetsCRYPTOCAP:ATOM #ATOM #COSMOS #ATOMUSDT #ATOMUSD
Brief overview of the cryptocurrency Cosmos (ATOM/USDT), from February 6th, I noted buying points and targets for securing profits and drafted a roadmap for the future price movement of Atom (as a rough guide).
Currently, interesting buying points on the correction are $10.00 and $9.40. With subsequent growth targets at $12.00 and $15.00, from which it will be decided whether it will continue to rise or head for a new low.
ATOM Liquidation Heatmap

ATOM⚛️ triangle breakout 2Cosmos broke up this triangle📐 and I think there is chance for run to 52.9 and even higher. Setting BUY LIMIT order to previous range high to catch🎣 the pullback.
ENTRY : local high @ 31.7
STOPLOSS (SL) : local low @ 27.7
TARGET (TP) : height of the triangle projected from midpoint of the local range (BUY LIMIT - STOPLOSS) @ 52.9
REWARD RISK RATIO (RRR) : 5.3
INVALIDATION : when SL level hit
ETH should be stronger than BTC , so ALTs should be good to go:
Check my other stuff in related ideas.
Please like👍, comment🗣️, follow me✒️, enjoy📺!
⚠️Disclaimer: I'm not financial advisor. This is not a financial advice. Do your own due dilingence.

ATOM⚛️ triangle breakoutCOSMOS broke up this triangle 📐 and I think there is chance for run to 51.5 and even higher. Setting BUY LIMIT order to catch the pullback. ATOM ⚛️ come on!
ENTRY : BUY LIMIT - local high @ 41.0
STOPLOSS : local low @ 38.8
TARGETS : TARGET1 - resistance @ 47.9 | TARGET2 - height of the triangle projected from midpoint of the local range (BUY LIMIT - STOPLOSS) @ 51.5
REWARD RISK RATIO (RRR) : TARGET1 - 3.1 | TARGET2 - 4.8
INVALIDATION : when STOPLOSS level hit
Check my other stuff in related ideas.
Please like👍, comment🗣️, follow me✒️, enjoy📺!

ATOMUSD eying 10.00 as possible swingATOMUSD
Since start of this launch it was jumped to the 7.6 level and after that its even fell below the launching price and even reached the historical low level which is 1.081
2.5 and 4.5 levels are acted as important support level for the bullish trend.
And yesterday it has reached around 7.000 level which is a key psychological level and faces some minor reversal and i am expecting ATOMUSD will fall back towards the
.618 Fibonacci retracement level.
And on the upper side it will face some rejection around .786 Fibonacci retracement level.
And it is currently trading within a channel and breaking of the minor channel will pave the way towards 10.000 swing target level.
To the downside the 5.000 level will act as strong support for the bull

LOOKING FOR AN ALT COIN RALLYATOMBTC HAS MADE 5 TOUCHED WITH-IN THE DESCENDING WEDGE.
THE BOTTOM IS MOST LIKELY IN AND NOVEMBER SHOULD BE GOOD FOR ALTS
🔸️Get Profitable Trading Set-Ups and Signals📈
🔸️Copy Our Diversified Long Term Portfolio📊
🔸️Engage With Our Skilled Community👥👥👥
Earn Up To $4293 in Crypto and Other Assets🤑
🥂DM US
