ATOM formed cypher for upto 28% profit rallyHi dear friends, hope you are well and welcome to the new trade setup of Cosmos (ATOM) coin with BTC pair.
Previously we had a nice harmonic trade of ATOM:
Now on a 4-hr time frame, ATOM formed bullish Cypher pattern. At the moment, after the completion of the final leg, the priceline is moved slightly up. Therefore, we need to wait for a little correction to buy it from the buying zone.
Note: Above idea is for educational purpose only. It is advised to diversify and strictly follow the stop loss, and don't get stuck with trade.
ATOMUSDT

ATOMUSDTI think it is in cosolidation and its going to grow to the box nomber1 and then drop to the box nomber2

Atom BreakoutAtom has been having downtrend for some time , but recently it has broken out of the downtrend, by checking resisitance and support line plus breakout of the downtrend, we are sure that it will make support on previous resistance as shown on my chart, to make a more bullish move

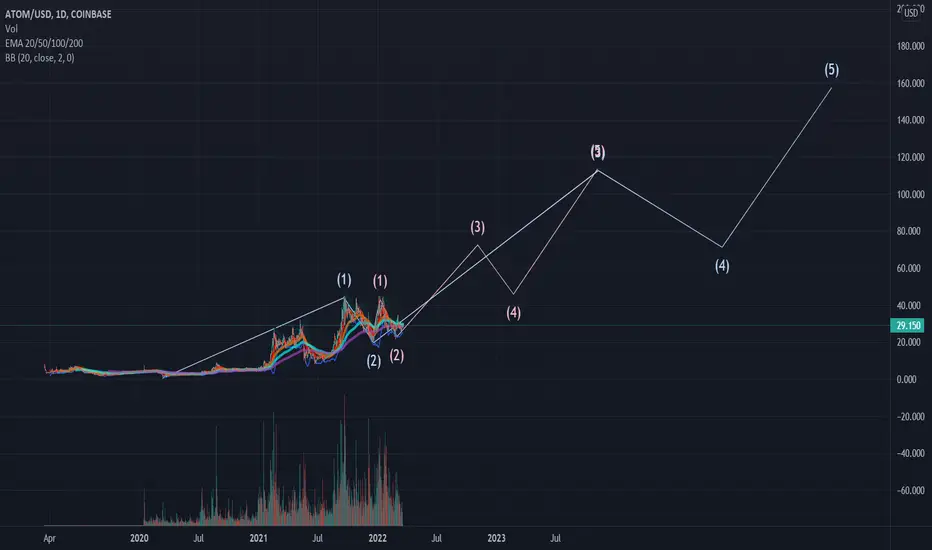
ATOM/USDTesting/tracking elliot wave theory. Please do not trade off idea without S/L. Not financial advice.
Link to previous chart:
If you press play on the previous chart, you'll see that wave 1 has been completed and wave (2) has also completed and retraced a bit further than predicted. Prediction was 36 and we got 22 lol. The start of this new wave is 20 so If this new impulse wave is correct the bottom of wave (2) is already in and we should be working towards wave (3). If this chart plays out then it would be safe to say that we're in altseason. Wave (3) top can be a bit lower than predicted, making the wave (5) line longer, however the top of these waves should be relatively around the area of my prediction.
another scalp trade at ATOMhey traders
as i said B4, im looking for 19$ at atom
its just a scalp trade
and its the 3rd scalp trade
what u think about Crypto or Atom ?
is it bullish ?
i have 2 say, im still bearish on this market
Just not yet
share your chart and leave a comment

Cosmos longCosmos bounced off the ascending trendline. Asset bounced off the support area. Bullish movement to resistance level at 29 is expected to happen.


ATOM - showing signs of strengthATOM is the native coin of the COSMOS ecosystem. Mainly used for governance and staking, it is set to gain better value accrual this 2022. Mainly bullish on the coin due to 1) superfluid staking 2) interchain security 3) NFT marketplace 4) airdrops 5) EVMOS launch. Many of which will increase transaction count. Should value accrual be done right this time, alongside the hype with LUNA as the IBC ecosystem, we could be seeing a good increase in value. Technicals wise, we will analyze the possible move based on fibonacci pulled from the swing low in Jun 2021 and Swing high in Sept 2021. You can learn more about how to use the fibonacci retracement tool here . The recent bounce off the 0.382 fib and break of brearish trendline makes ATOM a potentially good trade
Trading plan - 3 scenarios
Very bullish -30%
Currently sitting at a price of $30 on 27/2, this would be the DCA price you have, selling at the 0.786 fib at $36 for repeated 20% gains. The fib was an old resistance which ATOM has retraced constantly from to the 0.618 levels at $30. You could then take profits at ATH at $44, wait for a retrace till $36 again to load up. Upper targets are 36, 44, 67 and 104, with the 1st week of April being the projected end of trading time frame. Levels are possibly visited once volume kicks in and IBC narrative is pushed forth. TLDR - sell on upper fibs, rebuy on fib retracements at lower levels or retest of ATH after it has been broken (some people might not get filled due to front running once ATH is broken)
Conservative bullish - 40%
Quite a normal behaviour based on the timeline of price action we see in ATOM + suspected delay of any of the above stated protocols. Here, we would expect a retracement towards $24 (retest of bearish trendline) to $26 (0.5 fib levels). DCAing at this range or slightly below 0.5 fib level would be key. Constantly selling above 0.618 fib levels ($30) could provide 16-20% gains as well, but remember to rebuy in at 0.618 levels if a new bullish trendline support is formed.. Upper targets are 36 and then ATH at 44 and then possibly 48-55 (10% rule past break of ATH, middle value between 45 and the 1.618 fib extension)
Bearish - 30%
Due to heavy bearish macrofactors. scam weekend pump, or delayed ecosystem launches, selling volume may spike and ATOM may see a retracement back to $21 (lower 0.382 fib) as stoplosses get hit and cascade of sells occur. I would then expect to see a reattempt to break out of the trendline, only to be rejected. If a breakout occurs but brearish stance remains, it would be good to add to the shorts near upper fib lines $26 (0.5 fib levels). TLDR - short on breakdown and then retest of bearish trendline, and also short on retracement to upper fibs. Lower targets are 21.7, 17.1, 16.3
Am generally more bullish due to lower selling volume as well as high selling volume bringing down price lesser. Due to volatile macroeconomics, if you are trading on platforms, be sure that it offers spot and perps like Bybit . it would be better to stay in spot rather than be trading perps/futures to prevent liquidation. Remember to set a stop loss to have a good sleep

long on ATOM$ATOM is bouncing off the strong support level. Bullish movement to resistance level at 33.7$ is likely to happen.

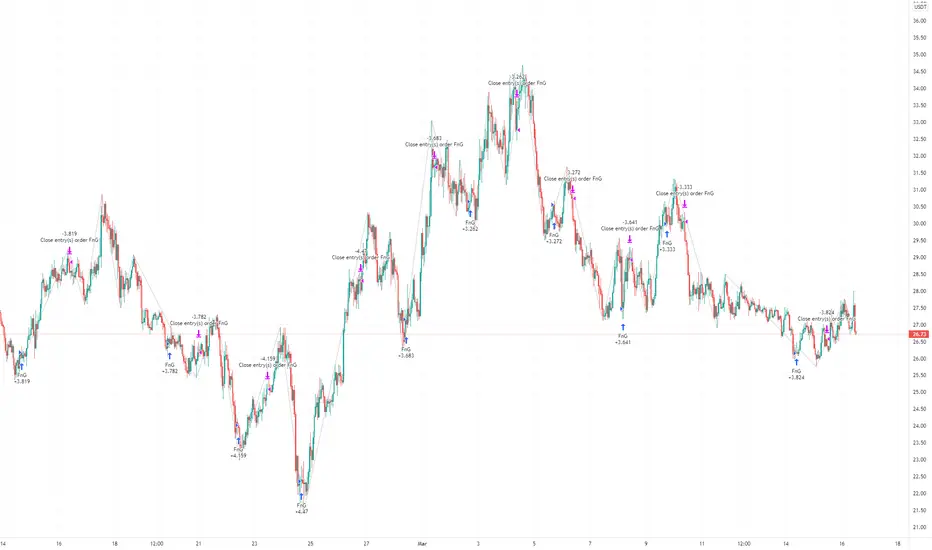
Trading strategy for ATOMUSDT.Trading strategy for ATOMUSDT.
This strategy utilizes fear and greed index at alternative.me
Why Measure Fear and Greed?
The crypto market behavior is very emotional. People tend to get greedy when the market is rising which results in FOMO (Fear of missing out). Also, people often sell their coins in irrational reaction of seeing red numbers. With our Fear and Greed Index, we try to save you from your own emotional overreactions. There are two simple assumptions:
Extreme fear can be a sign that investors are too worried. That could be a buying opportunity.
When Investors are getting too greedy, that means the market is due for a correction.
Therefore, we analyze the current sentiment of the Bitcoin market and crunch the numbers into a simple meter from 0 to 100. Zero means "Extreme Fear", while 100 means "Extreme Greed". See below for further information on our data sources.
UNDERSTANDING THE METRICS AT TRADING VIEW
Maximum Drawdown
The maximum drawdown metric refers to the "worst-case scenario" for a trading period. It measures the greatest distance, or loss, from a previous equity peak.5
What is a Good Profit Factor?
Any ratio greater than one means we can earn more than we lose. So, technically:
A factor higher than 1 denotes a winning system.
A factor lower than 1 denotes a losing system.
Percent Profitable
The percent profitable metric is also known as the probability of winning. This metric is calculated by dividing the number of winning trades by the total number of trades for a specified period.
See profit report below.
ATOM is copying BTC but...we can observe that the priceaction has respected the blue dotted trendline for quite a while, almost a year. A rupture would almost certainly cause bleeding at least up to $11, which is quite far away. The opposite case sees the break of the high green trendline and the conquest of new peaks.
Based on what happens do your job.

ATOM/USDT BUY SETUP ATOM Breakout falling wedge pattern
MACD showing Bullish crossover with big buy volume on resistance, Good setup for entry
Any great News. 17 March Theta testnet launch
Stoploss : $25

#ATOM/USDT 12HOUR UPDATE BY CRYPTOSANDERSWelcome to ATOM/USDT quick analysis
I have tried my best to bring the best possible outcome in this chart.
Hello members, welcome to our ATOM/USDT 12hr update,
Atom/usdt currently trading inside a flag pattern in the higher time frame.
There are high chances to bounce from the lower trend line or green zone which are working as strong support.
If it bounces then we will be able to see an almost 40%-50% rally.
This chart will be invalidated if it breaks the lower trend line.
Entry:-$23.50,$26.00
Target:-40% TO 50%
Stoploss:-$21.08
With leverage 3x to 5x
And long term hold and good profit 😉🙂😊✈️✈️
Q:-What do you think about this?
Do you think we will see a new ATH of ATOM in the next quarter?
Share your views in the comment section.
Remember:-This is not a piece of financial advice. All investment made by me is under my own risk and I am held responsible for my own profit and losses. So, do your own research before investing in this trade.
Happy trading.
Sorry for my English it is not my native language.
Do hit the like button if you like it and share your charts in the comments section.
Thank you...

long ATOMLong ATOM, taking the the dip for a correction, with leverage 10.
Entry: 26.58 - 26.6
SL: 26.29 (short stop)
TP1: 26.95
TP2: 27.23

AtomusdtAtom is at major support zone. If it closes a daily candle below 25.5, short it for 21.5, 20.5, and 17.5.

Cherish the volatilityTake what is offered, I guess. Do use stop loss as this can turn down equally quickly.
This move should basically mirror what is expected from BTCUSD today.
