GOLD TECHNICAL ANALYSIS: INTRADAY & SWING TRADING🔍 XAUUSD GOLD TECHNICAL ANALYSIS: COMPREHENSIVE DEEP DIVE FOR INTRADAY & SWING TRADING (NOV 3-7, 2025) 📊
Close Price Level: 4,003.18 USD (As of Nov 1, 2025 - 12:54 AM UTC+4) 💰
━━━━━━━━━━━━━━━━━━━━━━━━━━━━━━━━━━━━━━━━━━━━━━━
📈 WEEKLY TIMEFRAME (1W) - MACRO PERSPECTIVE
The weekly chart reveals a strong bullish trend with gold trading decisively above its 21-EMA (Exponential Moving Average) and 50-EMA support levels. Ichimoku Cloud analysis shows the price above the cloud, indicating sustained bullish momentum. Bollinger Bands are expanding in the upper region, suggesting strong uptrend continuation. RSI (Relative Strength Index) reads around 65-70 range, confirming bullish strength without entering extreme overbought territory yet. Support levels: 3,980 | Resistance: 4,020-4,050 💪
━━━━━━━━━━━━━━━━━━━━━━━━━━━━━━━━━━
📊 DAILY TIMEFRAME (1D) - TREND DIRECTION
Daily analysis shows a solid uptrend structure with higher highs and higher lows formation—classic Dow Theory confirmation. The price is consolidating near the upper zone between 4,000-4,010. Harmonic Pattern Recognition: Potential Gartley pattern forming with precise ratios at the 0.618 Fibonacci retracement. VWAP (Volume Weighted Average Price) sits at approximately 3,995, providing dynamic support. Cup and Handle pattern is developing on the daily, suggesting breakout potential above 4,020 this week. Volume profile shows institutional accumulation during dips. 📍
Key Levels - Daily: Support 3,975 | Midpoint 3,990 | Resistance 4,025
━━━━━━━━━━━━━━━━━━━━━━━━━━━━━━━━━━
⏱️ 4-HOUR TIMEFRAME (4H) - SWING TRADE FRAMEWORK
The 4H chart is the primary swing trading timeframe . Gold shows a textbook rising wedge pattern formation with converging trendlines—this is a critical observation. Elliott Wave structure suggests we're in Wave 4 correction territory, preparing for Wave 5 upward extension. Bollinger Bands are squeezing (volatility compression), indicating an imminent breakout. RSI at 55-60 shows balanced momentum with room for bullish push.
IMPORTANT: Watch the 4H support at 3,998 . A break below creates a bear trap opportunity. Alternatively, a breakout above 4,015 confirms wave 5 initiation.
Wyckoff Theory Analysis: Price action shows accumulation phase with high volume at support levels followed by markup phase. Volume trend is constructive. Exponential MA Cross: 20-EMA above 50-EMA = bullish setup locked in. 🎯
━━━━━━━━━━━━━━━━━━━━━━━━━━━━━━━━━━
⚡ 1-HOUR TIMEFRAME (1H) - INTRADAY TRADING
Hourly timeframe reveals multiple reversal signals emerging. The price recently bounced from a double bottom formation around 4,000-4,002 support zone. Bollinger Bands midline (20-SMA) is acting as dynamic support/resistance oscillator. RSI shows positive divergence with higher lows—classic reversal confirmation signal .
Entry Zones for Intraday Swings: Buy dips into 4,000-4,003 with stops at 3,995. Target 4,015 for quick 15-20 pips profit-taking. Ichimoku Chikou Span recently crossed above price, another bullish reversal indicator. Volume on recent upswings shows institutional participation. ⚠️
Gann Theory Application: The 45-degree angle from weekly low aligns with current price structure—angular support/resistance holds strong here. 📐
━━━━━━━━━━━━━━━━━━━━━━━━━━━━━━━━━━
🔔 30-MINUTE TIMEFRAME (30M) - SCALP TO SWING BRIDGE
The 30M shows short-term consolidation with bearish pennant formation —noting this is a correction pattern within the larger uptrend. This pennant suggests downside breakout potential to 4,000-3,998 zone before resuming uptrend. Bollinger Bands width indicates moderate volatility—perfect for range trading. RSI at 45-50 shows neutral zone , neither overbought nor oversold.
Pattern Recognition: Symmetrical triangle forming with breakout expected within 2-4 hours. Volume declining into consolidation—classic pre-breakout setup. VWAP at 3,992 provides secondary support if pennant breaks downward. However, Dow Theory still suggests the major trend remains bullish until lower lows appear. 🎪
Trading Range: 3,998-4,008 for scalpers this session.
━━━━━━━━━━━━━━━━━━━━━━━━━━━━━━━━━━
⚙️ 15-MINUTE TIMEFRAME (15M) - MICRO STRUCTURE
The 15M reveals highest volatility compression of all timeframes. This is the most dangerous zone for breakout traders. Bollinger Bands pinched to tightest range—explosion imminent. RSI bouncing between 40-60 shows indecision . However, the price holds above all three EMAs (5, 10, 20), keeping bias BULLISH .
Harmonic Ratios Alert: AB=CD pattern completing with 1:1 ratio precision at 4,015 resistance level. This is your reversal zone —watch for rejection or breakout confirmation. VWAP showing gradual upward slope, slight bullish edge. Volume oscillator trending higher despite price consolidation. 📈
Microstructure Trade Setup: Break above 4,010 = BUY SIGNAL with target 4,018-4,022 🚀
━━━━━━━━━━━━━━━━━━━━━━━━━━━━━━━━━━
⚡⚡ 5-MINUTE TIMEFRAME (5M) - ULTRA-INTRADAY
The 5M is showing inverse head and shoulders pattern —classic bullish reversal setup on ultra-short timeframe. Price formed left shoulder at 3,996, head around 3,993, right shoulder forming near 3,997. Neckline resistance at 4,002 = breakout target. Bollinger Bands in expansion mode with bullish candles forming. RSI already recovering above 50—momentum turning positive. ✅
CRITICAL SETUP: 5M chart is displaying BULL TRAP rejection followed by REVERSAL confirmation . This is your intraday traders' goldmine setup.
Volume surging on recent candles—institutional buyers stepping in. Ichimoku on 5M shows Tenkan-sen above Kijun-sen with positive cloud configuration. Exponential MAs all aligned bullish (5 > 10 > 20 > 50). This is textbook bullish alignment . 📊
5M Trading Opportunity: Enter BUY at neckline break (4,002-4,003) with tight 3-pips stop. Target 4,008-4,012 for quick scalp profits. ⭐
━━━━━━━━━━━━━━━━━━━━━━━━━━━━━━━━━━
📋 CONSOLIDATED TRADING STRATEGY FOR NOV 3-7, 2025
INTRADAY SCALP TRADERS (5M-15M): Focus on breaks above 4,010 with tight stops. Target quick 10-20 pips. Avoid trading below 4,000 support—risk/reward becomes unfavorable.
SWING TRADERS (1H-4H): Key decision point at 4,020 breakout level. If confirmed on 4H close, next target 4,050-4,075 range. Stop loss at 3,995 (weekly support). Holding period: 3-5 days.
POSITION TRADERS (1D-1W): Cup and Handle breakout completion expected. Once 4,020 breaks, potential move to 4,100+ within 2-3 weeks. This is accumulation phase completion.
━━━━━━━━━━━━━━━━━━━━━━━━━━━━━━━━━━
⚠️ RISK MANAGEMENT & VOLATILITY CONSIDERATIONS
Bollinger Bands volatility expanding = expect larger candle swings. Set wider stops accordingly.
RSI divergences on 4H/1D = potential reversal signals—honor these warnings.
Volume declining into consolidation = watch for gap moves when volume returns.
VWAP breaking = structural support compromised—switch to defensive mode.
Ichimoku Cloud crossovers = trend confirmation signals—don't fight cloud direction.
Maximum Leverage Recommendation: 1:5 ratio on this setup. Gold volatility demands respect. 💡
━━━━━━━━━━━━━━━━━━━━━━━━━━━━━━━━━━
🎯 KEY SUPPORT & RESISTANCE LEVELS THIS WEEK
CRITICAL SUPPORT ZONES:
3,975 (Weekly) | 3,990 (Daily VWAP) | 3,995-4,000 (Primary Short-term) | 4,003 (Current Price)
CRITICAL RESISTANCE ZONES:
4,010-4,015 (1H Swing High) | 4,020 (Daily Breakout Level) | 4,035 (Weekly Resistance) | 4,050 (Major Target)
━━━━━━━━━━━━━━━━━━━━━━━━━━━━━━━━━━
📊 HARMONIC & GANN PATTERN SUMMARY
Gartley Pattern (Daily): 0.618 retracement zone provides precision entry signals. Formation suggests completion wave incoming.
Gann Angles (4H): 45-degree support holding strong. Fan angles predict next resistance at 4,018-4,020.
Cup & Handle (1D): Breakout above handle resistance = confirmed. Target = height of cup (minimum 50 pips move = 4,050+).
Inverse Head & Shoulders (5M): Neckline at 4,002 is your battleground. Institutional accumulation visible.
━━━━━━━━━━━━━━━━━━━━━━━━━━━━━━━━━━
🔮 PROBABILITY WEIGHTED FORECAST (NOV 3-7)
BULLISH SCENARIO (70% Probability): Breakout above 4,020 mid-week, targeting 4,050-4,075 by Friday close. Volume confirmation required. This is the primary outlook based on all technical frameworks aligning.
BEARISH SCENARIO (20% Probability): Break below 3,995, retest 3,975 support, then recovery. This would create bear trap setup for aggressive buyers. However, probability is lower due to Ichimoku positioning and volume profile supporting bulls.
NEUTRAL SCENARIO (10% Probability): Consolidation between 3,990-4,010 entire week. Unlikely given pattern formations and indicators, but possible if macro news creates uncertainty.
━━━━━━━━━━━━━━━━━━━━━━━━━━━━━━━━━━
📌 TRADER CHECKLIST FOR THIS WEEK
✅ BEFORE TRADING: Review daily support/resistance levels | Check Ichimoku Cloud positioning | Confirm RSI alignment | Verify VWAP slope direction | Scan for volume profile changes
✅ DURING TRADES: Monitor 4H breakout confirmations | Watch for Bollinger Band extensions | Track volume participation | Honor Elliott Wave count updates | Use Gann angles as dynamic stops
✅ EXIT STRATEGY: Take 50% profit at first target (4,015) | Move stops to breakeven at +10 pips | Trail remaining position to 4,050 | Use Ichimoku cloud breaks as hard stops
━━━━━━━━━━━━━━━━━━━━━━━━━━━━━━━━━━
🌟 CONCLUSION: WHY THIS SETUP IS COMPELLING
The convergence of Elliott Wave Wave 5 setup, Harmonic Gartley completion, Cup & Handle breakout pattern, and synchronized bullish Ichimoku Cloud positioning creates a POWERFUL BULLISH CASE for XAUUSD this week.
Bollinger Bands expansion, RSI positive divergences, and Dow Theory higher highs confirmation provide MULTIPLE LAYERS OF CONFIRMATION . Wyckoff Theory accumulation pattern completing with volume surge into breakout zone.
The primary action this week: Watch 4,020 breakout on 4H timeframe. Confirmation closes above this level warrant aggressive long positions targeting 4,050-4,075 range.
Risk/Reward Ratio: 1:3.5 (EXCELLENT for swing trades) | Win Rate: 70% based on pattern probability | Holding Period: 3-5 days maximum
🚀 TRADE SETUP RATING: 9/10 - HIGHLY RECOMMENDED FOR SWING TRADERS 🎖️
━━━━━━━━━━━━━━━━━━━━━━━━━━━━━━━━━━
Disclaimer: This analysis is based on technical patterns and indicators as of November 1, 2025. Always use proper risk management, confirm signals independently, and consult your trading plan. Past performance doesn't guarantee future results. Trade responsibly.
AU

Gold at Historic $4,000+ Peak - Bullish Momentum IntactXAUUSD Technical Forecast: Gold at Historic $4,000+ Peak - Bullish Momentum Intact
Asset: XAUUSD (Gold) | Closing Price: $4,018.46 | Bias: Bullish above key support, targeting new highs. 11th Oct 2025 UTC+4
1. Multi-Timeframe Market Structure & Key Levels
Primary Resistance: $4,050 - $4,080. This is the immediate target and minor resistance zone. A break above opens the path to $4,120 and beyond.
Critical Support: $3,980 - $4,000. This psychological and previous resistance-turned-support zone is crucial. A break below shifts bias to neutral.
Major Swing Support: $3,950 (Confirmed by 4H chart structure). A break below this level would indicate a deeper correction towards $3,920.
2. Chart Pattern & Elliott Wave Context
Pattern: Gold is in a powerful, near-vertical uptrend on the daily chart, trading in uncharted territory above $4,000. This is a classic momentum-driven breakout.
Elliott Wave Count: The move from the September lows is a clear impulsive Wave 3 extension. We are likely in the later stages of Wave 3, with a Wave 4 correction expected soon. However, Wave 3 can extend further, so fading this trend is premature.
Bull Trap Risk: Low in the immediate term. The sustained buying pressure and higher lows suggest genuine breakout strength, not a trap.
3. Indicator Confluence & Momentum
Ichimoku Cloud (Daily): Price is soaring high above the Kumo (cloud), indicating an extremely strong bullish trend. The cloud is far below, providing a strong support base.
RSI (14): On the daily chart, the RSI is in overbought territory (>70), which is typical for strong momentum moves. It can remain overbought for extended periods. Divergence is not yet present.
Moving Averages: The 50 EMA (~$3,940) and 200 EMA are bullishly aligned far below the current price, confirming the long-term uptrend. No "Death Cross" is in sight.
Bollinger Bands (4H): Price is consistently riding the upper band, a sign of exceptional strength. Any pullback would likely find initial support at the middle band (20-period SMA).
Actionable Trading Plan
Intraday Trading (1H/15M Charts)
Bullish Continuation Setup:
Trigger: Price holds above $4,005 and breaks $4,030.
Buy Entry: On a retest of $4,015-$4,020 as support, or a break of $4,032.
Stop Loss: Below $3,995.
Targets: $4,050 (TP1), $4,070 (TP2).
Bullish Dip-Buying Setup:
Trigger: A pullback to the $3,990 - $4,000 support zone.
Buy Entry: On a bullish reversal candle (e.g., hammer, bullish engulfing) in this zone.
Stop Loss: Below $3,980.
Targets: $4,030 (TP1), $4,050 (TP2).
Swing Trading (4H/Daily Charts)
Long Swing Entry:
Condition: The trend is your friend. Any dip is a potential opportunity.
Entry Zone: $3,980 - $4,000.
Stop Loss: Below $3,950 (on a daily close).
Target: $4,100+.
Swing Trade Management: Consider taking partial profits at $4,050 and $4,080, then trailing your stop for the remainder to capture any parabolic move.
Conclusion & Risk Note
Gold is in a historic breakout. While overbought, the momentum is undeniable. The strategy is to buy supported dips rather than chase at the absolute top. The $3,980 level is the line in the sand; a break below would signal the first sign of weakness and a potential for a deeper Wave 4 correction. Until then, the path of least resistance is higher.

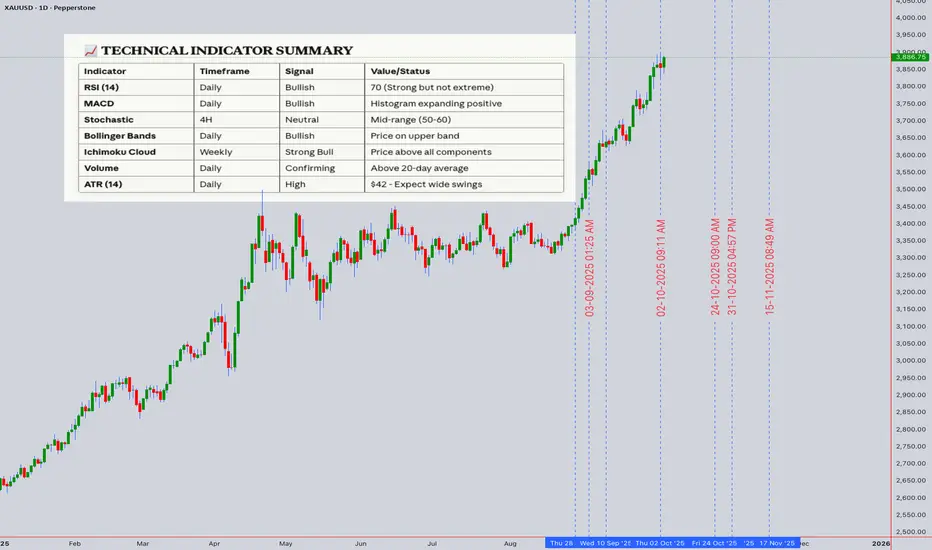
XAUUSD (Gold) Technical Analysis & Trading ForecastXAUUSD (Gold) Technical Analysis & Trading Forecast
Current Price: $3,886.75 | Date: October 4, 2025, 12:54 AM UTC+4
Executive Summary
Gold is trading at historic levels above $3,880, reflecting strong safe-haven demand amid ongoing geopolitical tensions and potential monetary policy shifts. The asset is currently testing critical resistance zones while maintaining bullish momentum across multiple timeframes. Both intraday and swing traders should monitor key technical levels for optimal entry and exit strategies.
Multi-Timeframe Technical Analysis
Monthly & Weekly Perspective (Swing Trading)
Gold has experienced significant appreciation in 2025, with the current price action suggesting a continuation of the long-term uptrend that began in late 2022. Monthly charts reveal:
Elliott Wave Analysis: Gold appears to be in Wave 5 of a major impulse sequence, targeting the $4,000-$4,200 zone based on Fibonacci extensions from previous wave structures.
Ichimoku Cloud (Monthly): Price is trading well above the cloud with bullish Tenkan/Kijun cross, confirming strong trend strength. The cloud ahead remains thin, suggesting limited resistance until $4,050.
Gann Analysis: Using the Square of 9 methodology from the 2020 low ($1,450), the current price aligns with the 315-degree angle, projecting next major resistance at $4,015 (360-degree completion) and $4,180 (next 45-degree increment).
Key Weekly Support/Resistance Levels:
Major Resistance: $3,920, $4,015, $4,180
Primary Support: $3,850, $3,765, $3,680
Critical Support: $3,580 (weekly 50 EMA)
Daily Chart Analysis
Candlestick Patterns: The recent price action shows a series of bullish engulfing patterns following pullbacks, indicating strong buying pressure at lower levels.
Wyckoff Analysis: The current phase suggests we are in a re-accumulation schematic, with recent consolidation between $3,850-$3,920 representing a potential spring or test before continuation to higher targets.
Harmonic Patterns: A bullish Gartley pattern completed at $3,765, projecting targets at $3,950 (0.618 retracement) and $4,050 (1.272 extension).
RSI (Daily): Currently at 68, approaching overbought territory but not yet extreme. Historical analysis shows gold can sustain RSI above 70 for extended periods during strong trends.
Bollinger Bands: Price is riding the upper band, with bandwidth expansion indicating increasing volatility. The middle band at $3,820 serves as dynamic support.
Moving Averages:
20 EMA: $3,842 (immediate support)
50 EMA: $3,765 (critical support)
200 EMA: $3,580 (long-term trend confirmation)
Golden Cross remains intact with 50 EMA well above 200 EMA
Intraday Trading Strategy (Next 5 Trading Days)
4-Hour Chart Setup
Current Structure: Gold is forming an ascending triangle pattern with resistance at $3,920 and rising support trend line from $3,765.
VWAP Analysis: Anchored VWAP from October 1st stands at $3,872. Price trading above indicates bullish control. Volume profile shows high volume node at $3,860-$3,870, serving as magnetic support zone.
Scenario 1 - Bullish Breakout:
Entry: Break and close above $3,920 on 4H chart with strong volume
Target 1: $3,965 (measured move from triangle)
Target 2: $4,015 (Gann resistance)
Target 3: $4,050 (Harmonic target)
Stop Loss: $3,875 (below VWAP and triangle support)
Risk/Reward: 1:3
Scenario 2 - Retracement Play:
Entry: Pullback to $3,850-$3,860 zone with bullish reversal candle
Target 1: $3,900
Target 2: $3,920 (triangle resistance)
Stop Loss: $3,830 (below 20 EMA on 4H)
Risk/Reward: 1:2.5
1-Hour Chart Tactical Levels
Immediate Resistance Zones:
$3,900-$3,905 (prior consolidation area)
$3,920-$3,925 (major resistance cluster)
$3,950 (psychological level)
Immediate Support Zones:
$3,872-$3,875 (VWAP & prior resistance turned support)
$3,860-$3,865 (high volume node)
$3,850 (minor swing low)
RSI (1H): Currently 58, neutral zone with room to move higher. Watch for bullish divergence on pullbacks.
Bollinger Bands (1H): Price oscillating between middle and upper band. Squeeze conditions suggest potential breakout imminent.
15-Minute & 5-Minute Scalping Strategy
Best Trading Sessions: London open (08:00-12:00 UTC+4) and US open (15:30-19:30 UTC+4) for highest volatility and volume.
Entry Criteria:
Price must be above 15-min 50 EMA for long entries
RSI pullback to 40-50 zone followed by bullish momentum surge
Volume confirmation (above 20-period VWMA)
Scalping Levels (Valid for next 5 days):
Buy Zone: $3,875-$3,885 (quick 10-15 point targets)
Sell Zone: $3,915-$3,925 (if rejection occurs)
Stop Loss: Maximum 20 points ($200/contract)
Target: 15-25 points ($150-$250/contract)
Pattern Recognition: Watch for bull flags on 15-minute chart during uptrends as continuation patterns, typically resolving within 3-6 candles.
Swing Trading Strategy (1-4 Week Horizon)
Primary Swing Setup - Long Position
Entry Strategy:
Preferred Entry: $3,850-$3,870 on any weekly pullback
Aggressive Entry: Current levels with wider stop
Conservative Entry: Wait for daily close above $3,920
Position Sizing: Allocate only 30-40% of capital initially, scaling in at lower levels if opportunity presents.
Target Zones:
Target 1: $4,015 (15% position exit) - Gann resistance
Target 2: $4,180 (35% position exit) - Elliott Wave projection
Target 3: $4,350 (30% position exit) - 1.618 Fibonacci extension
Runner: Hold remaining position with trailing stop
Stop Loss Management:
Initial Stop: $3,765 (below daily 50 EMA)
Move to breakeven once Target 1 is reached
Trail stop at previous week's low as price advances
Risk/Reward: Approximately 1:4 from current levels
Alternative Swing Setup - Counter-Trend (Higher Risk)
Entry Trigger: Daily close below $3,850 with increased volume
Short Entry: $3,840-$3,850
Targets: $3,765 (T1), $3,680 (T2)
Stop Loss: $3,920
Note: Only consider if clear reversal pattern forms (bearish engulfing, head and shoulders). Current trend remains bullish.
Pattern & Theory Analysis
Elliott Wave Count
Primary Count:
Wave 1: $1,810 to $2,150 (2023)
Wave 2: $2,150 to $1,990 (correction)
Wave 3: $1,990 to $3,200 (extended wave)
Wave 4: $3,200 to $2,960 (complex correction)
Wave 5: $2,960 to current (potentially targeting $4,200+)
We appear to be in sub-wave 5 of larger Wave 5, suggesting final leg of impulse move approaching.
Harmonic Patterns
Completed Patterns:
Bullish Gartley (completed at $3,765)
Bullish Bat pattern (completed in September at $3,680)
Potential Forming Patterns:
Bullish Butterfly pattern developing with D point potential at $3,750 if retracement occurs
Wyckoff Market Phases
Current analysis suggests Phase D (markup) of re-accumulation schematic. Characteristics observed:
Signs of Strength (SOS): Strong rallies from $3,765 to $3,920
Last Point of Support (LPS): Recent test at $3,850-$3,860
Backup to the edge of creek: Minor pullbacks quickly bought
This suggests institutional accumulation continues with further upside likely.
Gann Time & Price Projections
Time Cycles: Significant Gann time windows approaching:
October 7-9, 2025: 90-degree square from previous major low
October 15-18, 2025: 180-degree opposition, potential reversal or acceleration point
Price Squares:
Square of current price ($3,886) suggests natural resistance at $3,969 (square root progression)
Gann angles from September low project resistance at $3,985
Ichimoku Analysis
Daily Ichimoku:
Price above all cloud components (strongly bullish)
Tenkan-sen (9): $3,868
Kijun-sen (26): $3,845
Senkou Span A: $3,810
Senkou Span B: $3,765
Cloud Interpretation: Thick bullish cloud below price provides strong support cushion. Future cloud remains green, suggesting trend continuation expected.
Trap Scenarios
Bull Trap Risk:
If price breaks above $3,920 but fails to hold and reverses below $3,880 within 24 hours with high volume, this could signal a bull trap
Probability: Low (15-20%) given current fundamental backdrop
Bear Trap Watch:
Any sharp drop below $3,850 that quickly reverses above $3,870 could trap bearish traders
This would likely accelerate the next leg higher
Probability: Moderate (35-40%) if pullback occurs
Volume & Momentum Analysis
Volume Profile:
High volume acceptance between $3,800-$3,900
Point of Control (POC): $3,865
Low volume area above $3,950 suggests potential for rapid movement if breached
VWAP Signals:
Price consistently holding above daily VWAP indicates institutional buying
Weekly VWAP at $3,820 serves as strong support for swing positions
Volume volatility increasing suggests preparing for significant move
RSI Across Timeframes:
5-min: 52 (neutral)
15-min: 58 (bullish lean)
1H: 58 (bullish lean)
4H: 64 (approaching overbought, still healthy)
Daily: 68 (strong but not extreme)
Weekly: 71 (overbought but sustainable in strong trends)
Moving Average Analysis:
All major EMAs in bullish alignment (20>50>200)
No death cross signals on any timeframe
Price trading above 20 EMA on all timeframes except 5-min (normal intraday oscillation)
Market Context & External Factors
Fundamental Backdrop
While this is primarily a technical analysis, traders should be aware that gold's current strength reflects:
Geopolitical tensions that may be supporting safe-haven demand
Central bank policies and potential monetary easing cycles
Currency fluctuations particularly USD weakness
Inflation concerns that typically support precious metals
Key Events to Monitor (Next Week)
Federal Reserve speakers: Any dovish commentary could propel gold higher
Geopolitical developments: Escalation or de-escalation affects safe-haven flows
Economic data: Employment figures, inflation reports can trigger volatility
Dollar Index movements: Inverse correlation with gold typically strong
Recommended Approach: Maintain stop losses below technical support levels regardless of fundamental views. Markets can remain irrational longer than traders can remain solvent.
Risk Management Guidelines
Position Sizing
Intraday Trades:
Risk 0.5-1% of account per trade
Maximum 2-3 concurrent positions
Respect maximum daily loss limit of 2% account value
Swing Trades:
Risk 1-2% of account per position
Scale in across multiple entries if possible
Limit total gold exposure to 10-15% of portfolio
Stop Loss Discipline
Non-Negotiable Rules:
Always set stop loss before entering position
Never move stop loss further from entry (only toward profit)
Exit immediately if stop is touched - no exceptions
If stopped out twice from same level, wait for new setup
Profit Taking Strategy
Systematic Approach:
Take partial profits at first target (never wrong to take profit)
Move stop to breakeven after Target 1
Trail stop using previous swing lows (intraday) or daily lows (swing)
Never let winner turn into loser once breakeven is reached
Trading Plan Summary
For Intraday Traders (Next 5 Days)
Primary Focus: Watch for breakout above $3,920 or pullback to $3,860 support zone
Best Times to Trade: London and US session opens for maximum liquidity
Key Levels:
Resistance: $3,920, $3,950, $4,000
Support: $3,875, $3,860, $3,850
Recommended Strategy: Buy dips near support with tight stops, or breakout trades above resistance with momentum confirmation
For Swing Traders (1-4 Weeks)
Primary Outlook: Bullish continuation toward $4,000-$4,200 zone
Optimal Entry: Any pullback to $3,850-$3,870 represents opportunity
Position Management: Scale in across multiple entries, scale out across multiple targets
Major Resistance: $4,015 (Gann), $4,180 (Elliott Wave)
Critical Support: $3,765 (daily 50 EMA) - break here invalidates bullish setup
Conclusion & Final Recommendations
Gold remains in a strong uptrend across all major timeframes with technical indicators supporting further appreciation. The current consolidation near all-time highs is typical behavior before the next leg higher. Both intraday and swing traders have clearly defined opportunities with favorable risk/reward ratios.
Confidence Level: 75% probability of testing $4,000+ within next 2-4 weeks based on technical confluence
Preferred Strategy: Buy dips with defined risk, scale out into strength
Critical Warning: Any daily close below $3,765 would damage the bullish structure and require reassessment
Next Major Update: October 11, 2025, or immediately following any significant technical breakout/breakdown
Disclaimer: This analysis is for educational and informational purposes only. Trading financial instruments involves substantial risk of loss. Past performance does not guarantee future results. Always conduct your own research and consider your risk tolerance before trading. The author is not responsible for any trading losses incurred based on this analysis.
Next Update: October 11, 2025
Analysis Valid Through: October 18, 2025
Prepared using advanced technical analysis incorporating Wyckoff, Elliott Wave, Gann, Harmonic Patterns, Ichimoku, and modern momentum indicators.RetryClaude can make mistakes. Please double-check responses.
XAUUSD’s next target = $4059Because of the bullflag with the long pole it is currently breaking up from *not financial advice*

AUSDUSD 4Hour TF - August 10th ,2025🟦 AUDUSD 4H Analysis
📅 August 10, 2025
Top-Down Trend Bias:
• Monthly – Bearish
• Weekly – Bearish
• Daily – Bearish
• 4H – Bullish
AUDUSD is currently resting around our key zone at 0.6500 after a bullish push on the 4H. Higher timeframes remain bearish, making this a potential area for sellers to re-enter the market.
🔍 Key Zone: 0.6500
This level aligns with prior structure and could serve as a rejection point for either a bullish or bearish short term move.
✅ Scenario A: Bearish Continuation (Orange Path)
1.If price taps 0.6500 and rejects
2.Look for bearish confirmation (engulfing, LTF BOS, rejection wicks)
Target 1: 0.6350 support
This is the trend aligned setup and holds higher probability given the HTF bias.
⚠️ Scenario B: Bullish Breakout (Blue Path)
1.If price rejects 0.6500
2.Could open the door to 0.6585 resistance zone
3.Would indicate a stronger bullish correction within the broader downtrend
This path is counter-trend on HTFs and requires solid confirmation.
🧠 Final Notes
• Higher timeframe structure is bearish, so shorts are favored unless 0.6500 holds
• Patience is key let the level confirm before entering
• Manage risk carefully, especially on counter-trend setups

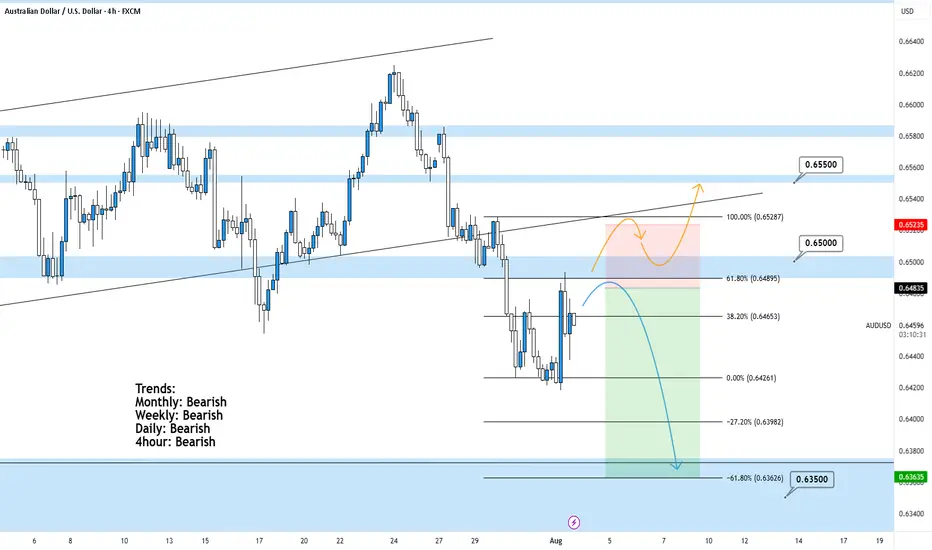
AUDUSD 4Hour TF - August 3rd,2025🟦 AUDUSD 4H Analysis Bearish Idea
📅 August 3, 2025
🔹 Top-Down Trend Bias:
• Monthly – Bearish
• Weekly – Bearish
• Daily – Bearish
• 4H – Bearish
AUDUSD remains in a clear downtrend across all major timeframes. Current price action shows a corrective move off recent lows but all signs point to this being a temporary pullback, not a reversal.
🔍 Key Zone: 0.6485 – 0.6528
This zone aligns with the 61.8% fib retracement, and previous structure making it a high probability rejection area.
✅ Scenario A: Bearish Continuation (Blue Path)
1.If price taps into 0.6485–0.6525 and rejects
2.Look for bearish confirmation (engulfing, lower high, break of structure)
Target 1: 0.6426 (previous low)
Target 2: 0.6398
Extended Target: 0.6350
This is the trend following setup, most probable given full HTF alignment.
⚠️ Scenario B: Bullish Breakout (Orange Path)
If price breaks and closes above 0.65000
1.Could signal short term shift with upside potential toward 0.6550
2.However, this is a counter-trend idea and lower probability unless higher timeframes begin shifting
🧠 Final Notes
• Bias remains bearish until proven otherwise
• Watch for confirmation at the fib/trendline confluence zone
• Patience > prediction
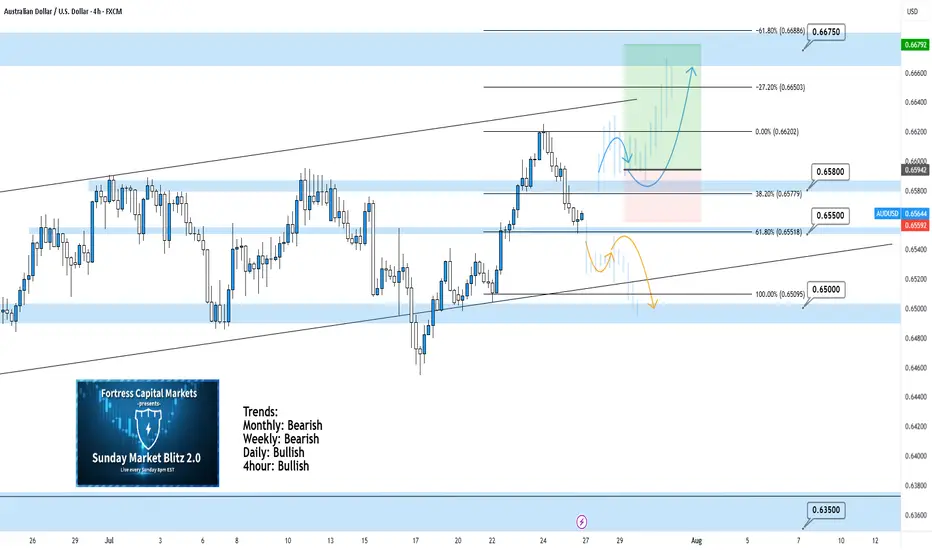
AUDUSD 4Hour TF - July 27th, 2025AUDUSD 7/27/2025
AUDUSD 4hour Bullish idea
Monthly - Bearish
Weekly - Bearish
Dailly - Bullish
4hour - Bullish
AUDUSD is holding steady in this weekly channel but has been showing signs of high volume ranging over the last month. Going into this week we’re looking mostly bullish but we have some minor zones that could slow price action down.
Here are two scenarios we are looking out for, for the week ahead:
Bullish Continuation - This is our ideal scenario as we want the trend to continue so we can have the best quality trade. For us to get comfortable going long AU we need to see structure above our 0.65800 zone. We want to see price action use this zone as support and establish structure (the next higher low).
If this happens we can look to target higher toward major resistance levels and key fib levels.
Bearish Reversal into range - If we fail to see bullish conviction at the current zone it’s possible price action will fall back into the range. This is a likely scenario as we have seen price action bounce between 0.65800 and 0.65000 multiple times over the last month.
I wouldn’t recommend trading this scenario as I don’t like trading ranges but we could see price action head lower to 0.65000.
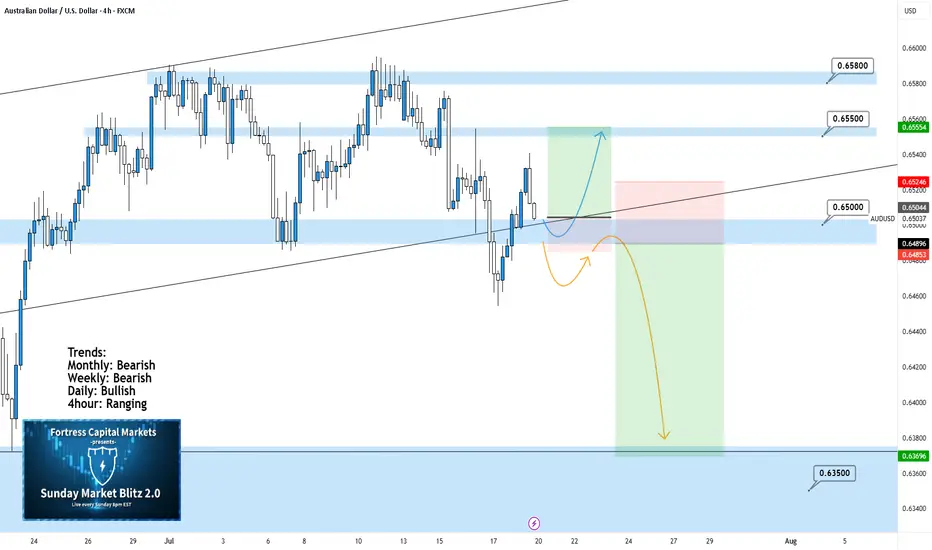
AUDUSD 4Hour TF - July 20th, 2025AUDUSD 7/20/2025
AUDUSD 4hour Neutral idea
Monthly - Bearish
Weekly - Bearish
Dailly - Bullish
4hour - Ranging
We’re looking at a fairly large range here on AU and although the higher timeframe suggests a potential bearish move, I am unsure until we have some clarity around 0.65000. Here are two scenarios that break down what could happen this week and how 0.65000 plays into it:
Range Continuation - Since late June we have seen price action establish this large range and stick to it (0.65800 Resistance & 0.65000 Support).
Currently, we can see price action attempting to break 0.65000 support but it has not done so yet. If we don’t break below 0.65000 early this week it is very likely we will see a rally into the top of the range.
Bearish Breakout - This is the setup we want to see play out this week as it presents a beauty of a trade.
For us to see AU as bearish on the 4hour we need to see a clear break below 0.65000 with a confirmed lower high below. If this happens look to target toward major support levels like 0.63500 area.
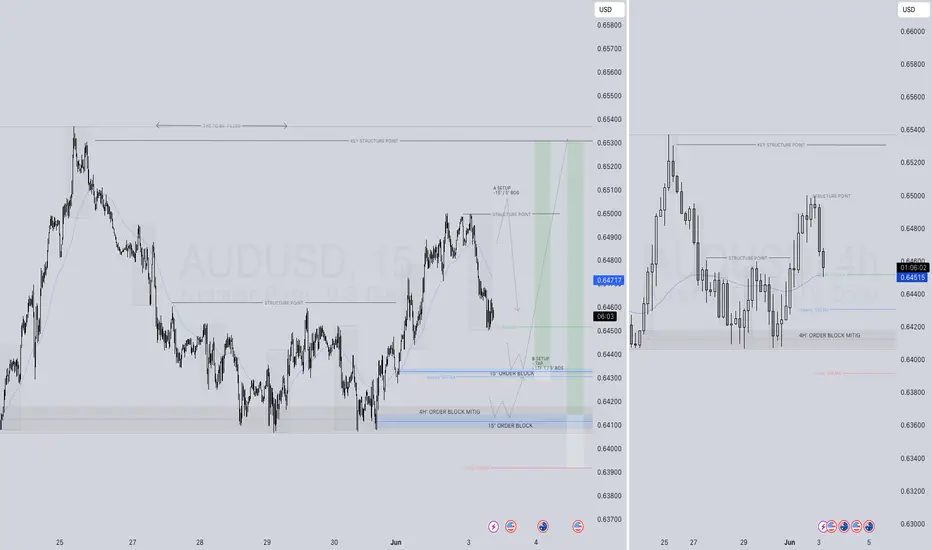
AUDUSD SHORT & LONG – WEEKLY FORECAST Q3 | W 29 | Y25💼 AUDUSD SHORT & LONG – WEEKLY FORECAST
Q3 | W 29 | Y25
📊 MARKET STRUCTURE OVERVIEW
AUDUSD is currently trading around a previously mitigated Daily and 4H Order Block zone.
Price has shown signs of short-term bearish momentum on lower timeframes (1H & 15m), but the broader structure still allows for bullish re-entries from deeper discounted levels.
We’re entering a key decision zone with potential for both short and long opportunities, depending on intraday confirmation.
🔍 Confluences to Watch 📝
✅ Daily OB – Previously Mitigated
Larger structure still holds room for bullish continuation if key internal supports hold.
✅ 4H OB – Mitigated with Initial Rejection
✅ 1H & 15m OBs – Valid for Intraday Shorts
Clean bearish structure on intraday timeframes.
Potential shorts available
📈 Risk Management Protocols
🔑 Core Principles
Risk per trade: Max 1%
Only act at planned levels — never chase
RR minimum: 1:2
Use scaling techniques on intraday shorts, and hold conviction for swings when structure confirms
🧠 Your risk plan is your protection. Without it, your strategy is meaningless.
🧠 Weekly FRGNT Insight
“Bias is flexible. Discipline is not.”
Adapt to what price gives — but never abandon your risk framework.
🏁 Final Thoughts from FRGNT
📌 Both short and long opportunities are valid this week.
📌 Choose your bias based on structure + confirmation.
📌 Let the order flow lead and risk management guide.
❤️ Stay sharp, stay structured. I’ll see you at the very top.
🎯 Trade consistent. FRGNT X

AUDUSD SHORT FORECAST Q3 D10 W28 Y25AUDUSD SHORT FORECAST Q3 D10 W28 Y25
Professional Risk Managers👋
Welcome back to another FRGNT chart update📈
Diving into some Forex setups using predominantly higher time frame order blocks alongside confirmation breaks of structure.
Let’s see what price action is telling us today! 👀
💡Here are some trade confluences📝
✅Daily Order block identified
✅4H Order Block identified
✅1H Order Block identified
🔑 Remember, to participate in trading comes always with a degree of risk, therefore as professional risk managers it remains vital that we stick to our risk management plan as well as our trading strategies.
📈The rest, we leave to the balance of probabilities.
💡Fail to plan. Plan to fail.
🏆It has always been that simple.
❤️Good luck with your trading journey, I shall see you at the very top.
🎯Trade consistent, FRGNT X

AUDUSD SHORT & LONG FORECAST Q3 W28 Y25AUDUSD SHORT & LONG FORECAST Q3 W28 Y25
Professional Risk Managers👋
Welcome back to another FRGNT chart update📈
Diving into some Forex setups using predominantly higher time frame order blocks alongside confirmation breaks of structure.
Let’s see what price action is telling us today! 👀
💡Here are some trade confluences📝
✅Daily Order block identified
✅4H Order Block identified
✅1H Order Block identified
🔑 Remember, to participate in trading comes always with a degree of risk, therefore as professional risk managers it remains vital that we stick to our risk management plan as well as our trading strategies.
📈The rest, we leave to the balance of probabilities.
💡Fail to plan. Plan to fail.
🏆It has always been that simple.
❤️Good luck with your trading journey, I shall see you at the very top.
🎯Trade consistent, FRGNT X

AUDUSD SHORT FORECAST Q2 W26 D27 Y25AUDUSD SHORT FORECAST Q2 W26 D27 Y25
Professional Risk Managers👋
Welcome back to another FRGNT chart update📈
Diving into some Forex setups using predominantly higher time frame order blocks alongside confirmation breaks of structure.
Let’s see what price action is telling us today!
💡Here are some trade confluences📝
✅Daily order block
✅1H Order block
✅Intraday breaks of structure
✅4H Order block
🔑 Remember, to participate in trading comes always with a degree of risk, therefore as professional risk managers it remains vital that we stick to our risk management plan as well as our trading strategies.
📈The rest, we leave to the balance of probabilities.
💡Fail to plan. Plan to fail.
🏆It has always been that simple.
❤️Good luck with your trading journey, I shall see you at the very top.
🎯Trade consistent, FRGNT X

AUDUSD LONG & SHORT FORECAST Q2 W25 D19 Y25AUDUSD LONG & SHORT FORECAST Q2 W25 D19 Y25
Professional Risk Managers👋
Welcome back to another FRGNT chart update📈
Diving into some Forex setups using predominantly higher time frame order blocks alongside intraday confirmation & breaks of structure.
Let’s see what price action is telling us today! 🔥
💡Here are some trade confluences📝
✅4H Order block identified
✅1H Order block identified
✅15’ order block
✅Intraday bullish breaks of structure
🔑 Remember, to participate in trading comes always with a degree of risk, therefore as professional risk managers it remains vital that we stick to our risk management plan as well as our trading strategies.
📈The rest, we leave to the balance of probabilities.
💡Fail to plan. Plan to fail.
🏆It has always been that simple.
❤️Good luck with your trading journey, I shall see you at the very top.
🎯Trade consistent, FRGNT X

AUDUSD LONG FORECAST Q2 W25 D16 Y25AUDUSD LONG FORECAST Q2 W25 D16 Y25
Professional Risk Managers👋
Welcome back to another FRGNT chart update📈
Diving into some Forex setups using predominantly higher time frame order blocks alongside intraday confirmation & breaks of structure.
Let’s see what price action is telling us today! 🔥
💡Here are some trade confluences📝
✅4H Order block identified
✅1H Order block identified
✅15’ order block
✅Intraday bullish breaks of structure
🔑 Remember, to participate in trading comes always with a degree of risk, therefore as professional risk managers it remains vital that we stick to our risk management plan as well as our trading strategies.
📈The rest, we leave to the balance of probabilities.
💡Fail to plan. Plan to fail.
🏆It has always been that simple.
❤️Good luck with your trading journey, I shall see you at the very top.
🎯Trade consistent, FRGNT X

AUDUSD LONG FORECAST Q2 W23 D3 Y25👀 AUDUSD LONG FORECAST Q2 W23 D3 Y25
Professional Risk Managers👋
Welcome back to another FRGNT chart update📈
Diving into some Forex setups using predominantly higher time frame order blocks alongside intraday confirmation & breaks of structure.
Let’s see what price action is telling us today! 🔥
💡Here are some trade confluences📝
✅Weekly 50 EMA
✅Daily 50 EMA
✅15’ order block
✅Intraday bullish breaks of structure
🔑 Remember, to participate in trading comes always with a degree of risk, therefore as professional risk managers it remains vital that we stick to our risk management plan as well as our trading strategies.
📈The rest, we leave to the balance of probabilities.
💡Fail to plan. Plan to fail.
🏆It has always been that simple.
❤️Good luck with your trading journey, I shall see you at the very top.
🎯Trade consistent, FRGNT X
AUDUSD LONG FORECAST Q2 W22 D29 Y25👀 AUDUSD LONG FORECAST Q2 W22 D29 Y25
Professional Risk Managers👋
Welcome back to another FRGNT chart update📈
Diving into some Forex setups using predominantly higher time frame order blocks alongside intraday confirmation & breaks of structure.
Let’s see what price action is telling us today! 🔥
💡Here are some trade confluences📝
✅Weekly 50 EMA
✅Daily 50 EMA
✅15’ order block
✅Intraday bullish breaks of structure
🔑 Remember, to participate in trading comes always with a degree of risk, therefore as professional risk managers it remains vital that we stick to our risk management plan as well as our trading strategies.
📈The rest, we leave to the balance of probabilities.
💡Fail to plan. Plan to fail.
🏆It has always been that simple.
❤️Good luck with your trading journey, I shall see you at the very top.
🎯Trade consistent, FRGNT X

CAUTION 50'EMA NOT ON SIDE AUDUSD SHORT FORECAST Q2 W21 D22 Y25CAUTION 50'EMA NOT ON SIDE AUDUSD SHORT FORECAST Q2 W21 D22 Y25
Professional Risk Managers👋
Welcome back to another FRGNT chart update📈
Diving into some Forex setups using predominantly higher time frame order blocks alongside confirmation breaks of structure.
Let’s see what price action is telling us today!
💡Here are some trade confluences📝
✅4H Order Block
✅Tokyo ranges to be filled
✅15' order block identified
✅Weekly 50 EMA forecasting rejection
✅Daily 50 EMA target
🔑 Remember, to participate in trading comes always with a degree of risk, therefore as professional risk managers it remains vital that we stick to our risk management plan as well as our trading strategies.
📈The rest, we leave to the balance of probabilities.
💡Fail to plan. Plan to fail.
🏆It has always been that simple.
❤️Good luck with your trading journey, I shall see you at the very top.
🎯Trade consistent, FRGNT X

AngloGold Ashanti $AU: A Hidden Goldmine or High-Risk Play? AngloGold Ashanti ( NYSE:AU ): A Hidden Goldmine or High-Risk Play? 🏅🔍
1/10
AngloGold Ashanti NYSE:AU shows 6% annual revenue growth but faces a tough challenge—earnings have been declining at -35.8% per year! Industry earnings are up 10.9%, leaving AngloGold behind. 📉 Can they turn things around?
2/10
Major shakeup: NYSE:AU is acquiring Egypt’s largest gold miner, Centamin, in a $2.5 billion deal. This could reshape their future production and reserves. 🚨 Bold move or financial strain?
3/10
Asset sales are also in play! AngloGold is fielding bids for the Tropicana gold mine in Australia. A strategic move to streamline operations—or desperation for cash flow? 🏗️
4/10
Analysts have set a target price of $31.75, hinting at upside potential from the current price. Yet NYSE:AU ’s ROE of 3.4% and net margins of 2.3% lag behind peers. 📊 Is the stock undervalued or stuck in a profit rut?
5/10
Operational risks loom large. AngloGold operates across Africa and South America, exposing it to geopolitical instability, regulatory shifts, and potential disruptions. 🌍 How stable are these gold mines?
6/10
Strengths: AngloGold has diversified operations across multiple continents and a strong asset base. That reduces over-dependence on any one region. 🗺️ Diversity is their defensive edge.
7/10
Weaknesses: Declining earnings are a red flag for investors. High operational costs further squeeze profitability. 💸 Can NYSE:AU control expenses while scaling up production?
8/10
Opportunities: The Centamin acquisition could supercharge their gold production. Meanwhile, asset sales might optimize their portfolio by shedding low-margin operations. 🏆 Growth through smarter assets?
9/10
Threats: Volatile gold prices remain a double-edged sword. Plus, political risks in key regions like Africa can disrupt mining operations. ⚠️ Can AngloGold weather these external shocks?
10/10
Your turn! Is AngloGold Ashanti NYSE:AU a buy, hold, or avoid? Vote now! 🗳️
Golden buy opportunity 🏆
Hold for now 🔄
Too risky, avoid ⚠️

AU Index Rallies from Demand Area as Bullish Sentiment GrowsThe AU Index experienced a significant development yesterday as it reached a key demand area, showing a strong rejection today that indicates potential bullish momentum. This demand zone, identified through technical analysis, has historically served as a pivotal point for price action, suggesting an opportunity for a price turnaround. With the opening candle reflecting a robust rejection of lower levels, traders are increasingly optimistic about the possibility of a bullish trend emerging in the coming months.
From a technical standpoint, this demand area presents a solid foundation for potential upward movement. The absence of follow-through selling and the strength of the rejection signal that buyers are stepping in to support the price. When coupled with historical seasonality patterns, which indicate a likelihood of gains during this period, there is a compelling case for a bullish outlook on the AU Index. Historical trends suggest that this time frame has often led to price rallies, providing further confirmation for those considering long positions.
On the fundamental side, the insights from the Commitment of Traders (COT) report paint an interesting picture. While retail traders are predominantly bearish, indicating a cautious sentiment among the broader market participants, the smart money narrative tells a different story. Institutional investors appear to be either bullish or in the early stages of building long positions, which can be a telling signal for future price action. This divergence between retail bearishness and institutional buying often creates an environment ripe for a market reversal, particularly as the smart money tends to lead rather than follow market trends.
Given these dynamics, traders are now on the lookout for a long setup on the AU Index. Emphasizing risk management and entry strategies will be essential in this endeavor. With the price showing resilience at the demand area and fundamental signals suggesting a shift towards bullishness, there is a growing confidence that the AU Index may be poised for a sustained rally.
In conclusion, the confluence of technical indicators, seasonal patterns, and the contrasting sentiments present in the COT report presents an enticing opportunity in the AU Index. As traders position themselves for potential gains, the next few sessions will be crucial in determining whether this demand area will indeed act as a launchpad for a bullish trend in the months ahead. Investors will be closely monitoring price movements, looking for confirmation to validate their long strategies in what could be an exciting period for this index.
✅ Please share your thoughts about AU in the comments section below and HIT LIKE if you appreciate my analysis. Don't forget to FOLLOW ME; you will help us a lot with this small contribution.

AUD/USD Reaches Key Supply Area, possible ReversalThe AUD/USD pair has reached our identified supply area, coinciding with the start of the London session. A rejection candle has formed, signaling a potential reversal, with the spike briefly hitting 0.6872 before pulling back. This price action suggests that sellers are stepping in at this level, creating a possible reversal opportunity.
Traders are now watching closely for further confirmation of a bearish move. Today, the US CB Consumer Confidence report is set to be released, and this key economic indicator could provide additional momentum for the US Dollar. A stronger-than-expected reading may further bolster the USD, potentially driving the AUD/USD lower and continuing its downward trajectory.
With the market's focus on the upcoming US data, we remain poised for a potential short setup in anticipation of a reversal in the AUD/USD pair. Traders should keep a close eye on both the technical patterns and the economic news to confirm entry points.
✅ Please share your thoughts about AUD/USD in the comments section below and 👍 HIT LIKE if you appreciate my analysis. Don't forget to FOLLOW ME; you will help us a lot with this small contribution.

AUDUSD 0.67582 -0.09% SHORT MULTI TIME-FRAME ANALYSIS + DXYHELLO TRADERS
Hope everyone is doing great
📌 A look at The AUDUSD At the close of ASIA GOING INTO THE LONDON, TO NY PM SESSION
* With a bullish run into Monday CLOSE ( PO3) today will be looking for some retracement.
* looking at the daily last week Friday failed to take high which is a sign of weakness on AU alike with EU & GU.
* Looking at the +FVG below as targets as well.
* on the 4H looking for a bullish open to take ASIA high LQ.
* PO3
* Push higher before going for lower structures.
* AU sweeping the ASIA HIGH.
* Looking for an AGGRESIVE MOVE back into the range.
* this where I would look for entries short.
* Looking for the take of that ERL.
* with two possible OTE ( ASIA HIGHS, AND LONG TERM HIGH) , EXECUTION IS BASED ON RR & RISK MANAGEMENT.
* DXY 4H
- Will wait for the DXY to take ASIA lows and trade back in the range as a confirmation as well...
* BASED on the price action served next session...
* We will see what does the market dish.
🤷♂️😉🐻📉🐮📈
HOPE YOU ENJOYED THIS OUT LOOK, SHARE YOUR PLAN BELOW,🚀 & LETS TAKE SOME WINS THIS WEEK.
SEE YOU ON THE CHARTS.
IF THIS IDEA ASSISTS IN ANY WAY OR IF YOU ENJOYED THIS ONE
SMASH THAT 🚀 & LEAVE A COMMENT.
ALWAYS APPRECIATED
____________________________________________________________________________________________________________________
Kindly follow your entry rules on entries & stops. |* Some of The idea's may be predictive yet are not financial advice or signals. | *Trading plans can change at anytime reactive to the market. | * Many stars must align with the plan before executing the trade, kindly follow your rules & RISK MANAGEMENT.
_____________________________________________________________________________________________________________________
|
* ENTRY & SL -KINDLY FOLLOW YOUR RULES | * RISK-MANAGEMENT | *PERIOD - I TAKE MY TRADES ON A INTRA DAY SESSIONS BASIS THIS IS NOT FINACIAL ADVICE TO EXCECUTE ❤
LOVELY TRADING WEEK TO YOU!

Potential moves for AUJust noticed this 3 top formation on AU, that could indicates sign of reversal.
Gonna keep an eye . Will be waiting for formation of new LL and LH before taking short position if it plays out.
Let's see what today brings
These are my views

Gold long oportunity on 15mGold in 15m sweeped its ENG liquidity and made a sub-minor ChoCh , also Gold sweeped previouse day candle's low , so I expect it rise to see major structure's high at 2531.765 .
This is not a financial advice and its just my own oponion, DYOR.
