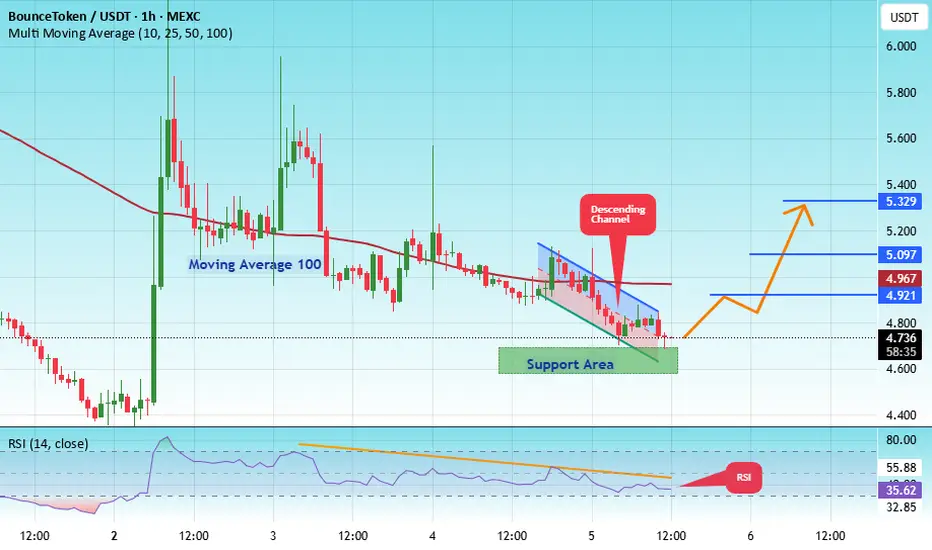
#AUCTION/USDT — Major Accumulation or Bearish Continuation?#AUCTION
The price is moving within a descending channel on the hourly timeframe. It has reached the lower boundary and is heading towards a breakout, with a retest of the upper boundary expected.
The Relative Strength Index (RSI) is showing a downward trend, approaching the lower boundary, and an upward bounce is anticipated.
There is a key support zone in green at 4.60, and the price has bounced from this level several times. Another bounce is expected.
The indicator is showing a trend towards consolidation above the 100-period moving average, which we are approaching, supporting the upward move.
Entry Price: 4.70
First Target: 4.92
Second Target: 5.10
Third Target: 5.33
Stop Loss: Below the green support zone.
Remember this simple thing: Money management.
For any questions, please leave a comment.
Thank you.
Auction
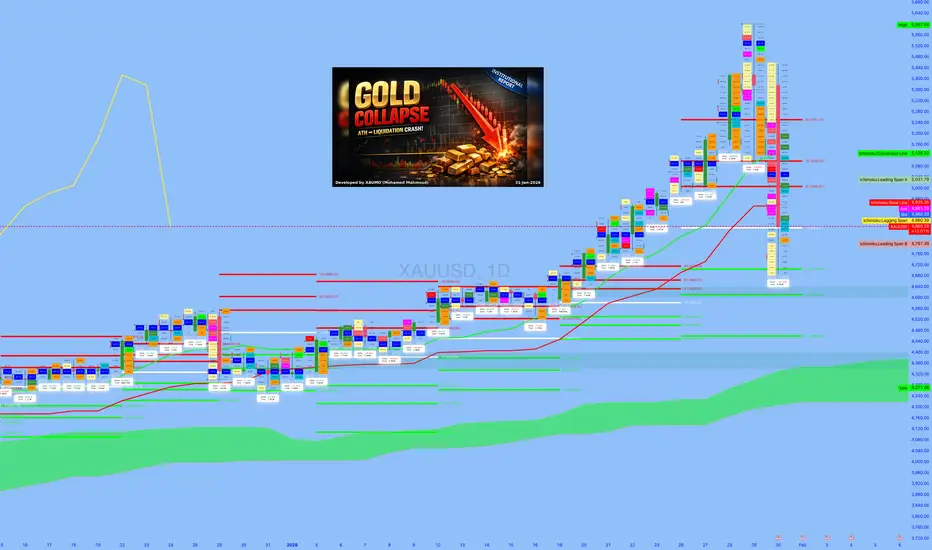
GOLD COLLAPSE
Instrument: XAUUSD (Gold) | Date: 31-Jan-2026
Context: ATH impulse → Friday liquidation → post-break value migration
Inputs: Your 15m / 1H / 4H / 1D / 1W / 1M charts + FRVP/FVRP map + volume footprint
EDUCATIONAL ONLY — Not financial advice — Not trade signals.
══════════════════════════════════════════════════════════════════════
1) EXECUTIVE SYNTHESIS (WHAT WE CONCLUDED THIS SESSION)
• Gold printed an ATH shelf around 5595–5597 (weekly/monthly high marker) then
collapsed violently on Friday into the ~4860 region (your screen’s bid/ask zone).
• This sequence is structurally consistent with “blow-off → distribution → forced unwind.”
The key is NOT the candle shape; it’s the auction migration: value left the upper
acceptance band and rotated down into a new lower composite balance.
• FRVP/FVRP inference from your rails: the market is transitioning from the 51xx–55xx
distribution inventory into a 49xx–48xx composite value area. This implies:
(A) upside bounces face heavy overhead supply until acceptance reclaims key rails,
(B) downside becomes controlled by the decision rail cluster 4804/4771 and the
hard-defense band 4712–4686.
2) AUCTION LOGIC: ATH → COLLAPSE = VALUE MIGRATION (NOT RANDOM VOLATILITY)
• Upper distribution completed at/near ATH: late-stage extension produced “fresh
inventory” (late longs, momentum funds, options hedging), which is vulnerable to a
regime shock (USD/rates).
• Liquidation cascade mechanics:
- Break prior HVN/POC supports → accelerate through LVNs (thin participation zones)
- Find the next HVN/value shelf → stabilize → rotate (balancing/accumulation pocket)
3) FRVP/FVRP MAP (DISTILLED FROM YOUR WEEKLY/MONTHLY/DAILY/4H RAILS)
A) Overhead Supply / Repair Ceilings (resistance ladder)
R1: 4922–4923 (macro + LTF sell rail confluence)
R2: 4944–4948 (local highs / immediate overhead)
R3: 4992–4996 (monthly “repair ceiling” / acceptance test)
R4: 5047–5048 (weekly breakdown rail; reclaim changes regime)
R5: 5108 → 5255 (prior weekly acceptance band; heavy inventory)
R6: 5563 → 5595–5597 (late-stage cap / ATH shelf; only after full repair)
B) Active Supports / Defense Pools (downside ladder)
S1: 4866–4855 (sweep/reject absorption pocket)
S2: 4816–4796 (LTF buy rails / local low zone)
S3: 4804–4771 (monthly breakdown + decision rail)
S4: 4712–4686 (4H hard support band / next “must-hold” if balance fails)
S5: 4617–4606 (liquidation shelf / last line before daily demand)
S6: 4509–4495 (daily demand shelf; larger repair base if reached)
S7: 4358 (deep daily rail; tail support before weekly 39xx zone)
4) VOLUME FOOTPRINT TAKEAWAYS (WHY FRIDAY LOOKED LIKE THAT)
• The down leg displayed characteristics of “initiative selling” (urgent liquidation):
stacked sell imbalances and fast travel through low-acceptance zones.
• The stabilization zone near 4866/4855 printed “sweep + reject” signatures:
- Sweep = liquidity run through resting bids/stops
- Reject = close/reclaim back above the swept level
Institutional read: responsive buying/absorption (not the same as trend reversal).
• Conclusion: market likely moved into “balancing/accumulation pocket” at lower value,
while overhead inventory remains dominant until proven otherwise via acceptance.
5) KEY TECHNICAL DECISION POINT (NEXT 1–3 WEEKS)
• The session’s primary “decision rail” is the 4804/4771 cluster.
- Hold above it: repair-range probability increases (auction rotates, builds value).
- Accept below it: continuation liquidation becomes dominant (4712–4686 → 4606 → 4509).
6) WHAT DROVE THE ATH IMPULSE (LAST WEEK’S STACKED RISK PREMIUM)
We framed the ATH week as a multi-driver stack rather than a single data print:
A) Safe-haven rush + geopolitical premium
• Risk headlines and uncertainty created a “fear bid,” reinforcing gold’s role as a hedge.
B) “Debasement / policy independence” narrative + USD softness (pre-Friday)
• Market discourse leaned toward hedging USD credibility and policy unpredictability,
which historically increases gold’s convexity to negative headlines.
C) Positioning and momentum mechanics (microstructure fuel)
• Once successive psychological/technical levels broke, flows can shift from “allocation”
into “forced chase”: trend-following, vol-control, and options gamma hedging amplify
upside in a grind. This sets up fragility: when the regime flips, exits become crowded.
7) WHY IT COLLAPSED ON FRIDAY (REGIME FLIP → USD + REAL-RATE REPRICING)
• Session conclusion: the Friday collapse was driven by a market regime shock to the
rates/credibility narrative (Fed leadership succession storyline). Mechanism:
- USD strengthened and rate expectations repriced → gold de-levered rapidly.
• Structural point: after ATH, the market holds maximum “wrong-way inventory,” so a USD
spike can trigger forced selling, accelerating drops through LVNs until the next HVN.
8) CROSS-ASSET TRANSMISSION MAP (CONFIRMATION BOARD)
A) USD (DXY proxy)
• Primary lever: strong USD bid = headwind for gold; gold rallies tend to fail at repair
ceilings when USD is persistently rising.
B) Rates (nominal + real yield expectations)
• Higher real-rate expectations compress gold’s multiple; lower real-rate expectations
tend to support gold. The Friday tape behaved like a “real-rate/credibility shock.”
C) Equities (SPX/NDX) + Vol (VIX)
• When “USD up + rates up” drives the tape, both duration assets and gold can fall.
• Gold trends best in “risk-off with USD down” (confidence shock / debasement regime).
• “Risk-off with USD up” often yields choppy gold (spike then fade), not a clean trend.
D) Metals beta (silver)
• Silver behaves as high-beta precious metals positioning; it can confirm crowding and
the violence of the unwind when the trade reverses.
9) GEO-MACRO THEMES DISCUSSED (THEATERS AS GOLD RISK-PREMIUM CONTRIBUTORS)
We structured geopolitics as “theater → transmission → gold levels”:
• Arctic/Greenland/Europe reliability: functions as alliance reliability premium and trade
spillover risk; supportive when it weakens confidence/predictability.
• Russia/Ukraine/energy: inflation uncertainty + Europe growth risk can support gold,
but can also create a two-way response if it raises rates/real yields.
• Israel/Iran: classic war-risk premium; may produce spikes that fade if USD bid dominates.
• China/Taiwan + Asia physical: viewed as structural “floor builder” over time; does not
prevent drawdowns but increases odds of absorption at major value shelves.
• Venezuela/LatAm: typically a tail cluster amplifier; rarely a solo trend driver, but it
stacks into the broader risk premium when USD credibility is in question.
10) 3-MONTH OUTLOOK (FEB–APR 2026): INSTITUTIONAL SCENARIO TREE
A) Scenario A — BASE CASE “RE-AUCTION / REPAIR RANGE” (highest probability)
• Thesis: post-liquidation balance forms. Price oscillates between a lower floor band
(4804/4771 into 4712) and a repair ceiling band (4995 into 5048).
• Path: defend absorption pocket → probe resistances → accept/reject decides speed.
• Confirmation: sustained acceptance above 4995, then above 5048.
B) Scenario B — BULL CASE “V-SHAPE RECLAIM” (lower probability)
• Thesis: Friday was capitulation; absorption expands; shorts trapped.
• Requirements:
1) Hold above 4804/4771 (no sustained value acceptance below)
2) Quick reclaim of 4923 then 4995
3) Break/accept 5048 (weekly reclaim)
• Targets: 5108 → 5232 → 5307/5374 (ATH shelf only after multi-week repair).
C) Scenario C — BEAR CASE “VALUE BREAKDOWN CONTINUATION” (meaningful risk)
• Thesis: bounce is mainly short-covering; sellers reassert at 4923/4995.
• Sequence: failure at resistances → break 4804 → accept below 4771 → 4712/4686 →
4606 → daily demand 4509/4495 (tail 4358 if macro compounds).
11) US GOVERNANCE SHOCK SECTION (ORGANIZED BY SEVERITY ON GOLD)
We added a dedicated governance chapter requested by you, ranked by probability of
forcing a USD/rates regime shift (the most gold-relevant mechanism):
Severity 1 (Highest): FED SUCCESSION / POWELL FIASCO (Powell → Warsh narrative)
• Direct channel: USD + real-rate expectations repricing → immediate gold repricing.
• Technical link:
- Bull repair requires acceptance above 5066 then 5137/5232.
- Bear continuation opens if 4909 fails → 4795 → 4741/4713 → 4668 → 4606/4509.
Severity 2 (High): GOVERNMENT CLOSURE / FUNDING PARALYSIS
• Can raise volatility and growth risk; gold response depends on whether USD becomes the
liquidity refuge. Best gold regime is shutdown stress that weakens USD credibility or
pulls real-rate expectations down.
Severity 3 (Medium): ICE / MINNESOTA CIVIC INSTABILITY CLUSTER
• Usually a “legitimacy premium” that fades unless it escalates into sustained paralysis.
• Cross-asset signature matters:
- Vol up + yields down + USD not surging = gold supportive.
- Vol up + USD up + yields up = choppy (spike/fade).
Severity 4 (Low→Medium): EPSTEIN FILES RELEASE
• Typically narrative/trust shock only; becomes gold-relevant only if it catalyzes legal/
political paralysis that feeds into shutdown risk or broader legitimacy crisis.
12) EXECUTION PLAYBOOK (HOW WE SAID TO TRADE THIS LIKE A DESK)
Rule 1: Don’t trade the headline. Trade the regime.
• Regime = USD direction + real-rate direction + risk/volatility state.
Rule 2: Upside is not “real” until acceptance reclaims the repair rails.
• First: 4923 then 4995 acceptance; structural change only after 5048 reclaim.
Rule 3: Downside is not “real” until breakdown rails break AND fail retest.
• Key: 4804/4771; if accepted below, the next auction targets 4712/4686 then 4606.
Rule 4: Use footprint confirmation:
• Bottoming = aggressive sell delta + price stops going down (absorption) + reclaim LVN.
• Topping = aggressive buy delta + price stops going up (distribution) + breakdown HVN.
13) “WHAT TO WATCH NEXT” CHECKLIST (NEXT WEEK)
• Does the 4866/4855 pocket keep printing “sweep → reclaim → hold”?
If yes: stabilization/balance is real.
• Do rallies repeatedly fail at 4922/4923 or 4995?
If yes: overhead supply remains dominant; range/mean-reversion favored.
• Most important: 4804/4771 decision rail behavior.
Hold above = repair; accept below = continuation to 4712/4686 → 4606 → 4509/4495.
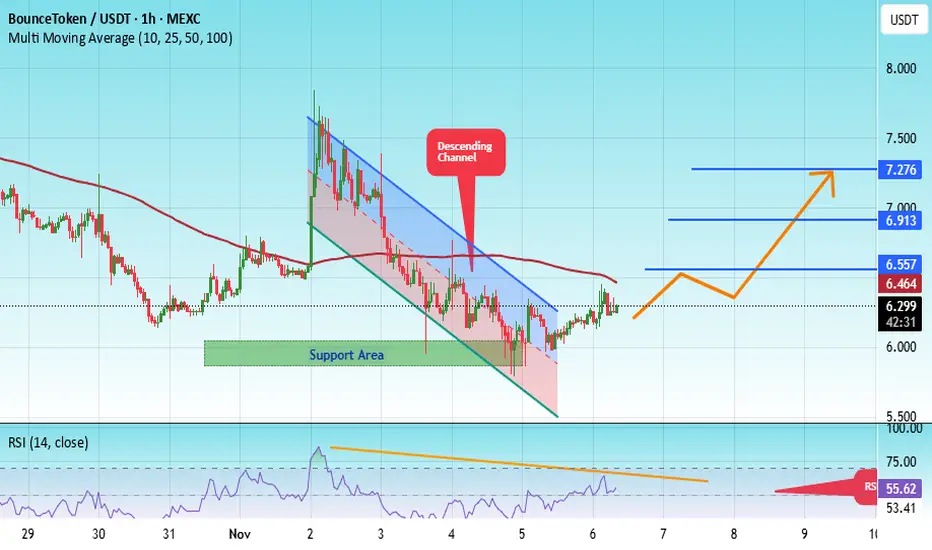
#AUCTION/USDT — Major Accumulation or Bearish Continuation?#AUCTION
The price is moving within an ascending channel on the 1-hour timeframe and is adhering to it well. It is poised to break out strongly and retest the channel.
We have a downtrend line on the RSI indicator that is about to break and retest, which supports the upward move.
There is a key support zone in green at the 6.00 price level, representing a strong support point.
We have a trend of consolidation above the 100-period moving average.
Entry price: 6.28
First target: 6.54
Second target: 6.91
Third target: 7.27
Don't forget a simple money management rule:
Place your stop-loss order below the green support zone.
Once you reach the first target, save some money and then change your stop-loss order to an entry order.
For any questions, please leave a comment.
Thank you.
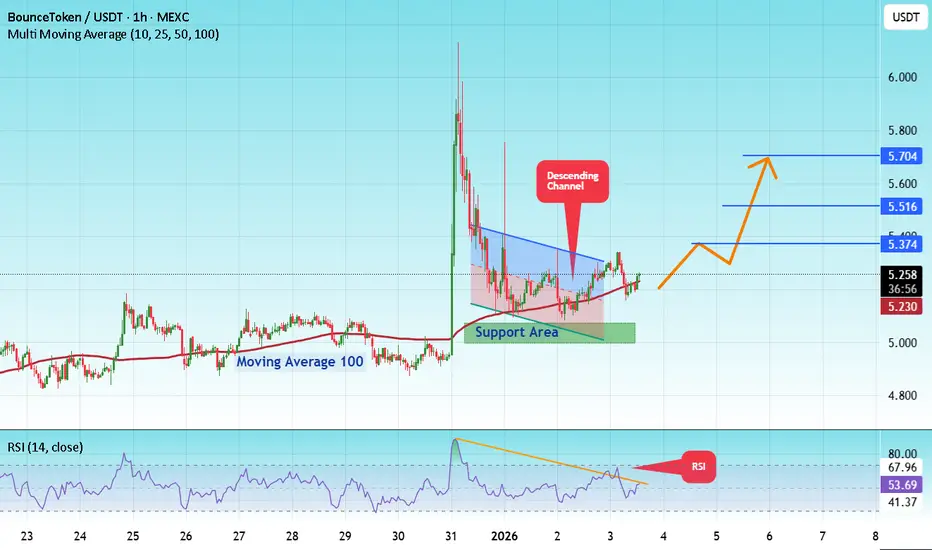
#AUCTION/USDT — Major Accumulation or Bearish Continuation?#AUCTION
The price is moving in a descending channel on the 1-hour timeframe. It has reached the lower boundary and is heading towards a breakout, with a retest of the upper boundary expected.
We are seeing a bearish trend in the Relative Strength Index (RSI), which has reached near the lower boundary, and an upward bounce is expected.
There is a key support zone in green at 5.00, and the price has bounced from this level several times. Another bounce is expected.
We are seeing a trend towards stabilizing above the 100-period moving average, which we are approaching, supporting the upward trend.
Entry Price: 5.25
First Target: 5.37
Second Target: 5.51
Third Target: 5.70
Place your stop-loss order below the green support zone.
Remember a simple principle: Money Management.
For any questions, please leave a comment.
Thank you.
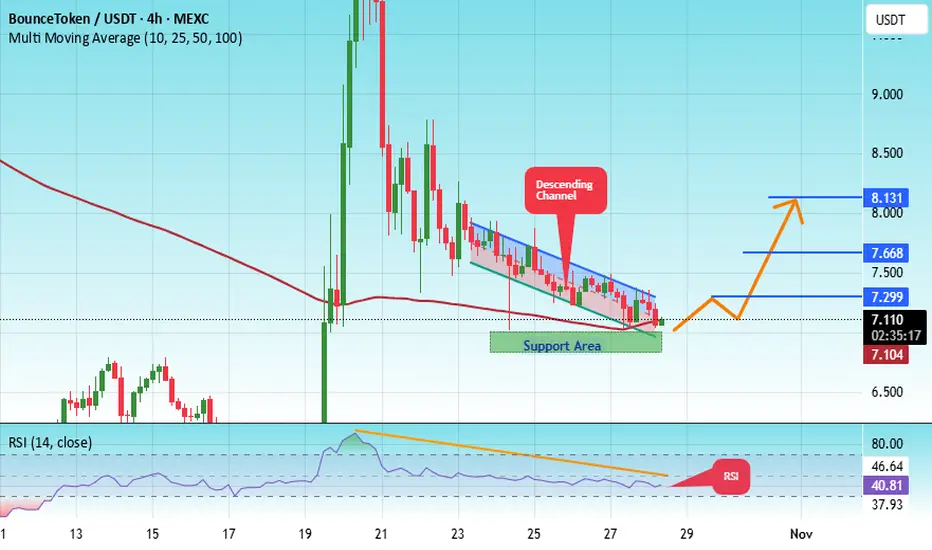
#AUCTION/USDT — Major Accumulation or Bearish Continuation?#AUCTION
The price is moving in an ascending channel on the 1-hour frame, adhering well to it, and is heading for a strong breakout and retest.
We have a bearish trend on the RSI indicator that is about to be broken and retested, which supports the upward breakout.
There is a major support area in green at 6.90, representing a strong support point.
We are heading for consolidation above the 100 moving average.
Entry price: 7.11
First target: 7.30
Second target: 7.66
Third target: 8.11
Don't forget a simple matter: capital management.
When you reach the first target, save some money and then change your stop-loss order to an entry order.
For inquiries, please leave a comment.
Thank you.
AUCTION- BULL RETEST?? Following my yesterday's outlook, #AUCTION could start to pump back here in case of real breakout & retest HTF 📈
Solid demand zone, juicy buy volume 📈
Cautious with huge volatility. #DYOR

AUCTIONUSDT Forming Falling WedgeAUCTIONUSDT is currently forming a falling wedge pattern, one of the most reliable bullish reversal structures in technical analysis. This setup often indicates that the bearish momentum is fading and that a potential breakout to the upside could be imminent. The price action has been consolidating tightly within the wedge, suggesting that sellers are losing strength while buyers are gradually stepping in. With good trading volume supporting the structure, a breakout above the resistance line could trigger a strong upward rally.
The falling wedge formation typically marks the end of a downtrend and the beginning of a bullish phase. In AUCTIONUSDT’s case, the technical indicators are aligning favorably — RSI is approaching neutral territory, and moving averages are starting to flatten, signaling a potential trend reversal. Once the breakout confirmation occurs, traders could expect a substantial upside move with an anticipated gain between 90% and 100%+, driven by renewed market optimism and increased buying momentum.
Investor interest in AUCTIONUSDT has been picking up recently, reflecting a growing belief in the project’s long-term potential. This surge in sentiment often acts as fuel for the next major leg up, as new capital flows into the market. If volume continues to rise alongside price, it will further validate the bullish breakout and establish stronger technical support zones for sustained growth.
✅ Show your support by hitting the like button and
✅ Leaving a comment below! (What is You opinion about this Coin)
Your feedback and engagement keep me inspired to share more insightful market analysis with you!

AUCTIONUSDT UPDATE#AUCTION
UPDATE
AUCTION Technical Setup
Pattern: Bullish falling wedge breakout
Current Price: $10.26
Target Price: $17.64
Target % Gain: 80.84%
$AUCTION has confirmed a strong breakout from a bullish falling wedge pattern on the 1D timeframe. With the current price at $10.26, the next potential target is around $17.64, indicating an upside of nearly 81%. This breakout signals strong bullish momentum and could mark the start of a significant trend reversal.
Time Frame: 1D
Risk Management Tip: Always use proper risk management.

AUCTION/USDT — Major Accumulation or Bearish Continuation?🔎 Overview
The AUCTION/USDT pair is currently moving sideways within the critical demand zone of $7.02 – $9.55 (yellow box). This area has acted as a strong accumulation level since July, serving as the last line of defense for buyers before potential continuation to the downside.
The mid-term structure remains bearish, as price continues to print lower highs since the peak at $51.59. However, this prolonged consolidation opens the possibility of forming a strong base for a reversal, should buyers hold this key zone.
---
🧩 Price Structure & Pattern
Main Trend (1D): Bearish → consistent lower highs from the ATH.
Current Pattern: Sideways within demand zone. Potential formation of an Accumulation Base or Double Bottom (W pattern) if a bullish breakout occurs.
Key Support: $9.55 → $7.02 (demand zone).
Step-by-Step Resistances: $11.736 → $14.131 → $16.263.
Major Resistance: $26.068 (psychological level & strong supply).
---
📈 Bullish Scenario
If price holds the demand zone and breaks above $11.736, upside targets become more realistic:
First target: $11.736 (minor resistance).
Second target: $14.131.
Third target: $16.263 (major barrier and liquidity zone).
With strong momentum + volume, retest towards $26.068 becomes possible.
👉 Bullish confirmation = daily close above $11.736 with volume expansion.
👉 Entry ideas:
Spot accumulation in the $7.0–$9.5 range with a stop below $7.0.
Breakout entry above $11.7 after retest confirmation.
---
📉 Bearish Scenario
If buyers fail to defend the zone, especially on a daily close below $7.02, the selling pressure could accelerate:
Possible continuation into lower liquidity areas ($6.4 – $5.5 range).
Breakdown from this base may trigger panic selling, as long-term demand zones often lead to sharp moves when invalidated.
👉 Bearish confirmation = daily close below $7.02.
👉 Entry idea: Short after confirmed breakdown and failed retest of the demand zone.
---
⚖️ Key Notes & Risk Management
The $7.0 – $9.5 zone is the battlefield between bulls and bears. As long as it holds, reversal potential remains.
Breakdown = bearish bias takes over.
Risk management:
For longs → stop below $7.0.
For shorts → stop above $9.5 (if breakdown is valid).
Beware of false breaks — always wait for daily close confirmation.
---
📝 Conclusion
AUCTION is at a make-or-break level. Will the $7.0–$9.5 demand zone become the foundation for a bullish reversal towards $11.7 → $14.1 → $16.2, or will it collapse into a bearish continuation towards deeper lows?
➡️ Patience is key — wait for confirmation before committing.
➡️ This zone will decide the next major direction for AUCTION in the coming weeks.
#AUCTION #AUCTIONUSDT #CryptoAnalysis #AltcoinSetup #PriceAction #SupportResistance #BreakoutOrBreakdown #CryptoTA #SwingTrade

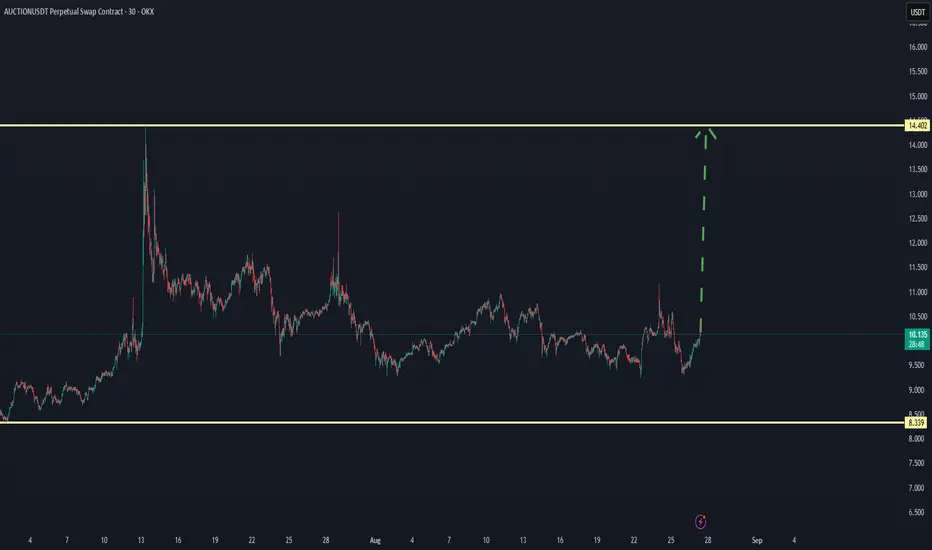
AUCTION CAN SEE A SHOT TREND TO UP $14 by confirmationAUCTION CAN SEE A SHOT TREND TO UP $14 by confirmation
AUCTION/USDT one of the coins that shows a pre-increase ( checking if it can get proof next hours). When this gets confirmed, there is a high chance ofa breakout.
When new updates coming will add here below at this chart.
#AUCTION/USDT#AUCTION
The price is moving within an ascending channel on the 1-hour frame, adhering well to it, and is on track to break it strongly upwards and retest it.
We have support from the lower boundary of the ascending channel, at 9.09.
We have a downtrend on the RSI indicator that is about to break and retest, supporting the upside.
There is a major support area in green at 8.80, which represents a strong basis for the upside.
Don't forget a simple thing: ease and capital.
When you reach the first target, save some money and then change your stop-loss order to an entry order.
For inquiries, please leave a comment.
We have a trend to hold above the 100 Moving Average.
Entry price: 9.89.
First target: 10.30.
Second target: 10.94.
Third target: 11.68.
Don't forget a simple thing: ease and capital.
When you reach your first target, save some money and then change your stop-loss order to an entry order.
For inquiries, please leave a comment.
Thank you.

#AUCTION/USDT ready to pump ?#AUCTION
The price is moving within a descending channel on the 1-hour frame, adhering well to it, and is on its way to breaking it strongly upwards and retesting it.
We have a bounce from the lower boundary of the descending channel. This support is at 10.68.
We have a downtrend on the RSI indicator that is about to be broken and retested, supporting the upside.
There is a major support area in green at 10.31, which represents a strong basis for the upside.
Don't forget a simple thing: ease and capital.
When you reach the first target, save some money and then change your stop-loss order to an entry order.
For inquiries, please leave a comment.
We have a trend to hold above the 100 Moving Average.
Entry price: 11.25
First target: 11.60
Second target: 12.00
Third target: 12.51
Don't forget a simple thing: ease and capital.
When you reach the first target, save some money and then change your stop-loss order to an entry order.
For inquiries, please leave a comment.
Thank you.

#AUCTION/USDT#AUCTION
The price is moving within a descending channel on the 1-hour frame, adhering well to it, and is heading for a strong breakout and retest.
We are experiencing a rebound from the lower boundary of the descending channel, which is support at 11.40.
We are experiencing a downtrend on the RSI indicator that is about to be broken and retested, supporting the upward trend.
We are looking for stability above the 100 Moving Average.
Entry price: 11.92
First target: 12.21
Second target: 12.53
Third target: 12.86

#AUCTION/USDT#AUCTION
The price is moving within a descending channel on the 1-hour frame, adhering well to it, and is heading towards a strong breakout and retest.
We are experiencing a rebound from the lower boundary of the descending channel, which is support at 10.73.
We are experiencing a downtrend on the RSI indicator, which is about to break and retest, supporting the upward trend.
We are heading towards stability above the 100 Moving Average.
Entry price: 10.82
First target: 10.86
Second target: 11.02
Third target: 11.14

ES - LONG @ London OpenBuyers from 6000 options level, floor. We've got weak liq. above to squeeze. After London open FIND on smaller timeframes the auction/finished business (risk) and test of pivot/poc (entry)

#AUCTION/USDT#AUCTION
The price is moving within a descending channel on the 1-hour frame, adhering well to it, and is heading for a strong breakout and retest.
We are seeing a bounce from the lower boundary of the descending channel, which is support at 11.26.
We have a downtrend on the RSI indicator that is about to be broken and retested, supporting the upward trend.
We are looking for stability above the 100 Moving Average.
Entry price: 11.50
First target: 11.81
Second target: 12.26
Third target: 12.84

#AUCTION/USDT#AUCTION
The price is moving within a descending channel on the 1-hour frame, adhering well to it, and is heading for a strong breakout and retest.
We are experiencing a rebound from the lower boundary of the descending channel, which is support at 11.15.
We are experiencing a downtrend on the RSI indicator that is about to break and retest, supporting the upward trend.
We are looking for stability above the 100 moving average.
Entry price: 11.22
First target: 11.37
Second target: 11.53
Third target: 11.74

#AUCTION/USDT#AUCTION
The price is moving within a descending channel on the 1-hour frame, adhering well to it, and is heading for a strong breakout and retest.
We are seeing a bounce from the lower boundary of the descending channel, which is support at 11.72.
We have a downtrend on the RSI indicator that is about to be broken and retested, supporting the upward trend.
We are looking for stability above the 100 Moving Average.
Entry price: 12.00
First target: 12.45
Second target: 12.83
Third target: 13.26

AUCTIONUSDT | Spot Swing Accumulation Play
🔹 Entry Zones & Allocation :
🥉$10 – $11 (Momentum: 25% if strength confirms)
🥈$8 – $9 (Light: 25%)
🥇$6 – $7 (Main Bid: 50%)
🔹 Targets :
TP1: $18
TP2: $24
TP3: $30+
‼️ Stop : $4.90 (Breakdown invalidation)
🧠 Bias : Weekly demand active. Eyes on BTC behavior — if it sweeps $70K or lower, deeper bid zone activates. Scaling spot only — mid-cycle narrative in play.

AUCTIONUSDT 1WAUCTION ~ 1W Analysis
#AUCTION Buy back when testing this support with a short -term target of at least 20%+.

#AUCTION/USDT#AUCTION
The price is moving within a descending channel on the 1-hour frame, adhering well to it, and is heading for a strong breakout and retest.
We are seeing a bounce from the lower boundary of the descending channel, which is support at 11.80.
We have a downtrend on the RSI indicator that is about to be broken and retested, supporting the upward trend.
We are looking for stability above the 100 Moving Average.
Entry price: 12.50
First target: 13.02
Second target: 13.93
Third target: 14.96

AUCTION COIN PRICE ANALYSIS AND NEXT POSSIBLE MOVES!!CRYPTOCAP:AUCTION Coin!!
• Right Now technically it's totally bearish like a falling knife🔪
• But on LTF's Price look in oversold zone area so small bounce back expected from mentioned support areas🫡
First local support 26$-24$.
2nd Strong support 21$-20$.
• if you want build trade on it then make sure to set stoploss first before entry & use low fund from usual 🚨
Warning : that's just my analysis DYOR Before Taking any action🚨

AUCTIONUSDT(BounceToken) Updated till 16-03-25AUCTIONUSDT(BounceToken) Daily timeframe range. this thing on absolute roll. where many alts in its lower low this thing going for its new high. now local resistance at 35.25 a clean close above it can push it to 48.94. recent support at 23.86.
