#AUCTION/USDT — Major Accumulation or Bearish Continuation?#AUCTION
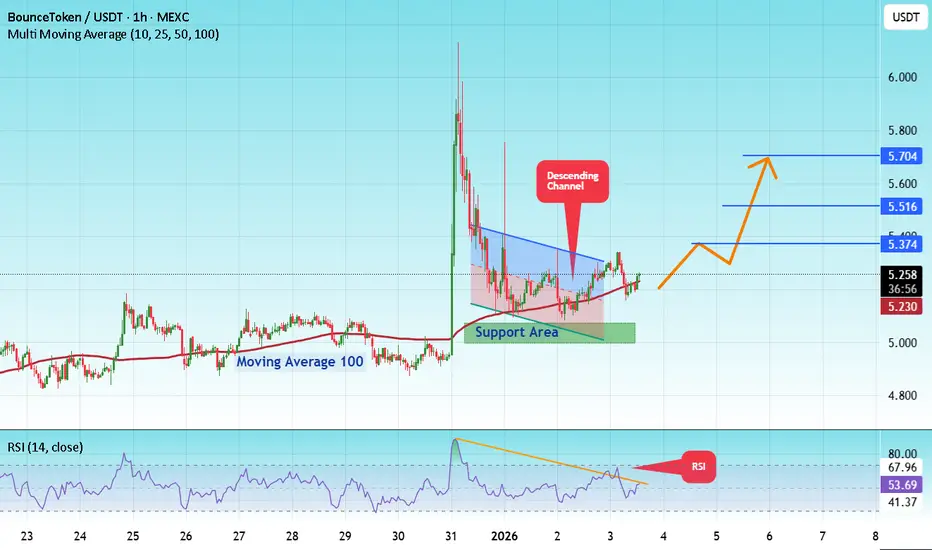
The price is moving in a descending channel on the 1-hour timeframe. It has reached the lower boundary and is heading towards a breakout, with a retest of the upper boundary expected.
We are seeing a bearish trend in the Relative Strength Index (RSI), which has reached near the lower boundary, and an upward bounce is expected.
There is a key support zone in green at 5.00, and the price has bounced from this level several times. Another bounce is expected.
We are seeing a trend towards stabilizing above the 100-period moving average, which we are approaching, supporting the upward trend.
Entry Price: 5.25
First Target: 5.37
Second Target: 5.51
Third Target: 5.70
Place your stop-loss order below the green support zone.
Remember a simple principle: Money Management.
For any questions, please leave a comment.
Thank you.
Auctions
#AUCTION/USDT — Major Accumulation or Bearish Continuation?#AUCTION
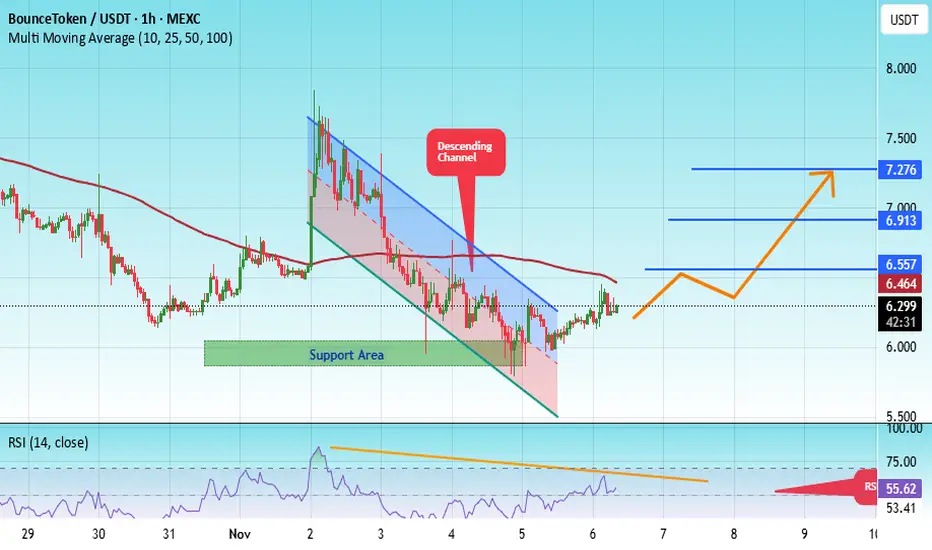
The price is moving within an ascending channel on the 1-hour timeframe and is adhering to it well. It is poised to break out strongly and retest the channel.
We have a downtrend line on the RSI indicator that is about to break and retest, which supports the upward move.
There is a key support zone in green at the 6.00 price level, representing a strong support point.
We have a trend of consolidation above the 100-period moving average.
Entry price: 6.28
First target: 6.54
Second target: 6.91
Third target: 7.27
Don't forget a simple money management rule:
Place your stop-loss order below the green support zone.
Once you reach the first target, save some money and then change your stop-loss order to an entry order.
For any questions, please leave a comment.
Thank you.
#AUCTION/USDT — Major Accumulation or Bearish Continuation?#AUCTION
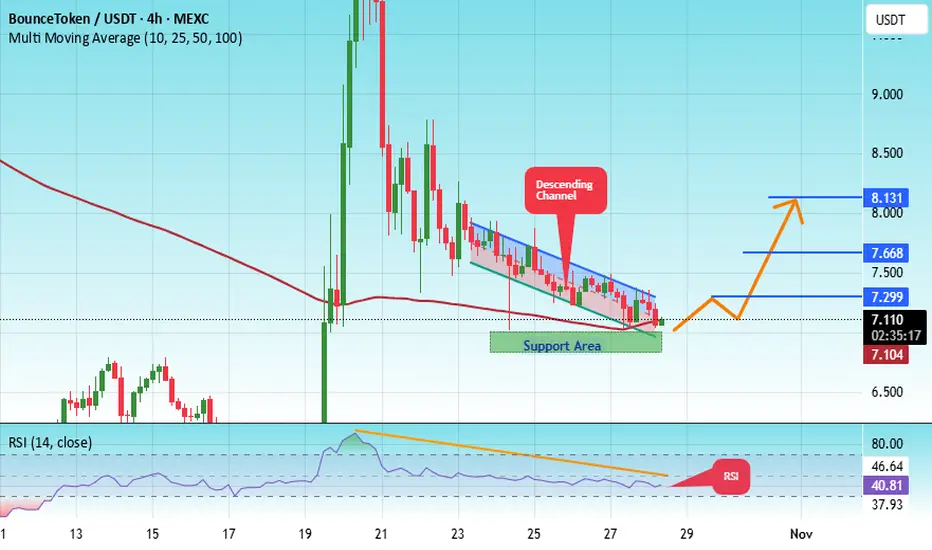
The price is moving in an ascending channel on the 1-hour frame, adhering well to it, and is heading for a strong breakout and retest.
We have a bearish trend on the RSI indicator that is about to be broken and retested, which supports the upward breakout.
There is a major support area in green at 6.90, representing a strong support point.
We are heading for consolidation above the 100 moving average.
Entry price: 7.11
First target: 7.30
Second target: 7.66
Third target: 8.11
Don't forget a simple matter: capital management.
When you reach the first target, save some money and then change your stop-loss order to an entry order.
For inquiries, please leave a comment.
Thank you.
AUCTION/USDT — Major Accumulation or Bearish Continuation?🔎 Overview
The AUCTION/USDT pair is currently moving sideways within the critical demand zone of $7.02 – $9.55 (yellow box). This area has acted as a strong accumulation level since July, serving as the last line of defense for buyers before potential continuation to the downside.
The mid-term structure remains bearish, as price continues to print lower highs since the peak at $51.59. However, this prolonged consolidation opens the possibility of forming a strong base for a reversal, should buyers hold this key zone.
---
🧩 Price Structure & Pattern
Main Trend (1D): Bearish → consistent lower highs from the ATH.
Current Pattern: Sideways within demand zone. Potential formation of an Accumulation Base or Double Bottom (W pattern) if a bullish breakout occurs.
Key Support: $9.55 → $7.02 (demand zone).
Step-by-Step Resistances: $11.736 → $14.131 → $16.263.
Major Resistance: $26.068 (psychological level & strong supply).
---
📈 Bullish Scenario
If price holds the demand zone and breaks above $11.736, upside targets become more realistic:
First target: $11.736 (minor resistance).
Second target: $14.131.
Third target: $16.263 (major barrier and liquidity zone).
With strong momentum + volume, retest towards $26.068 becomes possible.
👉 Bullish confirmation = daily close above $11.736 with volume expansion.
👉 Entry ideas:
Spot accumulation in the $7.0–$9.5 range with a stop below $7.0.
Breakout entry above $11.7 after retest confirmation.
---
📉 Bearish Scenario
If buyers fail to defend the zone, especially on a daily close below $7.02, the selling pressure could accelerate:
Possible continuation into lower liquidity areas ($6.4 – $5.5 range).
Breakdown from this base may trigger panic selling, as long-term demand zones often lead to sharp moves when invalidated.
👉 Bearish confirmation = daily close below $7.02.
👉 Entry idea: Short after confirmed breakdown and failed retest of the demand zone.
---
⚖️ Key Notes & Risk Management
The $7.0 – $9.5 zone is the battlefield between bulls and bears. As long as it holds, reversal potential remains.
Breakdown = bearish bias takes over.
Risk management:
For longs → stop below $7.0.
For shorts → stop above $9.5 (if breakdown is valid).
Beware of false breaks — always wait for daily close confirmation.
---
📝 Conclusion
AUCTION is at a make-or-break level. Will the $7.0–$9.5 demand zone become the foundation for a bullish reversal towards $11.7 → $14.1 → $16.2, or will it collapse into a bearish continuation towards deeper lows?
➡️ Patience is key — wait for confirmation before committing.
➡️ This zone will decide the next major direction for AUCTION in the coming weeks.
#AUCTION #AUCTIONUSDT #CryptoAnalysis #AltcoinSetup #PriceAction #SupportResistance #BreakoutOrBreakdown #CryptoTA #SwingTrade

#AUCTION/USDT#AUCTION
The price is moving within a descending channel on the 1-hour frame, adhering well to it, and is heading towards a strong breakout and retest.
We are experiencing a rebound from the lower boundary of the descending channel, which is support at 10.73.
We are experiencing a downtrend on the RSI indicator, which is about to break and retest, supporting the upward trend.
We are heading towards stability above the 100 Moving Average.
Entry price: 10.82
First target: 10.86
Second target: 11.02
Third target: 11.14

SHORT @ London Open - Monday June 23rd 2025I believe Sellers are in control of the auctions. I see a nice distribution wall above to launch shorts from. Target the 150 where there seems to be liquidity target making sense of a short trade. ALWAYS wait for Lopen. Demand may come in and take over 6025/Dist Wall. If so there is plenty to like about the LONGS then with liquidity above. How price comes into 6025 at Lopen is what we need to be looking for.

KSM longKsm is facing overhead resistance at 618 fibonacci level, a confimed breakout above 404.5 could lead us to $500.

Began Buying Yesterday RBASlow and steady buying this daily. Lil dividend cherry on top.
Like what I see and love Ritchie Bros. I drive by and see a yard full of heavy equipment... a week later empty... more.... empty.... MONEY IS BEING MADE!
little to no debt... RBA is positioned very well in the coming years.
As always good health, wealth, and best wishes to all!

BTC multi play scenario Long and Short positions . Hi Traders .
Most of information its on the chart .
Deeper analogy is if we close lower TP zone I will add more long positions depending on the situation of the price move to upper TP zone . To my experience with my system is that we should hit upper target zone first and is where I have short position sitting but if we hit lower first I will cancel the short play and only go long from that zone to upper target . First scenario it what my experience is with these kind of plays there for Im playing small long from here and no SL in place with TP at the level selected in upper target area . And in same time I have short position sitting there as well to the lower TP zone . This is kind of interesting on how this will play out and I never played this strategy before this way . We will see and test my years of trading here and developing my system .
Key is to go up and then down . Will it play out this way will see .
Hit that like button is you like this idea it motivates me to share my plays with you . Some people that follow made profits based on my trades . I see many new followers but zero love from them I make profits on consistent bases with Bitcoin so show the support if you are new to my profile ,
Cheers traders see you soon , I will keep posting in my comments on my moves so check often if you are interested .
Collecting Satoshi's its name of the game . My trades are 100X and BTC for BTC .

BTC FUTURE Interesting view In post .Everything I want to point out its on there .. with previous and last 24H example on the left . ignore mex in the middle .
zoom in version
