#AUCTION/USDT — Major Accumulation or Bearish Continuation?#AUCTION
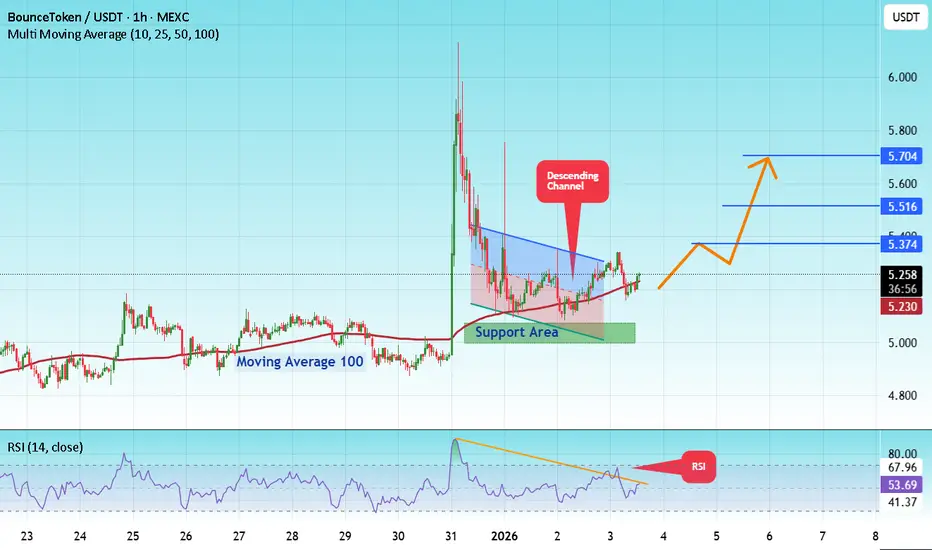
The price is moving in a descending channel on the 1-hour timeframe. It has reached the lower boundary and is heading towards a breakout, with a retest of the upper boundary expected.
We are seeing a bearish trend in the Relative Strength Index (RSI), which has reached near the lower boundary, and an upward bounce is expected.
There is a key support zone in green at 5.00, and the price has bounced from this level several times. Another bounce is expected.
We are seeing a trend towards stabilizing above the 100-period moving average, which we are approaching, supporting the upward trend.
Entry Price: 5.25
First Target: 5.37
Second Target: 5.51
Third Target: 5.70
Place your stop-loss order below the green support zone.
Remember a simple principle: Money Management.
For any questions, please leave a comment.
Thank you.
AUCTIONUSDT
#AUCTION/USDT — Major Accumulation or Bearish Continuation?#AUCTION
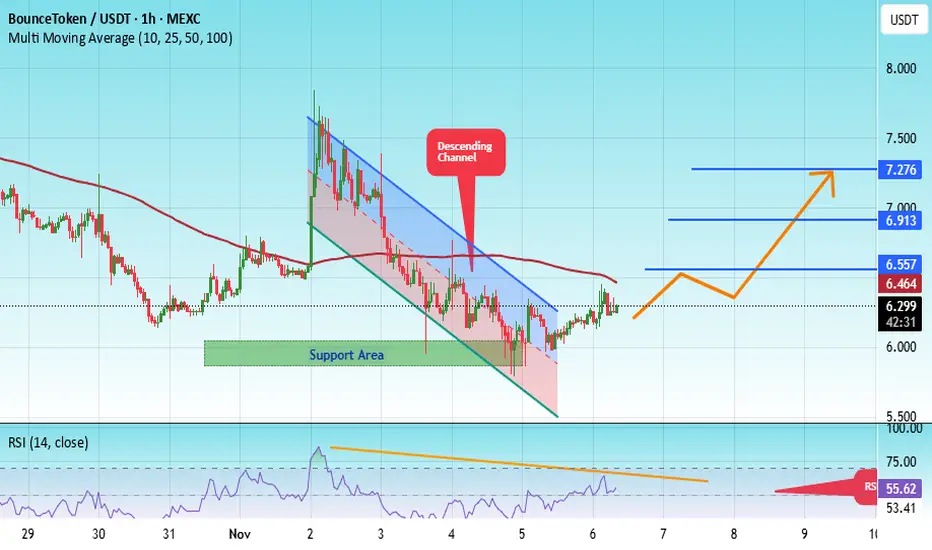
The price is moving within an ascending channel on the 1-hour timeframe and is adhering to it well. It is poised to break out strongly and retest the channel.
We have a downtrend line on the RSI indicator that is about to break and retest, which supports the upward move.
There is a key support zone in green at the 6.00 price level, representing a strong support point.
We have a trend of consolidation above the 100-period moving average.
Entry price: 6.28
First target: 6.54
Second target: 6.91
Third target: 7.27
Don't forget a simple money management rule:
Place your stop-loss order below the green support zone.
Once you reach the first target, save some money and then change your stop-loss order to an entry order.
For any questions, please leave a comment.
Thank you.
#AUCTION/USDT — Major Accumulation or Bearish Continuation?#AUCTION
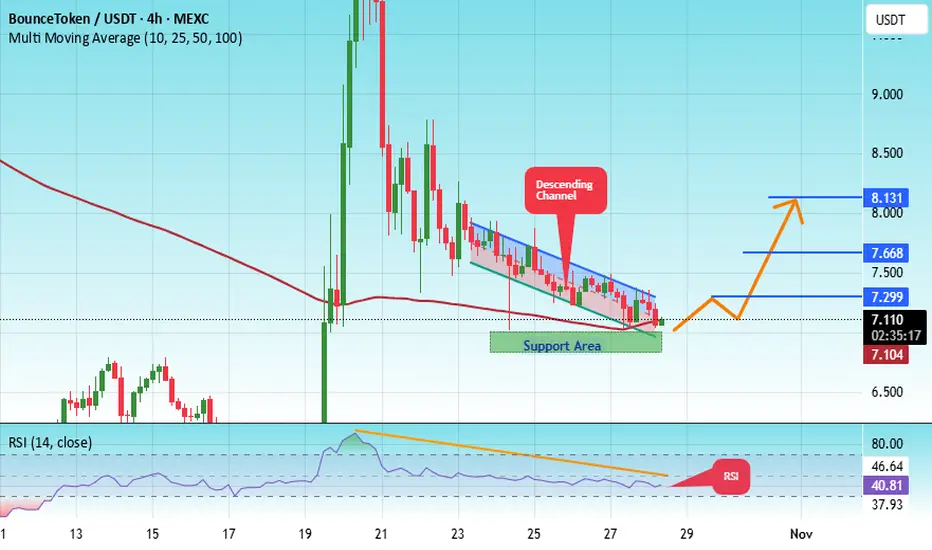
The price is moving in an ascending channel on the 1-hour frame, adhering well to it, and is heading for a strong breakout and retest.
We have a bearish trend on the RSI indicator that is about to be broken and retested, which supports the upward breakout.
There is a major support area in green at 6.90, representing a strong support point.
We are heading for consolidation above the 100 moving average.
Entry price: 7.11
First target: 7.30
Second target: 7.66
Third target: 8.11
Don't forget a simple matter: capital management.
When you reach the first target, save some money and then change your stop-loss order to an entry order.
For inquiries, please leave a comment.
Thank you.
AUCTION- BULL RETEST?? Following my yesterday's outlook, #AUCTION could start to pump back here in case of real breakout & retest HTF 📈
Solid demand zone, juicy buy volume 📈
Cautious with huge volatility. #DYOR

AUCTION Reclaiming StrengthAuction/USDT Analysis:
After the recent crash, $AUCTION has successfully reclaimed its support zone with strong momentum. The price has also broken above a key resistance line, a positive sign.
If it manages to close and sustain above this level, we could see a potential upside move in the coming days.
Keep an eye on the candle close and add it to your watchlist.
DYOR, NFA
#PEACE
AUCTIONUSDT Forming Falling WedgeAUCTIONUSDT is currently forming a falling wedge pattern, one of the most reliable bullish reversal structures in technical analysis. This setup often indicates that the bearish momentum is fading and that a potential breakout to the upside could be imminent. The price action has been consolidating tightly within the wedge, suggesting that sellers are losing strength while buyers are gradually stepping in. With good trading volume supporting the structure, a breakout above the resistance line could trigger a strong upward rally.
The falling wedge formation typically marks the end of a downtrend and the beginning of a bullish phase. In AUCTIONUSDT’s case, the technical indicators are aligning favorably — RSI is approaching neutral territory, and moving averages are starting to flatten, signaling a potential trend reversal. Once the breakout confirmation occurs, traders could expect a substantial upside move with an anticipated gain between 90% and 100%+, driven by renewed market optimism and increased buying momentum.
Investor interest in AUCTIONUSDT has been picking up recently, reflecting a growing belief in the project’s long-term potential. This surge in sentiment often acts as fuel for the next major leg up, as new capital flows into the market. If volume continues to rise alongside price, it will further validate the bullish breakout and establish stronger technical support zones for sustained growth.
✅ Show your support by hitting the like button and
✅ Leaving a comment below! (What is You opinion about this Coin)
Your feedback and engagement keep me inspired to share more insightful market analysis with you!

AUCTIONUSDT UPDATE#AUCTION
UPDATE
AUCTION Technical Setup
Pattern: Bullish falling wedge breakout
Current Price: $10.26
Target Price: $17.64
Target % Gain: 80.84%
$AUCTION has confirmed a strong breakout from a bullish falling wedge pattern on the 1D timeframe. With the current price at $10.26, the next potential target is around $17.64, indicating an upside of nearly 81%. This breakout signals strong bullish momentum and could mark the start of a significant trend reversal.
Time Frame: 1D
Risk Management Tip: Always use proper risk management.

AUCTION/USDT — Major Accumulation or Bearish Continuation?🔎 Overview
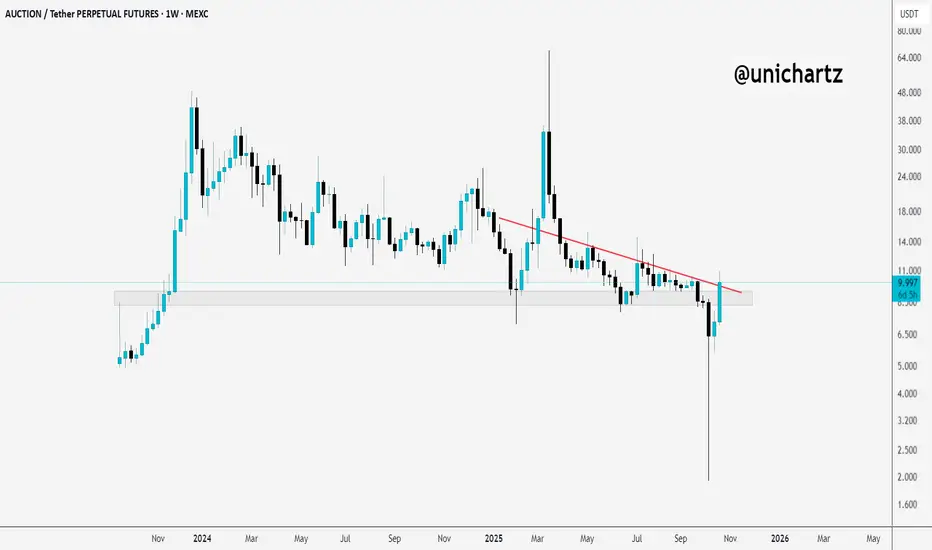
The AUCTION/USDT pair is currently moving sideways within the critical demand zone of $7.02 – $9.55 (yellow box). This area has acted as a strong accumulation level since July, serving as the last line of defense for buyers before potential continuation to the downside.
The mid-term structure remains bearish, as price continues to print lower highs since the peak at $51.59. However, this prolonged consolidation opens the possibility of forming a strong base for a reversal, should buyers hold this key zone.
---
🧩 Price Structure & Pattern
Main Trend (1D): Bearish → consistent lower highs from the ATH.
Current Pattern: Sideways within demand zone. Potential formation of an Accumulation Base or Double Bottom (W pattern) if a bullish breakout occurs.
Key Support: $9.55 → $7.02 (demand zone).
Step-by-Step Resistances: $11.736 → $14.131 → $16.263.
Major Resistance: $26.068 (psychological level & strong supply).
---
📈 Bullish Scenario
If price holds the demand zone and breaks above $11.736, upside targets become more realistic:
First target: $11.736 (minor resistance).
Second target: $14.131.
Third target: $16.263 (major barrier and liquidity zone).
With strong momentum + volume, retest towards $26.068 becomes possible.
👉 Bullish confirmation = daily close above $11.736 with volume expansion.
👉 Entry ideas:
Spot accumulation in the $7.0–$9.5 range with a stop below $7.0.
Breakout entry above $11.7 after retest confirmation.
---
📉 Bearish Scenario
If buyers fail to defend the zone, especially on a daily close below $7.02, the selling pressure could accelerate:
Possible continuation into lower liquidity areas ($6.4 – $5.5 range).
Breakdown from this base may trigger panic selling, as long-term demand zones often lead to sharp moves when invalidated.
👉 Bearish confirmation = daily close below $7.02.
👉 Entry idea: Short after confirmed breakdown and failed retest of the demand zone.
---
⚖️ Key Notes & Risk Management
The $7.0 – $9.5 zone is the battlefield between bulls and bears. As long as it holds, reversal potential remains.
Breakdown = bearish bias takes over.
Risk management:
For longs → stop below $7.0.
For shorts → stop above $9.5 (if breakdown is valid).
Beware of false breaks — always wait for daily close confirmation.
---
📝 Conclusion
AUCTION is at a make-or-break level. Will the $7.0–$9.5 demand zone become the foundation for a bullish reversal towards $11.7 → $14.1 → $16.2, or will it collapse into a bearish continuation towards deeper lows?
➡️ Patience is key — wait for confirmation before committing.
➡️ This zone will decide the next major direction for AUCTION in the coming weeks.
#AUCTION #AUCTIONUSDT #CryptoAnalysis #AltcoinSetup #PriceAction #SupportResistance #BreakoutOrBreakdown #CryptoTA #SwingTrade

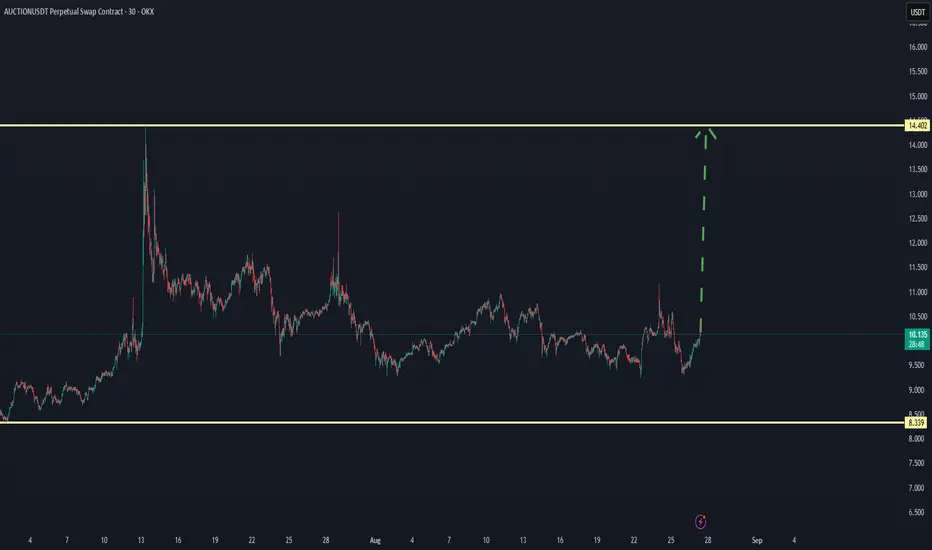
AUCTION CAN SEE A SHOT TREND TO UP $14 by confirmationAUCTION CAN SEE A SHOT TREND TO UP $14 by confirmation
AUCTION/USDT one of the coins that shows a pre-increase ( checking if it can get proof next hours). When this gets confirmed, there is a high chance ofa breakout.
When new updates coming will add here below at this chart.
#AUCTION/USDT#AUCTION
The price is moving within an ascending channel on the 1-hour frame, adhering well to it, and is on track to break it strongly upwards and retest it.
We have support from the lower boundary of the ascending channel, at 9.09.
We have a downtrend on the RSI indicator that is about to break and retest, supporting the upside.
There is a major support area in green at 8.80, which represents a strong basis for the upside.
Don't forget a simple thing: ease and capital.
When you reach the first target, save some money and then change your stop-loss order to an entry order.
For inquiries, please leave a comment.
We have a trend to hold above the 100 Moving Average.
Entry price: 9.89.
First target: 10.30.
Second target: 10.94.
Third target: 11.68.
Don't forget a simple thing: ease and capital.
When you reach your first target, save some money and then change your stop-loss order to an entry order.
For inquiries, please leave a comment.
Thank you.

#AUCTION/USDT ready to pump ?#AUCTION
The price is moving within a descending channel on the 1-hour frame, adhering well to it, and is on its way to breaking it strongly upwards and retesting it.
We have a bounce from the lower boundary of the descending channel. This support is at 10.68.
We have a downtrend on the RSI indicator that is about to be broken and retested, supporting the upside.
There is a major support area in green at 10.31, which represents a strong basis for the upside.
Don't forget a simple thing: ease and capital.
When you reach the first target, save some money and then change your stop-loss order to an entry order.
For inquiries, please leave a comment.
We have a trend to hold above the 100 Moving Average.
Entry price: 11.25
First target: 11.60
Second target: 12.00
Third target: 12.51
Don't forget a simple thing: ease and capital.
When you reach the first target, save some money and then change your stop-loss order to an entry order.
For inquiries, please leave a comment.
Thank you.

#AUCTION/USDT#AUCTION
The price is moving within a descending channel on the 1-hour frame, adhering well to it, and is heading for a strong breakout and retest.
We are experiencing a rebound from the lower boundary of the descending channel, which is support at 11.40.
We are experiencing a downtrend on the RSI indicator that is about to be broken and retested, supporting the upward trend.
We are looking for stability above the 100 Moving Average.
Entry price: 11.92
First target: 12.21
Second target: 12.53
Third target: 12.86

#AUCTION/USDT#AUCTION
The price is moving within a descending channel on the 1-hour frame, adhering well to it, and is heading towards a strong breakout and retest.
We are experiencing a rebound from the lower boundary of the descending channel, which is support at 10.73.
We are experiencing a downtrend on the RSI indicator, which is about to break and retest, supporting the upward trend.
We are heading towards stability above the 100 Moving Average.
Entry price: 10.82
First target: 10.86
Second target: 11.02
Third target: 11.14

$AUCTION Breakout +35% Target!$AUCTION has broken out of a descending triangle on the 4H chart and is now retesting the breakout zone around $10.89.
If this support holds, a move toward the $14.20 target +35.6% is likely.
Momentum looks bullish, watch for follow-through!
DYRO, NFA

#AUCTION/USDT#AUCTION
The price is moving within a descending channel on the 1-hour frame, adhering well to it, and is heading for a strong breakout and retest.
We are seeing a bounce from the lower boundary of the descending channel, which is support at 11.26.
We have a downtrend on the RSI indicator that is about to be broken and retested, supporting the upward trend.
We are looking for stability above the 100 Moving Average.
Entry price: 11.50
First target: 11.81
Second target: 12.26
Third target: 12.84

#AUCTION/USDT#AUCTION
The price is moving within a descending channel on the 1-hour frame, adhering well to it, and is heading for a strong breakout and retest.
We are experiencing a rebound from the lower boundary of the descending channel, which is support at 11.15.
We are experiencing a downtrend on the RSI indicator that is about to break and retest, supporting the upward trend.
We are looking for stability above the 100 moving average.
Entry price: 11.22
First target: 11.37
Second target: 11.53
Third target: 11.74

#AUCTION/USDT#AUCTION
The price is moving within a descending channel on the 1-hour frame, adhering well to it, and is heading for a strong breakout and retest.
We are seeing a bounce from the lower boundary of the descending channel, which is support at 11.72.
We have a downtrend on the RSI indicator that is about to be broken and retested, supporting the upward trend.
We are looking for stability above the 100 Moving Average.
Entry price: 12.00
First target: 12.45
Second target: 12.83
Third target: 13.26

AUCTIONUSDT | Spot Swing Accumulation Play
🔹 Entry Zones & Allocation :
🥉$10 – $11 (Momentum: 25% if strength confirms)
🥈$8 – $9 (Light: 25%)
🥇$6 – $7 (Main Bid: 50%)
🔹 Targets :
TP1: $18
TP2: $24
TP3: $30+
‼️ Stop : $4.90 (Breakdown invalidation)
🧠 Bias : Weekly demand active. Eyes on BTC behavior — if it sweeps $70K or lower, deeper bid zone activates. Scaling spot only — mid-cycle narrative in play.

AUCTIONUSDT 1WAUCTION ~ 1W Analysis
#AUCTION Buy back when testing this support with a short -term target of at least 20%+.

#AUCTION/USDT#AUCTION
The price is moving within a descending channel on the 1-hour frame, adhering well to it, and is heading for a strong breakout and retest.
We are seeing a bounce from the lower boundary of the descending channel, which is support at 11.80.
We have a downtrend on the RSI indicator that is about to be broken and retested, supporting the upward trend.
We are looking for stability above the 100 Moving Average.
Entry price: 12.50
First target: 13.02
Second target: 13.93
Third target: 14.96

#AUCTIONUSDT shows continued buyer weakness📉 Short BYBIT:AUCTIONUSDT.P from $16.370
⚡️ Stop loss $16.735
🕒 1H Timeframe
⚡️ Overview:
➡️ The POC (Point of Control) is located at $17.734, indicating the highest volume area and now acting as a strong resistance.
➡️ Price BYBIT:AUCTIONUSDT.P continues to trade below the accumulation zone, confirming sellers' control.
➡️ After a local bounce, the chart shows a breakdown below $16.370 — this triggers a potential short setup.
➡️ Target zones are set near previous reaction levels, making them suitable for profit-taking.
🎯 TP Targets:
💎 TP 1: $16.165
💎 TP 2: $16.040
💎 TP 3: $15.850
📢 Watch for solid confirmation below $16.370 — this would strengthen the case for downside continuation.
📢 If price moves back above $16.735, the short setup is invalidated.
BYBIT:AUCTIONUSDT.P shows continued buyer weakness — downside movement is expected if pressure remains.

Auction spot swing Againinterested in Auction again at this price just got notification earlier.
previously I got 550%+ on this.(idea linked below)
entered DCA long under 21 for me looks very decent price to buy.
wants higher prices sooner.
looking at the sharp dump will not stick to it if doesn't hold here.
Strategy:
DCA in under 21 if doesn't hold DCA out
Note: Not a Financial Advice.

AUCTION COIN PRICE ANALYSIS AND NEXT POSSIBLE MOVES!!CRYPTOCAP:AUCTION Coin!!
• Right Now technically it's totally bearish like a falling knife🔪
• But on LTF's Price look in oversold zone area so small bounce back expected from mentioned support areas🫡
First local support 26$-24$.
2nd Strong support 21$-20$.
• if you want build trade on it then make sure to set stoploss first before entry & use low fund from usual 🚨
Warning : that's just my analysis DYOR Before Taking any action🚨
