Bullish continuation setup?AUD/CAD is falling towards the support level which is an overlap support that aligns with the 50% Fibonacci retracement and could bounce from this level to our take profit.
Entry: 0.95867
Why we like it:
There is a pullback support level.
Stop loss: 0.94947
Why we like it:
There is a pullback support level.
Take profit: 0.96947
Why we like it:
There is a swing high resistance level.
Enjoying your TradingView experience? Review us!
Please be advised that the information presented on TradingView is provided to Vantage (‘Vantage Global Limited’, ‘we’) by a third-party provider (‘Everest Fortune Group’). Please be reminded that you are solely responsible for the trading decisions on your account. There is a very high degree of risk involved in trading. Any information and/or content is intended entirely for research, educational and informational purposes only and does not constitute investment or consultation advice or investment strategy. The information is not tailored to the investment needs of any specific person and therefore does not involve a consideration of any of the investment objectives, financial situation or needs of any viewer that may receive it. Kindly also note that past performance is not a reliable indicator of future results. Actual results may differ materially from those anticipated in forward-looking or past performance statements. We assume no liability as to the accuracy or completeness of any of the information and/or content provided herein and the Company cannot be held responsible for any omission, mistake nor for any loss or damage including without limitation to any loss of profit which may arise from reliance on any information supplied by Everest Fortune Group.
Aud-cad

AUDCAD SellThe AUDCAD pair is showing clear bearish signals following the formation of a double top pattern. Price has failed twice to push higher, indicating strong resistance at the recent highs and weakening bullish momentum. Most importantly, the neckline has now been decisively broken, confirming the pattern and strengthening the bearish outlook.

Bullish bounce off 61.8% Fib support?AUD/CAD is falling towards the pivot, which is a pullback support that aligns with the 61.8% Fibonacci retracement and could bounce to the 1st resistance.
Pivot: 0.95095
1st Support: 0.94496
1st Resistance: 0.96141
Disclaimer:
The opinions given above constitute general market commentary and do not constitute the opinion or advice of IC Markets or any form of personal or investment advice.
Any opinions, news, research, analyses, prices, other information, or links to third-party sites contained on this website are provided on an "as-is" basis, are intended to be informative only, and are not advice, a recommendation, research, a record of our trading prices, an offer of, or solicitation for, a transaction in any financial instrument and thus should not be treated as such. The information provided does not involve any specific investment objectives, financial situation, or needs of any specific person who may receive it. Please be aware that past performance is not a reliable indicator of future performance and/or results. Past performance or forward-looking scenarios based upon the reasonable beliefs of the third-party provider are not a guarantee of future performance. Actual results may differ materially from those anticipated in forward-looking or past performance statements. IC Markets makes no representation or warranty and assumes no liability as to the accuracy or completeness of the information provided, nor any loss arising from any investment based on a recommendation, forecast, or any information supplied by any third party

Bullish continuation setup?AUD/CAD could fall towards the support level, which is a pullback support that is slightly above the 38.2% Fibonacci retracement and could bounce from this level to our take profit.
Entry: 0.9353
Why we like it:
There is a pullback support level that is slightly above the 38.2% Fibonacci retracement.
Stop loss: 0.92662
Why we like it:
There is a pullback support that aligns with the 50% Fibonacci retracement.
Take profit: 0.94381
Why we like it:
There is a pullback resistance level.
Enjoying your TradingView experience? Review us!
Please be advised that the information presented on TradingView is provided to Vantage (‘Vantage Global Limited’, ‘we’) by a third-party provider (‘Everest Fortune Group’). Please be reminded that you are solely responsible for the trading decisions on your account. There is a very high degree of risk involved in trading. Any information and/or content is intended entirely for research, educational and informational purposes only and does not constitute investment or consultation advice or investment strategy. The information is not tailored to the investment needs of any specific person and therefore does not involve a consideration of any of the investment objectives, financial situation or needs of any viewer that may receive it. Kindly also note that past performance is not a reliable indicator of future results. Actual results may differ materially from those anticipated in forward-looking or past performance statements. We assume no liability as to the accuracy or completeness of any of the information and/or content provided herein and the Company cannot be held responsible for any omission, mistake nor for any loss or damage including without limitation to any loss of profit which may arise from reliance on any information supplied by Everest Fortune Group.

Bullish momentum to extend?AUD/CAD is falling towards the support level, which is a pullback support that aligns with the 38.2% Fibonacci retracement and could bounce from this level to our take profit.
Entry: 0.9246
Why we like it:
There is a pullback support level that aligns with the 38.2% Fibonacci retracement.
Stop loss: 0.91956
Why we like it:
There is a pullback support that is slightly above the 61.8% Fibonacci retracement.
Take profit: 0.93287
Why we like it:
There is a swing high resistance level.
Enjoying your TradingView experience? Review us!
Please be advised that the information presented on TradingView is provided to Vantage (‘Vantage Global Limited’, ‘we’) by a third-party provider (‘Everest Fortune Group’). Please be reminded that you are solely responsible for the trading decisions on your account. There is a very high degree of risk involved in trading. Any information and/or content is intended entirely for research, educational and informational purposes only and does not constitute investment or consultation advice or investment strategy. The information is not tailored to the investment needs of any specific person and therefore does not involve a consideration of any of the investment objectives, financial situation or needs of any viewer that may receive it. Kindly also note that past performance is not a reliable indicator of future results. Actual results may differ materially from those anticipated in forward-looking or past performance statements. We assume no liability as to the accuracy or completeness of any of the information and/or content provided herein and the Company cannot be held responsible for any omission, mistake nor for any loss or damage including without limitation to any loss of profit which may arise from reliance on any information supplied by Everest Fortune Group.

AUDCAD - From Shorts to Potential Longs!!Earlier in this range, we sold 📉AUDCAD near the upper boundary, fading resistance as price showed clear exhaustion. That idea played out well, with price rotating back into the middle and now pressing toward the lower bound of the range.
This is where things shift.
⚔️As long as range support holds, the bias flips from selling rallies to looking for longs from support. In a well-defined range, edges matter more than direction, and the lower boundary is where buyers historically step in.
The plan from here is simple and disciplined.
No chasing. No guessing....
🏹If price holds above support and shows bullish reaction on lower timeframes, longs become valid back toward the range highs. A clean breakdown below support would invalidate this idea and put sellers back in control.
Range trading is not about prediction, it’s about location and reaction.
Will buyers defend the floor once again, or is this range finally ready to break? 🤔
⚠️ Disclaimer: This is not financial advice. Always do your own research and manage risk properly.
📚 Stick to your trading plan regarding entries, risk, and management.
Good luck! 🍀
All Strategies Are Good; If Managed Properly!
~Richard Nasr

Bearish reversal setup?AUD/CAD is rising towards the resistance level which is a pullback resistance that lines up with the 50% Fibonacci retracement and could reverse from this level to our take profit.
Entry: 0.9165
Why we like it:
There is a pullback resistance that aligns with the 50% Fibonacci retracement.
Stop loss: 0.9183
Why we like it:
There is a pullback resistance level.
Take profit: 0.91312
Why we like it:
There is a pullback support that is slightly above the 61.8% Fibonacci retracement
Enjoying your TradingView experience? Review us!
Please be advised that the information presented on TradingView is provided to Vantage (‘Vantage Global Limited’, ‘we’) by a third-party provider (‘Everest Fortune Group’). Please be reminded that you are solely responsible for the trading decisions on your account. There is a very high degree of risk involved in trading. Any information and/or content is intended entirely for research, educational and informational purposes only and does not constitute investment or consultation advice or investment strategy. The information is not tailored to the investment needs of any specific person and therefore does not involve a consideration of any of the investment objectives, financial situation or needs of any viewer that may receive it. Kindly also note that past performance is not a reliable indicator of future results. Actual results may differ materially from those anticipated in forward-looking or past performance statements. We assume no liability as to the accuracy or completeness of any of the information and/or content provided herein and the Company cannot be held responsible for any omission, mistake nor for any loss or damage including without limitation to any loss of profit which may arise from reliance on any information supplied by Everest Fortune Group.

Bullish continuation off key support?AUD/CAD could fall towards the support level, which is an overlap support, and then bounce from this level to our take profit.
Entry: 0.9155
Why we like it:
There is an overlap support level.
Stop loss: 0.91421
Why we like it:
There is a pullback support that is slightly above the 50% Fibonacci retracement.
Take profit: 0.91868
Why we like it:
There is an overlap resistance level.
Enjoying your TradingView experience? Review us!
Please be advised that the information presented on TradingView is provided to Vantage (‘Vantage Global Limited’, ‘we’) by a third-party provider (‘Everest Fortune Group’). Please be reminded that you are solely responsible for the trading decisions on your account. There is a very high degree of risk involved in trading. Any information and/or content is intended entirely for research, educational and informational purposes only and does not constitute investment or consultation advice or investment strategy. The information is not tailored to the investment needs of any specific person and therefore does not involve a consideration of any of the investment objectives, financial situation or needs of any viewer that may receive it. Kindly also note that past performance is not a reliable indicator of future results. Actual results may differ materially from those anticipated in forward-looking or past performance statements. We assume no liability as to the accuracy or completeness of any of the information and/or content provided herein and the Company cannot be held responsible for any omission, mistake nor for any loss or damage including without limitation to any loss of profit which may arise from reliance on any information supplied by Everest Fortune Group.

Bearish reversal off key resistance?AUD/CAD is rising towards the pivot which acts as an overlap resistance and could reverse to the 1st support.
Pivot: 0.91873
1st Support: 0.91467
1st Resistance: 0.92053
Disclaimer:
The opinions given above constitute general market commentary and do not constitute the opinion or advice of IC Markets or any form of personal or investment advice.
Any opinions, news, research, analyses, prices, other information, or links to third-party sites contained on this website are provided on an "as-is" basis, are intended to be informative only, and are not advice, a recommendation, research, a record of our trading prices, an offer of, or solicitation for, a transaction in any financial instrument and thus should not be treated as such. The information provided does not involve any specific investment objectives, financial situation, or needs of any specific person who may receive it. Please be aware that past performance is not a reliable indicator of future performance and/or results. Past performance or forward-looking scenarios based upon the reasonable beliefs of the third-party provider are not a guarantee of future performance. Actual results may differ materially from those anticipated in forward-looking or past performance statements. IC Markets makes no representation or warranty and assumes no liability as to the accuracy or completeness of the information provided, nor any loss arising from any investment based on a recommendation, forecast, or any information supplied by any third party

Bearish drop off?AUD/CHF is reacting off the resistance level, which is a pullback resistance and could drop from this level to our take profit.
Entry: 0.91626
Why we like it:
There is a pullback resistance level
Stop loss: 0.91861
Why we like it:
There is an overlap resistance level.
Take profit: 0.91181
Why we like it:
There is a pullback support level that is slightly above the 100% Fibonacci projection.
Enjoying your TradingView experience? Review us!
Please be advised that the information presented on TradingView is provided to Vantage (‘Vantage Global Limited’, ‘we’) by a third-party provider (‘Everest Fortune Group’). Please be reminded that you are solely responsible for the trading decisions on your account. There is a very high degree of risk involved in trading. Any information and/or content is intended entirely for research, educational and informational purposes only and does not constitute investment or consultation advice or investment strategy. The information is not tailored to the investment needs of any specific person and therefore does not involve a consideration of any of the investment objectives, financial situation or needs of any viewer that may receive it. Kindly also note that past performance is not a reliable indicator of future results. Actual results may differ materially from those anticipated in forward-looking or past performance statements. We assume no liability as to the accuracy or completeness of any of the information and/or content provided herein and the Company cannot be held responsible for any omission, mistake nor for any loss or damage including without limitation to any loss of profit which may arise from reliance on any information supplied by Everest Fortune Group.

Bearish drop off?AUD/CAD is rising towards the resistance level which is a pullback resistance that aligns with the 38.2% Fibonacci retracement and could reverse from this level to our take profit.
Entry: 0.91961
Why we like it:
There is a pullback resistance that aligns with the 38.2% Fibonacci retracement.
Stop loss: 0.92566
Why we like it:
There is a swing high resistance.
Take profit: 0.91181
Why we like it:
There is a pullback support level that is slightly below the 61.8% Fibonacci retracement.
Enjoying your TradingView experience? Review us!
Please be advised that the information presented on TradingView is provided to Vantage (‘Vantage Global Limited’, ‘we’) by a third-party provider (‘Everest Fortune Group’). Please be reminded that you are solely responsible for the trading decisions on your account. There is a very high degree of risk involved in trading. Any information and/or content is intended entirely for research, educational and informational purposes only and does not constitute investment or consultation advice or investment strategy. The information is not tailored to the investment needs of any specific person and therefore does not involve a consideration of any of the investment objectives, financial situation or needs of any viewer that may receive it. Kindly also note that past performance is not a reliable indicator of future results. Actual results may differ materially from those anticipated in forward-looking or past performance statements. We assume no liability as to the accuracy or completeness of any of the information and/or content provided herein and the Company cannot be held responsible for any omission, mistake nor for any loss or damage including without limitation to any loss of profit which may arise from reliance on any information supplied by Everest Fortune Group.

Multi swing high resistance ahead?AUD/CAD is rising towards the resistance level, which is a multi swing high resistance and could reverse from this level to our take profit.
Entry: 0.91961
Why we like it:
There is a multi-swing high resistance
Stop loss: 0.92483
Why we like it:
There is a resistance level at the 127.2% Fibonacci extension.
Take profit: 0.91181
Why we like it:
There is a pullback support level.
Enjoying your TradingView experience? Review us!
Please be advised that the information presented on TradingView is provided to Vantage (‘Vantage Global Limited’, ‘we’) by a third-party provider (‘Everest Fortune Group’). Please be reminded that you are solely responsible for the trading decisions on your account. There is a very high degree of risk involved in trading. Any information and/or content is intended entirely for research, educational and informational purposes only and does not constitute investment or consultation advice or investment strategy. The information is not tailored to the investment needs of any specific person and therefore does not involve a consideration of any of the investment objectives, financial situation or needs of any viewer that may receive it. Kindly also note that past performance is not a reliable indicator of future results. Actual results may differ materially from those anticipated in forward-looking or past performance statements. We assume no liability as to the accuracy or completeness of any of the information and/or content provided herein and the Company cannot be held responsible for any omission, mistake nor for any loss or damage including without limitation to any loss of profit which may arise from reliance on any information supplied by Everest Fortune Group.

#042: Long Investment Opportunity on AUD/CAD
The Australian dollar/Canadian dollar pair is moving within a broad compression phase that has been developing for several sessions. Hello, I'm Forex Trader Andrea Russo, author of the book "The Institutional Code of Forex, 14 Steps to Read the Markets Like a Bank," available on Amazon. I'm an independent trader and money manager, and I thank you in advance for your time.
This structure has created a clear area of inefficiency just below the current market, while liquidity remains relatively flat and concentrated around the most recent lows.
From a technical perspective, the pair is reacting after a prolonged period of downside pressure, forming a sequence of higher rejection wicks near a key support region. This behavior suggests that short-side exhaustion is beginning to emerge. The market is no longer making momentum-driven lows and is instead moving toward a classic accumulation pattern, often observed before a corrective upside expansion.
Intermarket flows also support this interpretation. The Australian dollar is beginning to stabilize after a period of weakness triggered by commodity repricing and the reprioritization of macroeconomic priorities. Meanwhile, the Canadian dollar is showing signs of deceleration, partly influenced by the weaker tone of energy markets. The combination of a stabilizing AUD and a slower CAD creates a favorable environment for a bullish retracement on this cross.
Volatility conditions remain moderate, and the recovery in short-term momentum indicators is consistent with the idea that the pair may attempt a rotation toward the middle range of the broader structure. The pair is currently near the lower limit of this range, making the risk-reward profile more attractive for a controlled long position, especially for traders seeking to anticipate institutional accumulation rather than chasing breakout moves.
Price action offers an initial reversal signal, supported by a sharper rejection from discounted levels. If the market maintains this behavior and continues to respect the support zone it has repeatedly defended, a bullish continuation toward upper liquidity pockets becomes the most consistent scenario.
In summary, AUDCAD represents a strategic opportunity for bullish exposure within a controlled and well-defined structure. The pair is showing the first signs of accumulation, improving sentiment dynamics, and an intermarket environment favoring an upward correction. This configuration is consistent with an institutional approach that favors discounted entries, asymmetric risk, and positioning relative to the retail sentiment curve.

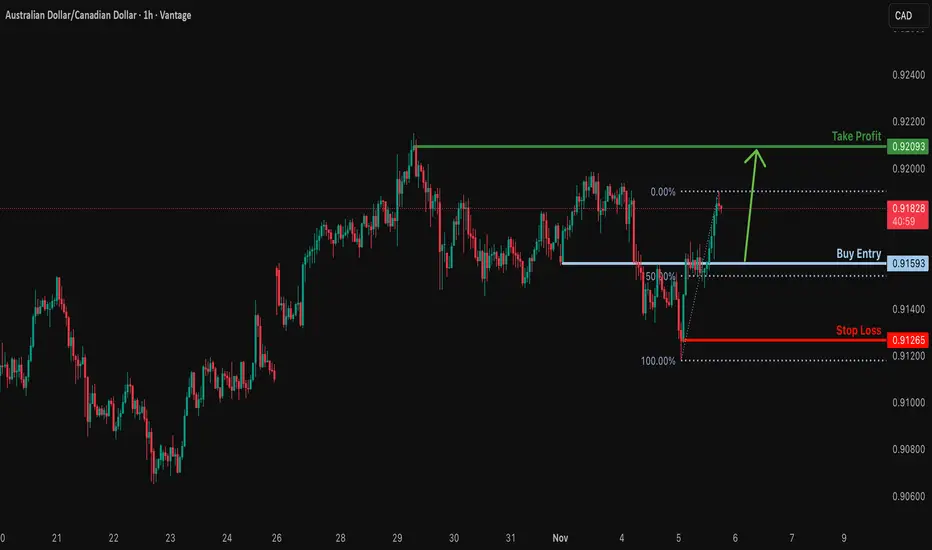
Bullish bounce off overlap support?AUD/CAD is falling towards the support level, which is a pullback support that is slightly above the 50% Fibonacci retracement and could bounce from this level to our take profit.
Entry: 0.91593
Why we like it:
There is a pullback support that is slightly above the 50% Fibonacci retracement.
Stop loss: 0.91265
Why we like it:
There is a swing low support level.
Take profit: 0.92093
Why we like it:
There is a swing resistance level.
Enjoying your TradingView experience? Review us!
Please be advised that the information presented on TradingView is provided to Vantage (‘Vantage Global Limited’, ‘we’) by a third-party provider (‘Everest Fortune Group’). Please be reminded that you are solely responsible for the trading decisions on your account. There is a very high degree of risk involved in trading. Any information and/or content is intended entirely for research, educational and informational purposes only and does not constitute investment or consultation advice or investment strategy. The information is not tailored to the investment needs of any specific person and therefore does not involve a consideration of any of the investment objectives, financial situation or needs of any viewer that may receive it. Kindly also note that past performance is not a reliable indicator of future results. Actual results may differ materially from those anticipated in forward-looking or past performance statements. We assume no liability as to the accuracy or completeness of any of the information and/or content provided herein and the Company cannot be held responsible for any omission, mistake nor for any loss or damage including without limitation to any loss of profit which may arise from reliance on any information supplied by Everest Fortune Group.
Bullish bounce off pullback support?AUD/CAD is falling towards the support level, which is a pullback support that aligns with the 38.2% Fibonacci retracement and could bounce from this level to our take profit.
Entry: 0.91526
Why we like it:
There is a pullback support that aligns with the 38.2% Fibonacci retracement.
Stop loss: 0.90988
Why we like it:
There is a pullback support that aligns with the 78.6% Fibonacci retracement.
Take profit: 0.92437
Why we like it:
There is a swing high resistance level.
Enjoying your TradingView experience? Review us!
Please be advised that the information presented on TradingView is provided to Vantage (‘Vantage Global Limited’, ‘we’) by a third-party provider (‘Everest Fortune Group’). Please be reminded that you are solely responsible for the trading decisions on your account. There is a very high degree of risk involved in trading. Any information and/or content is intended entirely for research, educational and informational purposes only and does not constitute investment or consultation advice or investment strategy. The information is not tailored to the investment needs of any specific person and therefore does not involve a consideration of any of the investment objectives, financial situation or needs of any viewer that may receive it. Kindly also note that past performance is not a reliable indicator of future results. Actual results may differ materially from those anticipated in forward-looking or past performance statements. We assume no liability as to the accuracy or completeness of any of the information and/or content provided herein and the Company cannot be held responsible for any omission, mistake nor for any loss or damage including without limitation to any loss of profit which may arise from reliance on any information supplied by Everest Fortune Group.

Bearish drop?AUD/CAD has rejected off the pivot, which is a pullback resistance and could drop to the 1st support, which aligns with the 78.6% Fibonacci projection.
Pivot: 0.91529
1st Support: 0.90179
1st Resistance: 0.92279
Disclaimer:
The above opinions given constitute general market commentary, and do not constitute the opinion or advice of IC Markets or any form of personal or investment advice.
Any opinions, news, research, analyses, prices, other information, or links to third-party sites contained on this website are provided on an "as-is" basis, are intended only to be informative, is not an advice nor a recommendation, nor research, or a record of our trading prices, or an offer of, or solicitation for a transaction in any financial instrument and thus should not be treated as such. The information provided does not involve any specific investment objectives, financial situation and needs of any specific person who may receive it. Please be aware, that past performance is not a reliable indicator of future performance and/or results. Past Performance or Forward-looking scenarios based upon the reasonable beliefs of the third-party provider are not a guarantee of future performance. Actual results may differ materially from those anticipated in forward-looking or past performance statements. IC Markets makes no representation or warranty and assumes no liability as to the accuracy or completeness of the information provided, nor any loss arising from any investment based on a recommendation, forecast or any information supplied by any third-party.

#033: Long Investment Opportunity on AUD/CAD
The Australian dollar/Canadian dollar exchange rate has been consolidating for several sessions, establishing a clean base just above a key demand area. Hello, I'm Forex Trader Andrea Russo, an independent trader and prop trader with $200,000 in capital under management. Thank you in advance for your time.
It's not just the support itself that's interesting, but also the way the price has reacted each time it's tested: strong rejections, increasing volume, and clear signs of institutional traders absorbing the market.
On higher timeframes, the bearish pressure is showing signs of exhaustion. The latest candles have pronounced lower wicks, a sign that buyers are returning to activity while the sellers' pressure is slowing. The price continues to move within a descending channel, but the structure is starting to show the first signs of a possible reversal.
Volumes also tell the same story: each test of the low zone has been accompanied by an increase in activity, typical of an accumulation phase. The main moving averages are flattening, confirming a loss of strength in the previous trend.
From a macro perspective, the Australian dollar continues to benefit from the stability of the commodity market and a relatively neutral monetary policy, while the Canadian dollar is suffering from the recent weakening of oil prices. This intermarket divergence often heralds a corrective or impulsive move in favor of the AUD.
In summary, the technical and fundamental context suggests a possible resumption of bullish momentum. However, it will be crucial to wait for a decisive close above the short-term resistance zone to confirm the entry of directional momentum.

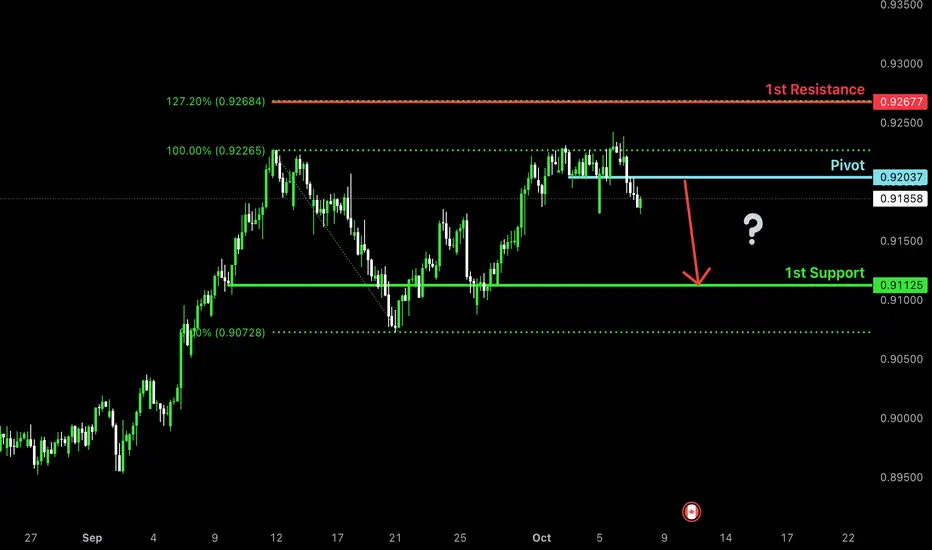
Potential bearish drop?AUD/CAD is rising towards the pivot which is a pullback resistance and could drop to the 1st support.
Pivot: 0.92037
1st Support: 0.91125
1st Resistance: 0.92677
Disclaimer:
The above opinions given constitute general market commentary, and do not constitute the opinion or advice of IC Markets or any form of personal or investment advice.
Any opinions, news, research, analyses, prices, other information, or links to third-party sites contained on this website are provided on an "as-is" basis, are intended only to be informative, is not an advice nor a recommendation, nor research, or a record of our trading prices, or an offer of, or solicitation for a transaction in any financial instrument and thus should not be treated as such. The information provided does not involve any specific investment objectives, financial situation and needs of any specific person who may receive it. Please be aware, that past performance is not a reliable indicator of future performance and/or results. Past Performance or Forward-looking scenarios based upon the reasonable beliefs of the third-party provider are not a guarantee of future performance. Actual results may differ materially from those anticipated in forward-looking or past performance statements. IC Markets makes no representation or warranty and assumes no liability as to the accuracy or completeness of the information provided, nor any loss arising from any investment based on a recommendation, forecast or any information supplied by any third-party.
Bullish bounce?AUD/CAD is falling towards the support level, which is a pullback support that aligns with the 38.2% Fibonacci retracement and could bounce from this level to our take rpofit.
Entry: 0.91661
Why we like it:
There is a pullback support that lines up with the 38.2% Fibonacci retracement.
Stop loss: 0.91036
Why we like it:
There is a pullback support that lines up with the 78.6% Fibonacci retracement.
Take profit: 0.92722
Why we like it:
There is a resistance level which lines up with the 127.2% Fibonacci extension.
Enjoying your TradingView experience? Review us!
Please be advised that the information presented on TradingView is provided to Vantage (‘Vantage Global Limited’, ‘we’) by a third-party provider (‘Everest Fortune Group’). Please be reminded that you are solely responsible for the trading decisions on your account. There is a very high degree of risk involved in trading. Any information and/or content is intended entirely for research, educational and informational purposes only and does not constitute investment or consultation advice or investment strategy. The information is not tailored to the investment needs of any specific person and therefore does not involve a consideration of any of the investment objectives, financial situation or needs of any viewer that may receive it. Kindly also note that past performance is not a reliable indicator of future results. Actual results may differ materially from those anticipated in forward-looking or past performance statements. We assume no liability as to the accuracy or completeness of any of the information and/or content provided herein and the Company cannot be held responsible for any omission, mistake nor for any loss or damage including without limitation to any loss of profit which may arise from reliance on any information supplied by Everest Fortune Group.

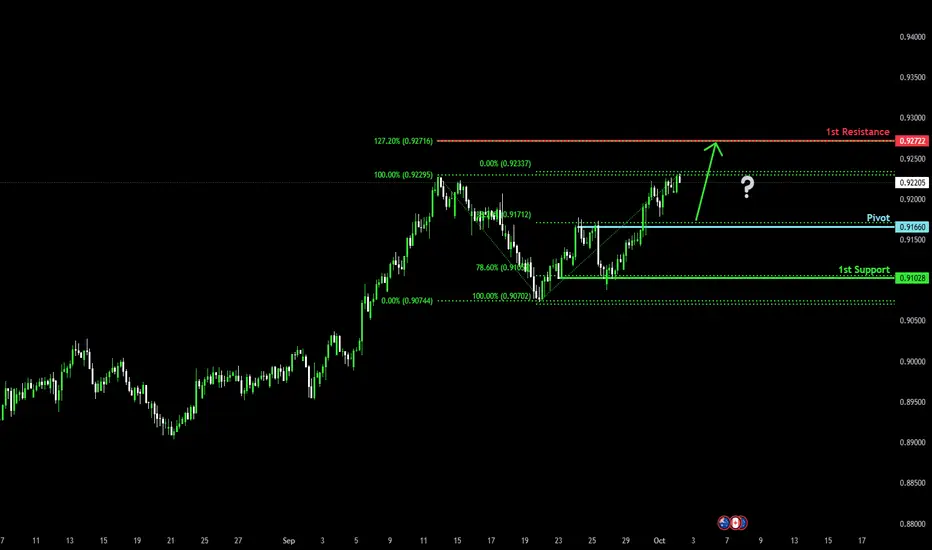
Bullish bounce setup?AUD/CAD is falling towards the pivot which is a pullback support and could bounce to the 1st resistance which lines up with the 127.2% Fibonacci extension.
Pivot: 0.9166
1st Support: 0.91028
1st Resistance: 0.92722
Disclaimer:
The above opinions given constitute general market commentary, and do not constitute the opinion or advice of IC Markets or any form of personal or investment advice.
Any opinions, news, research, analyses, prices, other information, or links to third-party sites contained on this website are provided on an "as-is" basis, are intended only to be informative, is not an advice nor a recommendation, nor research, or a record of our trading prices, or an offer of, or solicitation for a transaction in any financial instrument and thus should not be treated as such. The information provided does not involve any specific investment objectives, financial situation and needs of any specific person who may receive it. Please be aware, that past performance is not a reliable indicator of future performance and/or results. Past Performance or Forward-looking scenarios based upon the reasonable beliefs of the third-party provider are not a guarantee of future performance. Actual results may differ materially from those anticipated in forward-looking or past performance statements. IC Markets makes no representation or warranty and assumes no liability as to the accuracy or completeness of the information provided, nor any loss arising from any investment based on a recommendation, forecast or any information supplied by any third-party.
#025: LONG AUD/CAD Investment Opportunity
The AUD/CAD pair has experienced a period of marked weakness in recent weeks, with a sequence of lower highs and lower lows that has consolidated a medium-term bearish trend. However, the latest developments on the H4 chart show the emergence of signals that deserve attention. Hello, I'm Andrea Russo, an independent Forex trader and prop trader with $200,000 in capital under management. Thank you in advance for your time.
🔍 Technical Analysis
After the decline, a key support area can be seen around the psychological threshold of 0.9100, where prices have slowed the bearish pressure.
Momentum indicators (RSI and MACD) show an oversold condition accompanied by a bullish divergence, often a prelude to a technical reversal or at least a pullback.
The latest H4 candles signal the entry of buying volumes, with a consolidation pattern that could transform into a rebound phase.
Australia remains exposed to a moderate economic cycle, but the recent decline in energy commodities has reduced the relative strength of the CAD, which is closely correlated with oil prices.
The Bank of Canada maintains a dovish tone, but the latest macroeconomic data shows signs of an economic slowdown that have dampened the Canadian currency's momentum.
Conversely, global risk sentiment appears to be improving, a factor that tends to favor cyclical currencies like the AUD.
In this scenario, AUD/CAD could begin a pullback phase from recent lows. The natural target lies in the nearest resistance areas, while the holding of current support remains the key to the validity of this scenario.

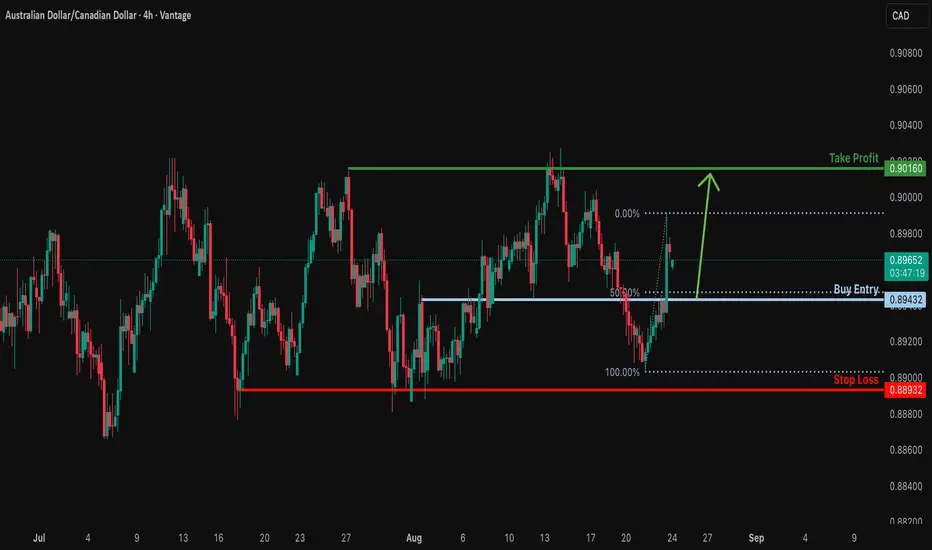
Bullish reversal?AUD/CAD is falling towards the support level, which is an overlap support that lines up with the 50% Fibonacci retracement and could bounce from this level to our take profit.
Entry: 0.89432
Why we like it:
There is an overlap support level that lines up with the 50% Fibonacci retracement.
Stop loss: 0.88932
Why we like it:
There is a multi-swing low support.
Take profit: 0.90160
Why we like it:
There is a multi-swing high resistance.
Enjoying your TradingView experience? Review us!
Please be advised that the information presented on TradingView is provided to Vantage (‘Vantage Global Limited’, ‘we’) by a third-party provider (‘Everest Fortune Group’). Please be reminded that you are solely responsible for the trading decisions on your account. There is a very high degree of risk involved in trading. Any information and/or content is intended entirely for research, educational and informational purposes only and does not constitute investment or consultation advice or investment strategy. The information is not tailored to the investment needs of any specific person and therefore does not involve a consideration of any of the investment objectives, financial situation or needs of any viewer that may receive it. Kindly also note that past performance is not a reliable indicator of future results. Actual results may differ materially from those anticipated in forward-looking or past performance statements. We assume no liability as to the accuracy or completeness of any of the information and/or content provided herein and the Company cannot be held responsible for any omission, mistake nor for any loss or damage including without limitation to any loss of profit which may arise from reliance on any information supplied by Everest Fortune Group.
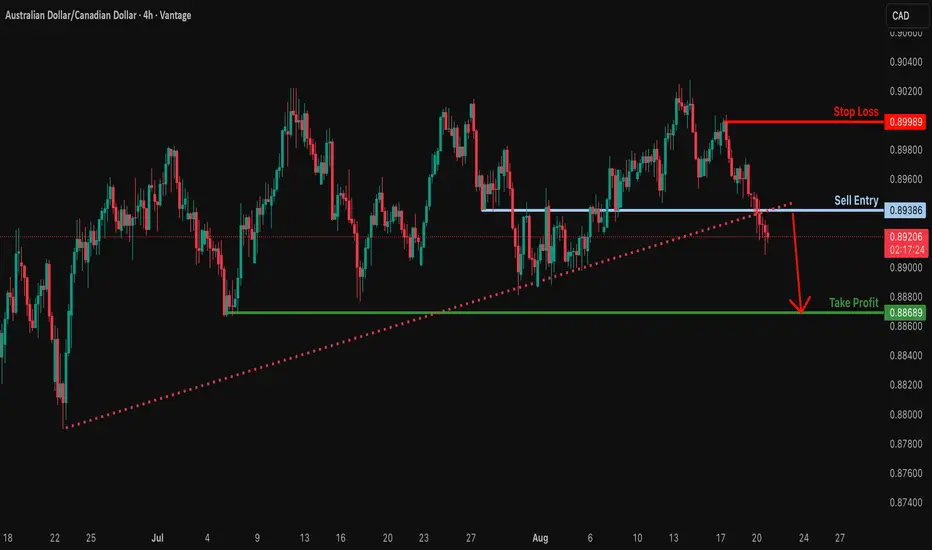
Potential bearish drop?AUD/CAD has broken out of the support leve which is an overlap support and could drop from this level to our take profit.
Entry: 0.89386
Why we like it:
There is an overlap resistance level.
Stop loss: 0.89989
Why we like it:
There is a pullback resistance level.
Take profit: 0.8868
Why we like it:
There is a multi swing low support.
Enjoying your TradingView experience? Review us!
Please be advised that the information presented on TradingView is provided to Vantage (‘Vantage Global Limited’, ‘we’) by a third-party provider (‘Everest Fortune Group’). Please be reminded that you are solely responsible for the trading decisions on your account. There is a very high degree of risk involved in trading. Any information and/or content is intended entirely for research, educational and informational purposes only and does not constitute investment or consultation advice or investment strategy. The information is not tailored to the investment needs of any specific person and therefore does not involve a consideration of any of the investment objectives, financial situation or needs of any viewer that may receive it. Kindly also note that past performance is not a reliable indicator of future results. Actual results may differ materially from those anticipated in forward-looking or past performance statements. We assume no liability as to the accuracy or completeness of any of the information and/or content provided herein and the Company cannot be held responsible for any omission, mistake nor for any loss or damage including without limitation to any loss of profit which may arise from reliance on any information supplied by Everest Fortune Group.