Bearish drop?AUD/JPY is rising towards the pivot, which aligns with the 50% Fibonacci retracement, and could reverse to the 1st support that aligns with the 61.8% Fibonacci retracement.
Pivot: 106.19
1st Support: 105.49
1st Resistance: 106.68
Disclaimer:
The opinions given above constitute general market commentary and do not constitute the opinion or advice of IC Markets or any form of personal or investment advice.
Any opinions, news, research, analyses, prices, other information, or links to third-party sites contained on this website are provided on an "as-is" basis, are intended to be informative only, and are not advice, a recommendation, research, a record of our trading prices, an offer of, or solicitation for, a transaction in any financial instrument and thus should not be treated as such. The information provided does not involve any specific investment objectives, financial situation, or needs of any specific person who may receive it. Please be aware that past performance is not a reliable indicator of future performance and/or results. Past performance or forward-looking scenarios based upon the reasonable beliefs of the third-party provider are not a guarantee of future performance. Actual results may differ materially from those anticipated in forward-looking or past performance statements. IC Markets makes no representation or warranty and assumes no liability as to the accuracy or completeness of the information provided, nor any loss arising from any investment based on a recommendation, forecast, or any information supplied by any third party
Aud

GBPAUD to find sellers at market price?GBPAUD - 24h expiry
Intraday rallies continue to attract sellers and there is no clear indication that this sequence for trading is coming to an end.
Our outlook is bearish.
20 1day EMA is at 2.0118.
Offers ample risk/reward to sell at the market.
There is no clear indication that the downward move is coming to an end.
We look to Sell at 2.0115 (stop at 2.0171)
Our profit targets will be 1.9955 and 1.9925
Resistance: 2.0145 / 2.0189 / 2.0204
Support: 2.0100 / 2.0060 / 2.0028
Risk Disclaimer
The trade ideas beyond this page are for informational purposes only and do not constitute investment advice or a solicitation to trade. This information is provided by Signal Centre, a third-party unaffiliated with OANDA, and is intended for general circulation only. OANDA does not guarantee the accuracy of this information and assumes no responsibilities for the information provided by the third party. The information does not take into account the specific investment objectives, financial situation, or particular needs of any particular person. You should take into account your specific investment objectives, financial situation, and particular needs before making a commitment to trade, including seeking, under a separate engagement, as you deem fit.
You accept that you assume all risks in independently viewing the contents and selecting a chosen strategy.
Where the research is distributed in Singapore to a person who is not an Accredited Investor, Expert Investor or an Institutional Investor, Oanda Asia Pacific Pte Ltd (“OAP“) accepts legal responsibility for the contents of the report to such persons only to the extent required by law. Singapore customers should contact OAP at 6579 8289 for matters arising from, or in connection with, the information/research distributed.

AUDUSD Major bullish break-out after 5 years!The AUDUSD pair broke not just above its 1W MA200 (orange trend-line) but also above its 5-year Lower Highs trend-line that has been holding since February 22 2021, keeping the long-term trend bearish.
Now the long-term trend may be shifting to bullish and ahead of a potential 1W Golden Cross, we expect a pull-back to retest this 5-year Lower Highs trend-line, potentially even the 1W MA50 (blue trend-line) as a Support and then rebound towards the September 2024 Resistance. Our Target is just below it at 0.69000.
---
** Please LIKE 👍, FOLLOW ✅, SHARE 🙌 and COMMENT ✍ if you enjoy this idea! Also share your ideas and charts in the comments section below! This is best way to keep it relevant, support us, keep the content here free and allow the idea to reach as many people as possible. **
---
💸💸💸💸💸💸
👇 👇 👇 👇 👇 👇

AUDUSD H4 | Bullish Bounce OffBased on the H4 chart analysis, we can see that the price has bounced off our buy entry level at 0.6681, which is a pullback support.
Our stop loss is set at 0.6646, which is a pullback support that aligns with the 127.2% Fibonacci retracement.
Our take profit is set at 0.6726, which is a pullback resistance level.
High Risk Investment Warning
Stratos Markets Limited (

Bullish continuation setup?AUD/JPY is falling towards the pivot, which acts as a pullback support that aligns with the 23.6% Fibonacci retracement and could bounce to the 1st resistance.
Pivot: 105.71
1st Support: 105.07
1st Resistance: 106.66
Disclaimer:
The opinions given above constitute general market commentary and do not constitute the opinion or advice of IC Markets or any form of personal or investment advice.
Any opinions, news, research, analyses, prices, other information, or links to third-party sites contained on this website are provided on an "as-is" basis, are intended to be informative only, and are not advice, a recommendation, research, a record of our trading prices, an offer of, or solicitation for, a transaction in any financial instrument and thus should not be treated as such. The information provided does not involve any specific investment objectives, financial situation, or needs of any specific person who may receive it. Please be aware that past performance is not a reliable indicator of future performance and/or results. Past performance or forward-looking scenarios based upon the reasonable beliefs of the third-party provider are not a guarantee of future performance. Actual results may differ materially from those anticipated in forward-looking or past performance statements. IC Markets makes no representation or warranty and assumes no liability as to the accuracy or completeness of the information provided, nor any loss arising from any investment based on a recommendation, forecast, or any information supplied by any third party

Bullish bounce off?AUD/NZD has bounced off the pivot and could rise to the swing high resistance.
Pivot: 1.16119
1st Support: 1.15733
1st Resistance: 1.16949
Disclaimer:
The opinions given above constitute general market commentary and do not constitute the opinion or advice of IC Markets or any form of personal or investment advice.
Any opinions, news, research, analyses, prices, other information, or links to third-party sites contained on this website are provided on an "as-is" basis, are intended to be informative only, and are not advice, a recommendation, research, a record of our trading prices, an offer of, or solicitation for, a transaction in any financial instrument and thus should not be treated as such. The information provided does not involve any specific investment objectives, financial situation, or needs of any specific person who may receive it. Please be aware that past performance is not a reliable indicator of future performance and/or results. Past performance or forward-looking scenarios based upon the reasonable beliefs of the third-party provider are not a guarantee of future performance. Actual results may differ materially from those anticipated in forward-looking or past performance statements. IC Markets makes no representation or warranty and assumes no liability as to the accuracy or completeness of the information provided, nor any loss arising from any investment based on a recommendation, forecast, or any information supplied by any third party

GBPAUD (PENDING LONG)This is the buy trade to take out liquidity... Previous supply already served its purpose it should now get liquidated, I can see it going above 2.02880 but I cant see it going above 2.04742 yet so ill be looking to short this pair after this plays out... The safest stop loss is 1.99592 for this trade tbh.

AUDUSD (Pending Order)This is should be the trade of the week in my take this will be the pullback to start taking 4hr structure lows... We are in the middle of a big timeframe distribution, Very likely to something like this if my analysis is correct about it being a distribution.

Bearish reversal off 50% Fib resistance?Aussie (AUD/USD) is reacting off the pivot and could reverse to the 1st support.
Pivot: 0.6718
1st Support: 0.6661
1st Resistance: 0.6752
Disclaimer:
The opinions given above constitute general market commentary and do not constitute the opinion or advice of IC Markets or any form of personal or investment advice.
Any opinions, news, research, analyses, prices, other information, or links to third-party sites contained on this website are provided on an "as-is" basis, are intended to be informative only, and are not advice, a recommendation, research, a record of our trading prices, an offer of, or solicitation for, a transaction in any financial instrument and thus should not be treated as such. The information provided does not involve any specific investment objectives, financial situation, or needs of any specific person who may receive it. Please be aware that past performance is not a reliable indicator of future performance and/or results. Past performance or forward-looking scenarios based upon the reasonable beliefs of the third-party provider are not a guarantee of future performance. Actual results may differ materially from those anticipated in forward-looking or past performance statements. IC Markets makes no representation or warranty and assumes no liability as to the accuracy or completeness of the information provided, nor any loss arising from any investment based on a recommendation, forecast, or any information supplied by any third party

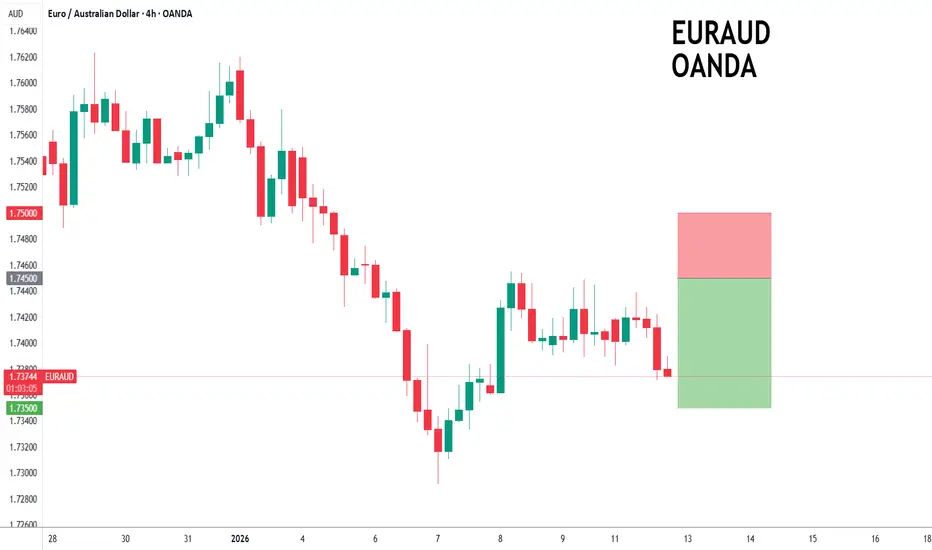
EURAUD to continue in the downward move?EURAUD - 24h expiry
There is no clear indication that the downward move is coming to an end.
Although we remain bearish overall, a correction is possible without impacting the trend lower.
Short term RSI has turned negative.
Risk/Reward would be poor to call a sell from current levels.
The measured move target is 1.7400.
We look to Sell at 1.7450 (stop at 1.7500)
Our profit targets will be 1.7350 and 1.7325
Resistance: 1.7450 / 1.7500 / 1.7510
Support: 1.7400 / 1.7375 / 1.7350
Risk Disclaimer
The trade ideas beyond this page are for informational purposes only and do not constitute investment advice or a solicitation to trade. This information is provided by Signal Centre, a third-party unaffiliated with OANDA, and is intended for general circulation only. OANDA does not guarantee the accuracy of this information and assumes no responsibilities for the information provided by the third party. The information does not take into account the specific investment objectives, financial situation, or particular needs of any particular person. You should take into account your specific investment objectives, financial situation, and particular needs before making a commitment to trade, including seeking, under a separate engagement, as you deem fit.
You accept that you assume all risks in independently viewing the contents and selecting a chosen strategy.
Where the research is distributed in Singapore to a person who is not an Accredited Investor, Expert Investor or an Institutional Investor, Oanda Asia Pacific Pte Ltd (“OAP“) accepts legal responsibility for the contents of the report to such persons only to the extent required by law. Singapore customers should contact OAP at 6579 8289 for matters arising from, or in connection with, the information/research distributed.
AUDUSD is Nearing an Important Support!Hey Traders, in today's trading session we are monitoring AUDUSD for a buying opportunity around 0.66600 zone, AUDUSD is trading in an uptrend and currently is in a correction phase in which it is approaching the trend at 0.66600 support and resistance area.
Trade safe, Joe.

AUSSIE H1 | Bullish ReversalBased on the H1 chart analysis, we could see the price fall to our buy entry level at 0.6690, which is an overlap support.
Our stop loss is set at 0.6667, which is a multi-swing low support.
Our take profit is set at 0.6717, which is an overlap resistance that aligns with the 50% Fibonacci retracement.
High Risk Investment Warning
Stratos Markets Limited (

AUDUSD (Short)This is a good short opportunity, on Friday price failed to take out structure lows it looks like it's deciding to liquidate people who were targeting those lows first... I don't take this trade thinking it will just break that big liquidity today but I see it temporarily pulling back and targeting that TP1 and will decide later if to leave a part of the position run to the full TP.

AUDJPY LONGS UPTREND CONTINUATION 1:1It looks like AUDJPY wants make a next leg up and has found support. Aiming for last highs for a clean 1:1 trade

AUDUSD — FRGNT FUN COUPON FRIDAY DAILY CHART FORECAST📅 Q1 | D9 | W1 | Y26
📊 AUDUSD — FRGNT FUN COUPON FRIDAY DAILY CHART FORECAST
🔍 Analysis Approach
I’m applying a developed version of Smart Money Concepts, with a structured focus on:
• Identifying Key Points of Interest (POIs) on Higher Time Frames (HTFs) 🕰️
• Using those POIs to define a clear and controlled trading range 📐
• Refining those zones on Lower Time Frames (LTFs) 🔎
• Waiting for a Break of Structure (BoS) as confirmation ✅
This process keeps me precise, disciplined, and aligned with market narrative, rather than reacting emotionally or chasing price.
💡 My Motto
“Capital management, discipline, and consistency in your trading edge.”
A positive risk-to-reward ratio, combined with a high-probability execution model, is the backbone of any sustainable trading plan 📈🔐
⚠️ On Losses
Losses are part of the mathematical reality of trading 🎲
They don’t define you — they are necessary, expected, and managed.
We acknowledge them, learn, and move forward 📊➡️
🙏 I appreciate you taking the time to review my Daily Forecast.
Further context and supporting material can be found in the Links section.
Stay sharp 🧠
Stay consistent 🎯
Protect your capital 🔐
— FRGNT 🚀📈
FX:AUDUSD

AUD/USD H1 | Bullish Reversal SetupBased on the H1 chart analysis, we can see that the price has bounced off our buy entry level at 0.6683, which aligns with the 78.6% Fibonacci retracement.
Our stop loss is set at 0.6660, which is a pullback support.
Our take profit is set at 0.6717, which is an overlap resistance that is slightly above the 38.2% Fibonacci retracement.
High Risk Investment Warning
Stratos Markets Limited (

Heading towards 38.2% Fib resistance?EUR/AUD is rising towards the pivot, which has been identified as a pullback resistance that aligns with the 38.2% Fibonacci retracement and could drop to the 1st support.
Pivot: 1.74971
1st Support: 1.73126
1st Resistance: 1.75919
Disclaimer:
The opinions given above constitute general market commentary and do not constitute the opinion or advice of IC Markets or any form of personal or investment advice.
Any opinions, news, research, analyses, prices, other information, or links to third-party sites contained on this website are provided on an "as-is" basis, are intended to be informative only, and are not advice, a recommendation, research, a record of our trading prices, an offer of, or solicitation for, a transaction in any financial instrument and thus should not be treated as such. The information provided does not involve any specific investment objectives, financial situation, or needs of any specific person who may receive it. Please be aware that past performance is not a reliable indicator of future performance and/or results. Past performance or forward-looking scenarios based upon the reasonable beliefs of the third-party provider are not a guarantee of future performance. Actual results may differ materially from those anticipated in forward-looking or past performance statements. IC Markets makes no representation or warranty and assumes no liability as to the accuracy or completeness of the information provided, nor any loss arising from any investment based on a recommendation, forecast, or any information supplied by any third party

Could we see a drop from here?AUD/JPY is reacting off the pivot which is a pullback resistance and could drop to the 50% Fibonacci support.
Pivot: 105.12
1st Support: 104
1st Resistance: 105.94
Disclaimer:
The opinions given above constitute general market commentary and do not constitute the opinion or advice of IC Markets or any form of personal or investment advice.
Any opinions, news, research, analyses, prices, other information, or links to third-party sites contained on this website are provided on an "as-is" basis, are intended to be informative only, and are not advice, a recommendation, research, a record of our trading prices, an offer of, or solicitation for, a transaction in any financial instrument and thus should not be treated as such. The information provided does not involve any specific investment objectives, financial situation, or needs of any specific person who may receive it. Please be aware that past performance is not a reliable indicator of future performance and/or results. Past performance or forward-looking scenarios based upon the reasonable beliefs of the third-party provider are not a guarantee of future performance. Actual results may differ materially from those anticipated in forward-looking or past performance statements. IC Markets makes no representation or warranty and assumes no liability as to the accuracy or completeness of the information provided, nor any loss arising from any investment based on a recommendation, forecast, or any information supplied by any third party

Bullish bounce off?AUD/USD has bounced off the support level, which is a pullback support that aligns with the 78.6% Fibonacci retracement, and could bounce from this level to our take profit.
Entry: 0.6685
Why we like it:
There is a pullback support that aligns with the 78.6% Fibonacci retracement.
Stop loss: 0.6665
Why we like it:
There is a multi-swing low support.
Take profit: 0.6712
Why we like it:
There is a pullback resistance that aligns with the 38.2% Fibonacci retracement.
Enjoying your TradingView experience? Review us!
Please be advised that the information presented on TradingView is provided to Vantage (‘Vantage Global Limited’, ‘we’) by a third-party provider (‘Everest Fortune Group’). Please be reminded that you are solely responsible for the trading decisions on your account. There is a very high degree of risk involved in trading. Any information and/or content is intended entirely for research, educational and informational purposes only and does not constitute investment or consultation advice or investment strategy. The information is not tailored to the investment needs of any specific person and therefore does not involve a consideration of any of the investment objectives, financial situation or needs of any viewer that may receive it. Kindly also note that past performance is not a reliable indicator of future results. Actual results may differ materially from those anticipated in forward-looking or past performance statements. We assume no liability as to the accuracy or completeness of any of the information and/or content provided herein and the Company cannot be held responsible for any omission, mistake nor for any loss or damage including without limitation to any loss of profit which may arise from reliance on any information supplied by Everest Fortune Group.

Bearish drop off?Aussie (AUD/USD) is reacting off the pivot and could drop to the overlap support that aligns with the 61.8% Fibonacci retracement.
Pivot: 0.6718
1st Support: 0.6666
1st Resistance: 0.6752
Disclaimer:
The opinions given above constitute general market commentary and do not constitute the opinion or advice of IC Markets or any form of personal or investment advice.
Any opinions, news, research, analyses, prices, other information, or links to third-party sites contained on this website are provided on an "as-is" basis, are intended to be informative only, and are not advice, a recommendation, research, a record of our trading prices, an offer of, or solicitation for, a transaction in any financial instrument and thus should not be treated as such. The information provided does not involve any specific investment objectives, financial situation, or needs of any specific person who may receive it. Please be aware that past performance is not a reliable indicator of future performance and/or results. Past performance or forward-looking scenarios based upon the reasonable beliefs of the third-party provider are not a guarantee of future performance. Actual results may differ materially from those anticipated in forward-looking or past performance statements. IC Markets makes no representation or warranty and assumes no liability as to the accuracy or completeness of the information provided, nor any loss arising from any investment based on a recommendation, forecast, or any information supplied by any third party

AUDUSD (Short Bias)The sell is still forming and yesterday price decided to do 1 more spike up above the consolidation box. The new data printed makes me think there wont be a retest of the consolidation, based on the type of schematic it printed this might be the type that just leaves a supply for future incentivized shorts.

GBPAUD RANGE TRADE LONGGBPAUD has found support at the bottom of this range - we can see mutiple attempts to break lower failed.
This also combined with on the weekly time frame the 100MA support has been found supporting my bias for longs.

Bullish bounce setup?AUD/JPY is falling towards the support level, which is an overlap support that aligns with the 38.2% Fibonacci retracement and could bounce from this level to our take profit.
Entry: 104.60
Why we like it:
There is an overlap support that aligns with the 38.2% Fibonacci retracement.
Stop loss: 104.02
Why we like it:
There is an overlap support level that aligns with the 50% Fibonacci retracement.
Take profit: 105.75
Why we like it:
There is a swing high resistance.
Enjoying your TradingView experience? Review us!
Please be advised that the information presented on TradingView is provided to Vantage (‘Vantage Global Limited’, ‘we’) by a third-party provider (‘Everest Fortune Group’). Please be reminded that you are solely responsible for the trading decisions on your account. There is a very high degree of risk involved in trading. Any information and/or content is intended entirely for research, educational and informational purposes only and does not constitute investment or consultation advice or investment strategy. The information is not tailored to the investment needs of any specific person and therefore does not involve a consideration of any of the investment objectives, financial situation or needs of any viewer that may receive it. Kindly also note that past performance is not a reliable indicator of future results. Actual results may differ materially from those anticipated in forward-looking or past performance statements. We assume no liability as to the accuracy or completeness of any of the information and/or content provided herein and the Company cannot be held responsible for any omission, mistake nor for any loss or damage including without limitation to any loss of profit which may arise from reliance on any information supplied by Everest Fortune Group.
