AUDUSD (Structure High Broken)The Sells just got liquidated and there was a sharp break of structure higher high, a sell might form for tomorrow. If the consolidation does happen I think we will see a deep pullback tomorrow during red high impact news for AUD. Anyways the sells are too risky and early and price hasn't given structure for a sell with a protected high yet... This is the waiting period for structure to form. So this week I am looking for a buying opportunity because the structure sells just got invalidated, the week just started so that buy might happen at the end of the week if my analysis is correct.
Aud

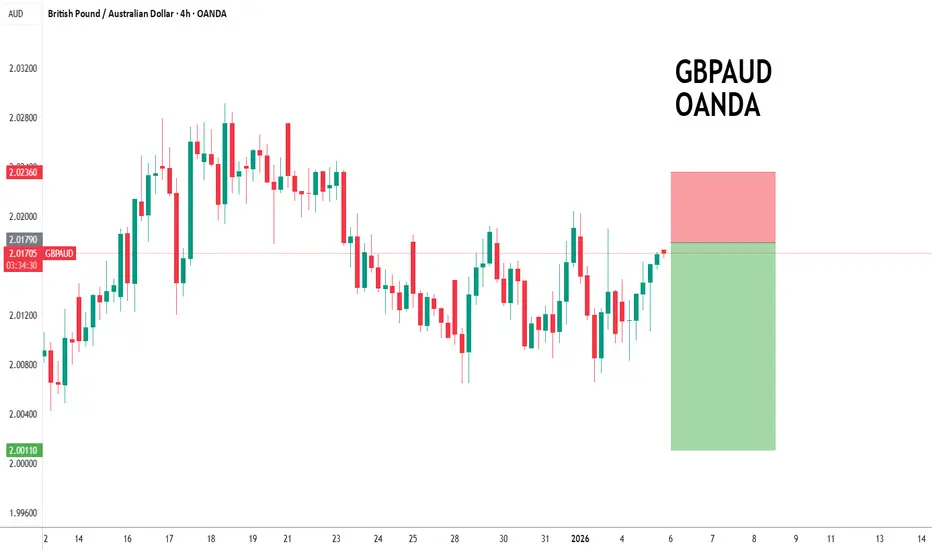
GBPAUD to find resistance at current market price?GBPAUD - 24h expiry
Intraday rallies continue to attract sellers and there is no clear indication that this sequence for trading is coming to an end.
2.0204 has been pivotal.
Bespoke resistance is located at 2.0190.
We look for a temporary move higher.
Preferred trade is to sell into rallies.
We look to Sell at 2.0179 (stop at 2.0236)
Our profit targets will be 2.0011 and 1.9971
Resistance: 2.0163 / 2.0204 / 2.0240
Support: 2.0100 / 2.0065 / 2.0000
Risk Disclaimer
The trade ideas beyond this page are for informational purposes only and do not constitute investment advice or a solicitation to trade. This information is provided by Signal Centre, a third-party unaffiliated with OANDA, and is intended for general circulation only. OANDA does not guarantee the accuracy of this information and assumes no responsibilities for the information provided by the third party. The information does not take into account the specific investment objectives, financial situation, or particular needs of any particular person. You should take into account your specific investment objectives, financial situation, and particular needs before making a commitment to trade, including seeking, under a separate engagement, as you deem fit.
You accept that you assume all risks in independently viewing the contents and selecting a chosen strategy.
Where the research is distributed in Singapore to a person who is not an Accredited Investor, Expert Investor or an Institutional Investor, Oanda Asia Pacific Pte Ltd (“OAP“) accepts legal responsibility for the contents of the report to such persons only to the extent required by law. Singapore customers should contact OAP at 6579 8289 for matters arising from, or in connection with, the information/research distributed.
Bearish breakout?EUR/AUD could rise towards the resistance level, which serves as a pullback resistance and could potentially reverse from this level to our take-profit target.
Entry: 1.75039
Why we like it:
There is a pullback resistance level.
Stop loss: 1.76344
Why we like it:
There is a pullback resistance level.
Take profit: 1.72940
Why we like it:
There is a support level at the 100% Fibonacci projection.
Enjoying your TradingView experience? Review us!
Please be advised that the information presented on TradingView is provided to Vantage (‘Vantage Global Limited’, ‘we’) by a third-party provider (‘Everest Fortune Group’). Please be reminded that you are solely responsible for the trading decisions on your account. There is a very high degree of risk involved in trading. Any information and/or content is intended entirely for research, educational and informational purposes only and does not constitute investment or consultation advice or investment strategy. The information is not tailored to the investment needs of any specific person and therefore does not involve a consideration of any of the investment objectives, financial situation or needs of any viewer that may receive it. Kindly also note that past performance is not a reliable indicator of future results. Actual results may differ materially from those anticipated in forward-looking or past performance statements. We assume no liability as to the accuracy or completeness of any of the information and/or content provided herein and the Company cannot be held responsible for any omission, mistake nor for any loss or damage including without limitation to any loss of profit which may arise from reliance on any information supplied by Everest Fortune Group.

AUDUSD (Short)The pair is still on a Uptrend its currently looking like its in the process of making a Higher Low, There is a good risk to reward trade presenting itself but it is Friday the last day of the trading week I don't like holding trades over the weekend but in this pair it is common for a weekly low or high to be set on Friday... Spreads suck especially on a sell order during market close or open the spread alone can hit your stop loss, so unless this trade is in profit by a big margin I don't recommend holding on Friday just my opinion from experience.

Bearish drop?Aussie (AUD/USD) has reacted off the pivot and could drop to the 1st support, which aligns with the 100% Fibonacci projection.
Pivot: 0.6685
1st Support: 0.6633
1st Resistance: 0.6721
Disclaimer:
The opinions given above constitute general market commentary and do not constitute the opinion or advice of IC Markets or any form of personal or investment advice.
Any opinions, news, research, analyses, prices, other information, or links to third-party sites contained on this website are provided on an "as-is" basis, are intended to be informative only, and are not advice, a recommendation, research, a record of our trading prices, an offer of, or solicitation for, a transaction in any financial instrument and thus should not be treated as such. The information provided does not involve any specific investment objectives, financial situation, or needs of any specific person who may receive it. Please be aware that past performance is not a reliable indicator of future performance and/or results. Past performance or forward-looking scenarios based upon the reasonable beliefs of the third-party provider are not a guarantee of future performance. Actual results may differ materially from those anticipated in forward-looking or past performance statements. IC Markets makes no representation or warranty and assumes no liability as to the accuracy or completeness of the information provided, nor any loss arising from any investment based on a recommendation, forecast, or any information supplied by any third party

Bearish reversal setup?AUD/CAD is rising towards the resistance level which is a pullback resistance that lines up with the 50% Fibonacci retracement and could reverse from this level to our take profit.
Entry: 0.9165
Why we like it:
There is a pullback resistance that aligns with the 50% Fibonacci retracement.
Stop loss: 0.9183
Why we like it:
There is a pullback resistance level.
Take profit: 0.91312
Why we like it:
There is a pullback support that is slightly above the 61.8% Fibonacci retracement
Enjoying your TradingView experience? Review us!
Please be advised that the information presented on TradingView is provided to Vantage (‘Vantage Global Limited’, ‘we’) by a third-party provider (‘Everest Fortune Group’). Please be reminded that you are solely responsible for the trading decisions on your account. There is a very high degree of risk involved in trading. Any information and/or content is intended entirely for research, educational and informational purposes only and does not constitute investment or consultation advice or investment strategy. The information is not tailored to the investment needs of any specific person and therefore does not involve a consideration of any of the investment objectives, financial situation or needs of any viewer that may receive it. Kindly also note that past performance is not a reliable indicator of future results. Actual results may differ materially from those anticipated in forward-looking or past performance statements. We assume no liability as to the accuracy or completeness of any of the information and/or content provided herein and the Company cannot be held responsible for any omission, mistake nor for any loss or damage including without limitation to any loss of profit which may arise from reliance on any information supplied by Everest Fortune Group.

AUDUSD: Bullish Pullback Within Uptrend!!Hey Traders,
In today’s trading session, we are monitoring AUDUSD for a potential buying opportunity around the 0.66500 zone.
Technically, AUDUSD continues to trade within a well-defined uptrend and is currently in a healthy correction phase. Price is approaching the 0.66500 support zone, which coincides with trend support and a key structure level — an area where buyers have previously stepped in.
As long as this level holds, the broader bullish bias remains valid, with pullbacks seen as potential continuation setups rather than reversals.
Trade safe,
Joe

Aussie Bull Run: Why AUD Futures Are the 2026 Trade to WatchThe March 2026 Australian dollar (A6H26) futures have emerged as a premier opportunity for currency traders. As of late December 2025, prices have surged to new contract highs, supported by a perfect storm of technical and fundamental catalysts. For the modern trader, the "Aussie" is no longer just a proxy for copper; it is a sophisticated bet on global technology and fiscal shifts.
Technical Mastery and MACD Momentum
The daily bar chart for A6H26 reveals a textbook bullish trend. Prices recently breached key resistance, establishing a solid floor for further appreciation. Technical analysts point to the Moving Average Convergence Divergence (MACD) , which remains in a strong posture. The MACD line sits comfortably above the signal line, with both trending higher.
The path of least resistance is clearly upward. A sustained move above the. 6729 contract high activates a buy signal for many institutional desks. Traders are now eyeing a primary price objective of 6950 . To manage risk, professional stops are typically placed just below support 6625 , ensuring a disciplined approach to this high-conviction setup.
Macroeconomics: The Fed’s Dovish Pivot
A primary driver for the Australian dollar's strength is the diverging path of global central banks. The U.S. Federal Reserve has transitioned toward a more accommodative stance to support labor markets. Lower U.S. interest rates naturally weigh on the Greenback, making high-yielding currencies like the AUD more attractive to international carry traders.
Conversely, the Reserve Bank of Australia (RBA) maintains a hawkish bias. Persistent domestic inflation and a resilient job market have forced Australian policymakers to keep rates elevated. This widening interest rate differential acts as a powerful magnet for global capital, fueling the "long Aussie" trade into 2026.
Geostrategy: Powering the AI Revolution
Australia’s geostrategy has shifted from traditional mining to securing the "Green and Digital" transition. The nation is a critical supplier of lithium, copper, and rare earths , the literal building blocks of AI data centers and renewable energy. As global demand for computing power explodes, Australia’s trade balance benefits from a structural "AI premium."
Furthermore, the Australian government is aggressively implementing blockchain-based supply chain tech . These innovations reduce friction at the border and enhance the security of resource exports. By leading in "High-Tech Mining," Australia ensures its currency remains a vital asset in the global technological race.
Professional Note: Success in AUD futures requires monitoring both the RBA’s tone and China’s industrial demand. While the technicals suggest a move to .6950, stay alert for any sudden shifts in global risk appetite that could spark short-term volatility.

AUDUSD H1 | Bearish DropBased on the H1 chart analysis, we could see the price rise to the sell entry level at 0.6697, which is a pullback resistance.
Our stop loss is set at 0.6716, which is a pullback resistance.
Our take profit is set at 0.6656, which is a pullback support that aligns with the 50% Fibonacci retracement
High Risk Investment Warning
Stratos Markets Limited (

Bullish reversal setup?EUR/AUD is reacting off the pivot and could bounce to the 1st resistance.
Pivot: 1.75398
1st Resistance: 1.76062
1st Support: 1.75061
Disclaimer:
The opinions given above constitute general market commentary and do not constitute the opinion or advice of IC Markets or any form of personal or investment advice.
Any opinions, news, research, analyses, prices, other information, or links to third-party sites contained on this website are provided on an "as-is" basis, are intended to be informative only, and are not advice, a recommendation, research, a record of our trading prices, an offer of, or solicitation for, a transaction in any financial instrument and thus should not be treated as such. The information provided does not involve any specific investment objectives, financial situation, or needs of any specific person who may receive it. Please be aware that past performance is not a reliable indicator of future performance and/or results. Past performance or forward-looking scenarios based upon the reasonable beliefs of the third-party provider are not a guarantee of future performance. Actual results may differ materially from those anticipated in forward-looking or past performance statements. IC Markets makes no representation or warranty and assumes no liability as to the accuracy or completeness of the information provided, nor any loss arising from any investment based on a recommendation, forecast, or any information supplied by any third party

Bullish bounce off?AUD/JPY has bounced off the pivot, which is a pullback support, and could rise to the 1st resistance, which aligns with the 127.2% Fibonacci extension.
Pivot: 104.26
1st Support: 103.43
1st Resistance: 105.48
Disclaimer:
The opinions given above constitute general market commentary and do not constitute the opinion or advice of IC Markets or any form of personal or investment advice.
Any opinions, news, research, analyses, prices, other information, or links to third-party sites contained on this website are provided on an "as-is" basis, are intended to be informative only, and are not advice, a recommendation, research, a record of our trading prices, an offer of, or solicitation for, a transaction in any financial instrument and thus should not be treated as such. The information provided does not involve any specific investment objectives, financial situation, or needs of any specific person who may receive it. Please be aware that past performance is not a reliable indicator of future performance and/or results. Past performance or forward-looking scenarios based upon the reasonable beliefs of the third-party provider are not a guarantee of future performance. Actual results may differ materially from those anticipated in forward-looking or past performance statements. IC Markets makes no representation or warranty and assumes no liability as to the accuracy or completeness of the information provided, nor any loss arising from any investment based on a recommendation, forecast, or any information supplied by any third party

Bearish drop off?AUD/JPY could rise towards the resistance level which is an overlap resistance and could reverse from this level to our take profit.
Entry: 104.69
Why we like it:
There is an overlap resistance level.
Stop loss: 105.18
Why we like it:
There is a swing high resistance level.
Take profit: 104.02
Why we like it:
There is an overlap support levle that is slightly below the 38.2% Fibonacci retracement.
Enjoying your TradingView experience? Review us!
Please be advised that the information presented on TradingView is provided to Vantage (‘Vantage Global Limited’, ‘we’) by a third-party provider (‘Everest Fortune Group’). Please be reminded that you are solely responsible for the trading decisions on your account. There is a very high degree of risk involved in trading. Any information and/or content is intended entirely for research, educational and informational purposes only and does not constitute investment or consultation advice or investment strategy. The information is not tailored to the investment needs of any specific person and therefore does not involve a consideration of any of the investment objectives, financial situation or needs of any viewer that may receive it. Kindly also note that past performance is not a reliable indicator of future results. Actual results may differ materially from those anticipated in forward-looking or past performance statements. We assume no liability as to the accuracy or completeness of any of the information and/or content provided herein and the Company cannot be held responsible for any omission, mistake nor for any loss or damage including without limitation to any loss of profit which may arise from reliance on any information supplied by Everest Fortune Group.

GBPUSD Pullback Toward 1.34500 Keeps Bullish Trend in Play!Hey Traders,
In tomorrow's trading session, we are monitoring GBPUSD for a potential buying opportunity around the 1.34500 zone.
The pair remains in a well-established uptrend and is currently undergoing a controlled correction. Price is approaching the 1.34500 area, a key zone where trendline support converges with a former support/resistance level, making it a technically important area to watch.
As long as this level holds, the broader bullish structure remains intact, and a constructive reaction here could open the door for a continuation toward higher levels.
Trade safe,
Joe

AUDUSD H4 | Bullish Momentum To Extend FurtherThe price could fall to our buy entry level at 0.6674, which is a pullback support that aligns with the 38.2% Fibonacci retracement.
Our take profit is at 0.6744, which aligns with the 161.8% Fibonacci extension.
Our stop loss is at 0.6646, which is a pullback support that aligns with the 61.8% Fibonacci retracement.
High Risk Investment Warning
Stratos Markets Limited (

Bullish bounce?Aussie (AUD/USD) is falling towards the pivot and could bounce to the 1st resistance.
Pivot: 0.6582
1st Support: 0.6404
1st Resistance: 0.6798
Disclaimer:
The opinions given above constitute general market commentary and do not constitute the opinion or advice of IC Markets or any form of personal or investment advice.
Any opinions, news, research, analyses, prices, other information, or links to third-party sites contained on this website are provided on an "as-is" basis, are intended to be informative only, and are not advice, a recommendation, research, a record of our trading prices, an offer of, or solicitation for, a transaction in any financial instrument and thus should not be treated as such. The information provided does not involve any specific investment objectives, financial situation, or needs of any specific person who may receive it. Please be aware that past performance is not a reliable indicator of future performance and/or results. Past performance or forward-looking scenarios based upon the reasonable beliefs of the third-party provider are not a guarantee of future performance. Actual results may differ materially from those anticipated in forward-looking or past performance statements. IC Markets makes no representation or warranty and assumes no liability as to the accuracy or completeness of the information provided, nor any loss arising from any investment based on a recommendation, forecast, or any information supplied by any third party

EURAUD, Huge Formation, WEDGE to Setup BEARISH BREAKOUT!Hello There!
Welcome to my new analysis of EURAUD from the 4-hour timeframe perspective. In recent times the EXY, European Currency Index has shown up with crucial bearish inclinations which are pointing to a bearish market sentiment especially with massive inflation spreading like wildfire seemingly not reacting to exponential rate hikes pulled out by the ECB. Such developments could point to a major bearish setup emerging for the EURAUD also. Besides that, there are important formational structures that need to be considered here. In this case, it is necessary to determine the final completions and changes within the market before rushing to anything else.
Formational Developments, Resistance, Bearish Momentum, and Setup:
When looking at my chart now EURAUD continued to form this preceding huge bearish descending channel trend in which it already pulled back several times bearishly off the upper boundary increasing the high possibility likelihood of such pullbacks to holding on and printing the next bearish waves with continued lower lows to be determined. Especially as EURAUD already pulled back several times from the 65-EMA in red as well as the 35-EMA in grey these EMAs are substantial resistances from where continued pullbacks are more likely than anything else. Currently, EURAUD is approaching the EMAs together with the upper boundary resistance of the channel once again which is pointing to the next bearish wave to set up from here on.
Upcoming Determinations, Bearish Breakout, Target Activation, and Underlying Drivers:
Furthermore, what is the most important formation in my whole chart is this crucial descending wedge formation. Such a formation is pointing to an increased continuation toward the bearish direction in almost all of the cases. This formation will be completed with a final breakout below the lower boundary as it is marked within my chart and as EURAUD already completed the wave-count within the formation this final breakout is likely to emerge within the near future. Once the breakout has shown up as it is marked this is going to be the origin of the wave C extension and bearish momentum acceleration as it is marked. Once this wave C acceleration and bearish wave has shown up it is going to activate the final target zone as marked.
Once this final target zone has been reached further assumptions need to be made. The pair is on my watchlist to determine important changes once they have shown up here, especially with the target projections and bearish developments to be expected. Especially, a massive inflation increase together with failed monetary policies are going to fuel a bearish momentum inclination here therefore these underlying factors also need to be considered then.
In this manner, thank you everybody for watching my analysis of CHFAUD. Support from your side is greatly appreciated.
VP

AUDUSD (daily)The price has broken the wedge, which means it is likely to rise by the full length of the AB=CD pattern.

AUDUSD Pullback Meets Trend Support as USD Headwinds Build!!Hey Traders,
In the coming week, we are monitoring AUDUSD for a potential buying opportunity around the 0.66400 zone.
From a technical perspective, the pair remains in a clear uptrend and is currently in a corrective phase, with price retracing toward a key confluence area around 0.66400, where trend support and a former support/resistance zone intersect.
On the macro side, the US Dollar continues to face growing headwinds. Recent data has reinforced signs of cooling momentum in the US economy, keeping the pressure on the Fed. While December is largely priced, January’s FOMC meeting is increasingly in focus, with current data suggesting that a rate cut could come back into play should economic softness persist. This backdrop favors continued USD weakness, supporting higher-beta currencies such as the Australian dollar.
A constructive reaction around 0.66400 would keep the broader bullish structure intact and open the door for continuation toward recent highs.
Wishing everyone a Merry Christmas and a safe trading week ahead 🎄
Trade safe,
Joe

Bearish drop off?Aussie (AUD/USD) is reacting off the pivot and could drop to the pullback support.
Pivot: 0.6707
1st Support: 0.6679
1st Resistance: 0.67166
Disclaimer:
The opinions given above constitute general market commentary and do not constitute the opinion or advice of IC Markets or any form of personal or investment advice.
Any opinions, news, research, analyses, prices, other information, or links to third-party sites contained on this website are provided on an "as-is" basis, are intended to be informative only, and are not advice, a recommendation, research, a record of our trading prices, an offer of, or solicitation for, a transaction in any financial instrument and thus should not be treated as such. The information provided does not involve any specific investment objectives, financial situation, or needs of any specific person who may receive it. Please be aware that past performance is not a reliable indicator of future performance and/or results. Past performance or forward-looking scenarios based upon the reasonable beliefs of the third-party provider are not a guarantee of future performance. Actual results may differ materially from those anticipated in forward-looking or past performance statements. IC Markets makes no representation or warranty and assumes no liability as to the accuracy or completeness of the information provided, nor any loss arising from any investment based on a recommendation, forecast, or any information supplied by any third party

Bullish continuation off key support?AUD/CAD could fall towards the support level, which is an overlap support, and then bounce from this level to our take profit.
Entry: 0.9155
Why we like it:
There is an overlap support level.
Stop loss: 0.91421
Why we like it:
There is a pullback support that is slightly above the 50% Fibonacci retracement.
Take profit: 0.91868
Why we like it:
There is an overlap resistance level.
Enjoying your TradingView experience? Review us!
Please be advised that the information presented on TradingView is provided to Vantage (‘Vantage Global Limited’, ‘we’) by a third-party provider (‘Everest Fortune Group’). Please be reminded that you are solely responsible for the trading decisions on your account. There is a very high degree of risk involved in trading. Any information and/or content is intended entirely for research, educational and informational purposes only and does not constitute investment or consultation advice or investment strategy. The information is not tailored to the investment needs of any specific person and therefore does not involve a consideration of any of the investment objectives, financial situation or needs of any viewer that may receive it. Kindly also note that past performance is not a reliable indicator of future results. Actual results may differ materially from those anticipated in forward-looking or past performance statements. We assume no liability as to the accuracy or completeness of any of the information and/or content provided herein and the Company cannot be held responsible for any omission, mistake nor for any loss or damage including without limitation to any loss of profit which may arise from reliance on any information supplied by Everest Fortune Group.

#047: Short Investment Opportunity on GBP/AUD
The GBP/AUD exchange rate is currently in a particularly interesting technical phase, characterized by a structure that deserves attention from those who analyze the market with a professional, non-reactive approach. The recent movement displays all the typical characteristics of a corrective rally rather than a genuine directional impulse, suggesting that the market is working more on redistributing liquidity than building a new uptrend.
From a structural perspective, the price is operating in an area definable as "premium," where institutional traders historically tend to reduce long exposures and build opposite positions. The lack of acceleration, combined with a progressive loss of momentum, reinforces the hypothesis that the current movement is incentivizing late retail entry rather than supporting a directional continuation.
Price action analysis highlights signs of absorption at the upper end of the structure. Candlesticks show progressive rejections and the price's inability to consolidate above key areas, a behavior typical of distribution phases. In these contexts, the market does not need to decline immediately: it often trades sideways or with small, controlled increases, precisely to accumulate the liquidity necessary for the next move.
From a volume perspective, the picture is also consistent. Volumes do not convincingly accompany the rise, and the areas of greatest trading are located above the current price, suggesting that the most significant participation occurred in higher areas. This type of configuration tends to favor, over time, a price reversion to underlying areas of inefficiency, where liquidity is not yet fully explored.
Retail sentiment, cross-referenced across multiple sources, appears balanced and free of extremes. This is particularly important: the absence of an unbalanced positioning eliminates the risk of sudden contrarian movements and leaves room for a dynamic driven primarily by the technical structure and liquidity management. In other words, it is not sentiment that drives the market in this phase, but rather the logic of price.
On the macro and intermarket levels, the cross reflects a period of relative uncertainty, with neither currency expressing enough dominance to justify impulsive movements. This reinforces the idea of an environment favorable to mean reversion trades and re-entries toward equilibrium areas, rather than aggressive directional extensions.
In short, GBP/AUD is in a configuration that, from an institutional perspective, is typically associated with distribution phases and potential subsequent corrective movements. As always, the key is not to anticipate the market, but to wait for the price to provide confirmation through the behavior of the candlesticks and the structure. In these contexts, patience and operational discipline make the difference between a theoretically correct analysis and a truly professionally executed trade.
The market shouldn't be chased: it should be read. And when the structure speaks clearly, the trader's job is not to predict, but to recognize.

AUDUSD H4 | Bulish Bounce OffMomentum: Bullish
Price has bounced off the buy entry, which has been identified as a pullback support.
Buy Entry: 0.6612
Pullback support
Stop Loss: 0.6573
Below pullback support
Take Profit: 0.6686
Swing high resistance
High Risk Investment Warning
Stratos Markets Limited (tradu.com ), Stratos Europe Ltd (tradu.com ):
CFDs are complex instruments and come with a high risk of losing money rapidly due to leverage. 70% of retail investor accounts lose money when trading CFDs with this provider. You should consider whether you understand how CFDs work and whether you can afford to take the high risk of losing your money.
Stratos Global LLC (tradu.com ): Losses can exceed deposits.
Please be advised that the information presented on TradingView is provided to Tradu (‘Company’, ‘we’) by a third-party provider (‘TFA Global Pte Ltd’). Please be reminded that you are solely responsible for the trading decisions on your account. Any information and/or content is intended entirely for research, educational and informational purposes only and does not constitute investment or consultation advice or investment strategy. The information is not tailored to the investment needs of any specific person and therefore does not involve a consideration of any of the investment objectives, financial situation or needs of any viewer that may receive it. Past performance is not a reliable indicator of future results. Actual results may differ materially from those anticipated in forward-looking or past performance statements. We assume no liability as to the accuracy or completeness of any of the information and/or content provided herein and the Company cannot be held responsible for any omission, mistake nor for any loss or damage including without limitation to any loss of profit which may arise from reliance on any information supplied by TFA Global Pte Ltd.

Bearish reversal off key resistance?AUD/CAD is rising towards the pivot which acts as an overlap resistance and could reverse to the 1st support.
Pivot: 0.91873
1st Support: 0.91467
1st Resistance: 0.92053
Disclaimer:
The opinions given above constitute general market commentary and do not constitute the opinion or advice of IC Markets or any form of personal or investment advice.
Any opinions, news, research, analyses, prices, other information, or links to third-party sites contained on this website are provided on an "as-is" basis, are intended to be informative only, and are not advice, a recommendation, research, a record of our trading prices, an offer of, or solicitation for, a transaction in any financial instrument and thus should not be treated as such. The information provided does not involve any specific investment objectives, financial situation, or needs of any specific person who may receive it. Please be aware that past performance is not a reliable indicator of future performance and/or results. Past performance or forward-looking scenarios based upon the reasonable beliefs of the third-party provider are not a guarantee of future performance. Actual results may differ materially from those anticipated in forward-looking or past performance statements. IC Markets makes no representation or warranty and assumes no liability as to the accuracy or completeness of the information provided, nor any loss arising from any investment based on a recommendation, forecast, or any information supplied by any third party
