Bearish reversal off key resistance?AUD/CAD is rising towards the pivot which acts as an overlap resistance and could reverse to the 1st support.
Pivot: 0.91873
1st Support: 0.91467
1st Resistance: 0.92053
Disclaimer:
The opinions given above constitute general market commentary and do not constitute the opinion or advice of IC Markets or any form of personal or investment advice.
Any opinions, news, research, analyses, prices, other information, or links to third-party sites contained on this website are provided on an "as-is" basis, are intended to be informative only, and are not advice, a recommendation, research, a record of our trading prices, an offer of, or solicitation for, a transaction in any financial instrument and thus should not be treated as such. The information provided does not involve any specific investment objectives, financial situation, or needs of any specific person who may receive it. Please be aware that past performance is not a reliable indicator of future performance and/or results. Past performance or forward-looking scenarios based upon the reasonable beliefs of the third-party provider are not a guarantee of future performance. Actual results may differ materially from those anticipated in forward-looking or past performance statements. IC Markets makes no representation or warranty and assumes no liability as to the accuracy or completeness of the information provided, nor any loss arising from any investment based on a recommendation, forecast, or any information supplied by any third party
Aud

EURAUD to find buyers at market price?EURAUD - 24h expiry
There is no clear indication that the upward move is coming to an end.
Although we remain bullish overall, a correction is possible with plenty of room to move lower without impacting the trend higher.
Risk/Reward would be poor to call a buy from current levels.
A move through 1.7650 will confirm the bullish momentum.
The measured move target is 1.7725.
We look to Buy at 1.7600 (stop at 1.7550)
Our profit targets will be 1.7700 and 1.7725
Resistance: 1.7650 / 1.7700 / 1.7725
Support: 1.7600 / 1.7575 / 1.7550
Risk Disclaimer
The trade ideas beyond this page are for informational purposes only and do not constitute investment advice or a solicitation to trade. This information is provided by Signal Centre, a third-party unaffiliated with OANDA, and is intended for general circulation only. OANDA does not guarantee the accuracy of this information and assumes no responsibilities for the information provided by the third party. The information does not take into account the specific investment objectives, financial situation, or particular needs of any particular person. You should take into account your specific investment objectives, financial situation, and particular needs before making a commitment to trade, including seeking, under a separate engagement, as you deem fit.
You accept that you assume all risks in independently viewing the contents and selecting a chosen strategy.
Where the research is distributed in Singapore to a person who is not an Accredited Investor, Expert Investor or an Institutional Investor, Oanda Asia Pacific Pte Ltd (“OAP“) accepts legal responsibility for the contents of the report to such persons only to the extent required by law. Singapore customers should contact OAP at 6579 8289 for matters arising from, or in connection with, the information/research distributed.

GBP/AUD Forecast: Strategic Divergence & Market ShiftsStrategic Outlook: The Sterling Breakout
The Pound Sterling (GBP) has established a dominant position against the Australian Dollar (AUD) as 2025 closes. This shift represents a fundamental divergence in national economic strategies, not merely market fluctuation. The Bank of England (BoE) executed a "hawkish cut" to 3.75% in December, signaling long-term stability. In contrast, the Reserve Bank of Australia (RBA) remains paralyzed at 3.60% due to persistent inflation. This analysis dissects the geopolitical, technological, and industrial forces driving this volatility.
Macroeconomics: The Central Bank Divergence
The core driver of the GBP/AUD rally lies in contrasting monetary policies. The BoE managed a delicate pivot in December. By cutting rates while warning of inflation, they maintained yield appeal. Markets interpreted this decisiveness as strength, bolstering the Pound. Conversely, the RBA faces a credibility crisis. Australian CPI remains stubbornly high at 3.8%. Yet, the RBA held rates steady, fearing a mortgage cliff. This hesitation signals weakness. The "yield advantage" now firmly favors London over Sydney.
Geopolitics & Geostrategy: Risk Aversion Protocols
Global instability disproportionately harms the Australian Dollar. As a "risk-proxy" currency, the AUD suffers when tensions rise in the Indo-Pacific or Eastern Europe. Investors flee to safe havens or deeper liquidity pools like the GBP. Furthermore, the UK-Australia Free Trade Agreement has matured. While removing tariffs, it exposed Australia’s reliance on raw commodity exports. The UK’s pivot to high-value service exports insulates it better from supply chain disruptions. This structural imbalance currently weighs heavily on the Aussie.
Industry Trends: Services vs. Commodities
The UK economy is evolving faster than its Australian counterpart. Recent data indicates UK Intellectual Property (IP) investment surged by 15%. Britain is successfully transitioning to a high-value "intangible economy." Australia remains tethered to the "rocks and crops" model. While critical minerals are vital, global demand for lithium and iron ore has softened. This cyclical downturn in commodities drags the AUD down. The UK’s service-based resilience offers a more stable platform for currency appreciation.
Technology & Cyber: The Digital Trade Surplus
A hidden driver of Sterling's strength is the UK's dominance in digital services. Britain’s tech sector is leveraging AI to boost productivity. This export of digital solutions creates a "capital account surplus" that supports the GBP. In contrast, Australia faces a "cyber-sovereignty" challenge. As it digitizes mining operations, cybersecurity costs are rising. This increases operational overheads for major Australian firms. Consequently, foreign capital flows are hesitant, preferring the mature tech ecosystem of the UK.
Patent Analysis: The Innovation Gap
Patent filings reveal the future trajectory of these economies. UK firms are filing aggressively in fintech and biotech. This signals future revenue streams protected by global law. Australian innovation remains heavily concentrated in mining technology. While valuable, it is sector-specific. The lack of economic diversity in Australian patent data suggests a rigid business model. Investors prefer the diversified innovation portfolio of the UK, adding a premium to the Pound.
Leadership & Governance: Corporate Resilience
UK corporate leadership has adapted well to the "higher-for-longer" rate environment. FTSE 100 companies have successfully deleveraged balance sheets. This financial prudence attracts institutional investors. Australian management teams face different pressures. The heavy reliance on variable-rate borrowing in Australia squeezes cash flow. Business confidence in Sydney has dipped as leaders brace for potential rate hikes in 2026. This pessimistic corporate sentiment bleeds directly into the currency valuation.
Forecast: The Path to 2026
The immediate outlook for GBP/AUD remains bullish. The pair is likely to test new highs as liquidity thins over the holiday period. Traders should watch for signals of a pause in BoE cuts and critical Q4 inflation data from the RBA. The structural advantages of the UK economy currently outweigh the commodity potential of Australia. Position for continued GBP strength into Q1 2026.

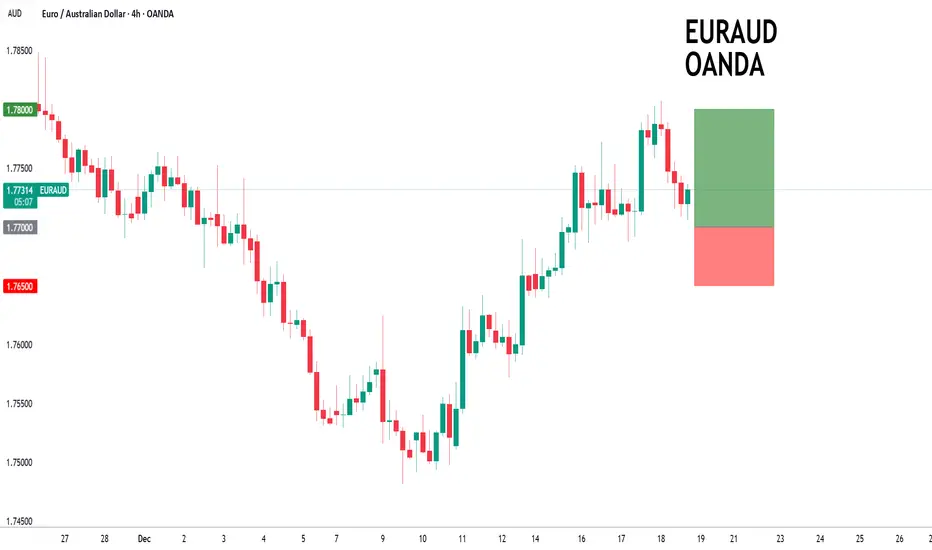
EURAUD - Rally Into Resistance or Setup for Continuation?📉EURAUD remains structurally bearish , with price still respecting the broader descending trendline.
The recent bounce is corrective in nature and has brought price back into a key supply zone, right at the intersection with the upper trendline.
This area is critical.
⚔️As long as price remains capped below this confluence , the higher-timeframe bias stays bearish. This is exactly the type of zone where trend-following shorts become attractive — not blindly, but through confirmation on lower timeframes.
What matters here is not the level alone, but the reaction:
rejections, momentum loss, and lower-timeframe bearish structure will be the trigger.
If sellers defend this intersection, continuation to the downside remains the higher-probability scenario.
Will sellers step in again at the trendline, or will buyers surprise? 🤔
⚠️ Disclaimer: This is not financial advice. Always do your own research and manage risk properly.
📚 Stick to your trading plan regarding entries, risk, and management.
Good luck! 🍀
All Strategies Are Good; If Managed Properly!
~Richard Nasr

Could we see a reversal from here?AUD/USD is rising towards the resistance level whcih is a pullback resistance that aligns with the 61.8% Fibonacci retracement and could reverse to the take profit.
Entry: 0.6645
Why we like it:
There is a pullback resistance that aligns with the 61.8% Fibonacci retracement.
Stop loss: 0.6676
Why we like it:
There is a swing high resistance
Take profit: 0.6571
Why we like it:
There is a pullback support that is slightly above the 50% Fibonacci retracement.
Enjoying your TradingView experience? Review us!
Please be advised that the information presented on TradingView is provided to Vantage (‘Vantage Global Limited’, ‘we’) by a third-party provider (‘Everest Fortune Group’). Please be reminded that you are solely responsible for the trading decisions on your account. There is a very high degree of risk involved in trading. Any information and/or content is intended entirely for research, educational and informational purposes only and does not constitute investment or consultation advice or investment strategy. The information is not tailored to the investment needs of any specific person and therefore does not involve a consideration of any of the investment objectives, financial situation or needs of any viewer that may receive it. Kindly also note that past performance is not a reliable indicator of future results. Actual results may differ materially from those anticipated in forward-looking or past performance statements. We assume no liability as to the accuracy or completeness of any of the information and/or content provided herein and the Company cannot be held responsible for any omission, mistake nor for any loss or damage including without limitation to any loss of profit which may arise from reliance on any information supplied by Everest Fortune Group.

Falling towards pullback support?Aussie (AUD/USD) is falling towards the pivot, which acts as a pullback support that aligns with the 50% Fibonacci retracement and could bounce to the 1st resistance.
Pivot: 0.6538
1st Support: 0.6404
1st Resistance: 0.6681
Dow Jones (US30) is falling towards the pivot, which is a pullback support and could rise to the 161.8% Fibonacci extension.
Pivot: 47,063.30
1st Support: 45,135.60
1st Resistance: 50,049.13
Disclaimer:
The opinions given above constitute general market commentary and do not constitute the opinion or advice of IC Markets or any form of personal or investment advice.
Any opinions, news, research, analyses, prices, other information, or links to third-party sites contained on this website are provided on an "as-is" basis, are intended to be informative only, and are not advice, a recommendation, research, a record of our trading prices, an offer of, or solicitation for, a transaction in any financial instrument and thus should not be treated as such. The information provided does not involve any specific investment objectives, financial situation, or needs of any specific person who may receive it. Please be aware that past performance is not a reliable indicator of future performance and/or results. Past performance or forward-looking scenarios based upon the reasonable beliefs of the third-party provider are not a guarantee of future performance. Actual results may differ materially from those anticipated in forward-looking or past performance statements. IC Markets makes no representation or warranty and assumes no liability as to the accuracy or completeness of the information provided, nor any loss arising from any investment based on a recommendation, forecast, or any information supplied by any third party

AUDUSD Potential UpsidesHey Traders, in today's trading session we are monitoring AUDUSD for a buying opportunity around 0.65700 zone, AUDUSD is trading in an uptrend and currently is in a correction phase in which it is approaching the trend at 0.65700 support and resistance area.
Trade safe, Joe.

#046: LONG AUD/JPY Investment Opportunity
The current structure of the AUD/JPY pair reflects a classic institutional pullback within a broader bullish environment. After a strong directional move, the price has entered a corrective phase that appears orderly rather than impulsive, suggesting a redistribution rather than a true trend reversal.
What is striking is the price behavior around the demand area. The market has already cleared liquidity, removing weak hands and breaching short-term stops. Since then, price action has slowed, showing hesitation and consolidation rather than a downward continuation. This is often a sign that professional traders are absorbing liquidity rather than closing positions.
From a macro perspective, the broader risk environment remains supported. The yen continues to serve as a funding currency, while the Australian dollar benefits from carry dynamics and relative strength during periods of risk appetite. This imbalance typically leads to shallow pullbacks, where the price doesn't always return to perfectly "clean" retail levels before resuming the primary move.
Volume trends reinforce this view. Selling pressure hasn't expanded during the retracement, and there's no evidence of aggressive distribution. Instead, the market appears to be transitioning from a corrective flow to a directional intent.
This type of structure often favors patience. Rather than chasing momentum, the idea is to allow the price to reach an area where institutional orders are more likely to stop, after the initial phase of manipulation. If execution occurs, the rationale is based on participation and intelligent money management, not emotional anticipation.
If the market continues to rise without filling the expected entry, this wouldn't invalidate the analysis. On the contrary, it would confirm strong directional conviction and aggressive participation by major players. In institutional trading, missed trades are a natural consequence of discipline, not a failure of analysis.
The focus remains on the quality of execution, not frequency. In environments like this, sticking to the plan and letting the market decide is often the most professional approach.

Bullish momentum to extend?EUR/AUDhas bounced off the pivot whch is a pullback support, and could rise to the 1st resistance.
Pivot: 1.76994
1st Support: 1.76459
1st Resistance: 1.78033
Disclaimer:
The opinions given above constitute general market commentary and do not constitute the opinion or advice of IC Markets or any form of personal or investment advice.
Any opinions, news, research, analyses, prices, other information, or links to third-party sites contained on this website are provided on an "as-is" basis, are intended to be informative only, and are not advice, a recommendation, research, a record of our trading prices, an offer of, or solicitation for, a transaction in any financial instrument and thus should not be treated as such. The information provided does not involve any specific investment objectives, financial situation, or needs of any specific person who may receive it. Please be aware that past performance is not a reliable indicator of future performance and/or results. Past performance or forward-looking scenarios based upon the reasonable beliefs of the third-party provider are not a guarantee of future performance. Actual results may differ materially from those anticipated in forward-looking or past performance statements. IC Markets makes no representation or warranty and assumes no liability as to the accuracy or completeness of the information provided, nor any loss arising from any investment based on a recommendation, forecast, or any information supplied by any third party

Bullish bounce off?AUD/JPY could make a short-term pullback towards the pivot and could bounce to the 1st resistance.
Pivot: 102.29
1st Support: 101.59
1st Resistance: 103.44
Disclaimer:
The opinions given above constitute general market commentary and do not constitute the opinion or advice of IC Markets or any form of personal or investment advice.
Any opinions, news, research, analyses, prices, other information, or links to third-party sites contained on this website are provided on an "as-is" basis, are intended to be informative only, and are not advice, a recommendation, research, a record of our trading prices, an offer of, or solicitation for, a transaction in any financial instrument and thus should not be treated as such. The information provided does not involve any specific investment objectives, financial situation, or needs of any specific person who may receive it. Please be aware that past performance is not a reliable indicator of future performance and/or results. Past performance or forward-looking scenarios based upon the reasonable beliefs of the third-party provider are not a guarantee of future performance. Actual results may differ materially from those anticipated in forward-looking or past performance statements. IC Markets makes no representation or warranty and assumes no liability as to the accuracy or completeness of the information provided, nor any loss arising from any investment based on a recommendation, forecast, or any information supplied by any third party

Bearish reversal off 50% Fibonacci resistance?AUD/USD has rejected off the resistance level, which is a pullback resistance that aligns with the 50% Fibonacci retracement and could drop from this level to our take profit.
Entry: 0.6631
Why we like it:
There is a pullback resistance that aligns with the 50% Fibonacci retracement.
Stop loss: 0.6676
Why we like it:
There is a swing high resistance level
Take profit: 0.6541
Why we like it:
There is a pullback support level that is slightly below the 50% Fibonacci retracement.
Enjoying your TradingView experience? Review us!
Please be advised that the information presented on TradingView is provided to Vantage (‘Vantage Global Limited’, ‘we’) by a third-party provider (‘Everest Fortune Group’). Please be reminded that you are solely responsible for the trading decisions on your account. There is a very high degree of risk involved in trading. Any information and/or content is intended entirely for research, educational and informational purposes only and does not constitute investment or consultation advice or investment strategy. The information is not tailored to the investment needs of any specific person and therefore does not involve a consideration of any of the investment objectives, financial situation or needs of any viewer that may receive it. Kindly also note that past performance is not a reliable indicator of future results. Actual results may differ materially from those anticipated in forward-looking or past performance statements. We assume no liability as to the accuracy or completeness of any of the information and/or content provided herein and the Company cannot be held responsible for any omission, mistake nor for any loss or damage including without limitation to any loss of profit which may arise from reliance on any information supplied by Everest Fortune Group.

EURAUD to continue in the upward move?EURAUD - 24h expiry
There is no clear indication that the upward move is coming to an end.
Although we remain bullish overall, a correction is possible with plenty of room to move lower without impacting the trend higher.
Risk/Reward would be poor to call a buy from current levels.
A move through 1.7750 will confirm the bullish momentum.
The measured move target is 1.7825.
We look to Buy at 1.7700 (stop at 1.7650)
Our profit targets will be 1.7800 and 1.7825
Resistance: 1.7750 / 1.7800 / 1.7825
Support: 1.7725 / 1.7700 / 1.7675
Risk Disclaimer
The trade ideas beyond this page are for informational purposes only and do not constitute investment advice or a solicitation to trade. This information is provided by Signal Centre, a third-party unaffiliated with OANDA, and is intended for general circulation only. OANDA does not guarantee the accuracy of this information and assumes no responsibilities for the information provided by the third party. The information does not take into account the specific investment objectives, financial situation, or particular needs of any particular person. You should take into account your specific investment objectives, financial situation, and particular needs before making a commitment to trade, including seeking, under a separate engagement, as you deem fit.
You accept that you assume all risks in independently viewing the contents and selecting a chosen strategy.
Where the research is distributed in Singapore to a person who is not an Accredited Investor, Expert Investor or an Institutional Investor, Oanda Asia Pacific Pte Ltd (“OAP“) accepts legal responsibility for the contents of the report to such persons only to the extent required by law. Singapore customers should contact OAP at 6579 8289 for matters arising from, or in connection with, the information/research distributed.
AUDUSD H4 | Bullish Bounce OffMomentum: Bullish
The price is falling towards the buy entry, which is slightly below the 23.6% Fibonacci retracement and also trading above the Ichimoku cloud.
Buy entry: 0.6612
Pullback suport
Slightly below the 23.6% Fibonacci retracement
Stop loss: 0.6573
Pullback support
Take profit: 0.6686
Multi swing high resistance
High Risk Investment Warning
Stratos Markets Limited (tradu.com), Stratos Europe Ltd (tradu.com ):
CFDs are complex instruments and come with a high risk of losing money rapidly due to leverage. 70% of retail investor accounts lose money when trading CFDs with this provider. You should consider whether you understand how CFDs work and whether you can afford to take the high risk of losing your money.
Stratos Global LLC (tradu.com ): Losses can exceed deposits.
Please be advised that the information presented on TradingView is provided to Tradu (‘Company’, ‘we’) by a third-party provider (‘TFA Global Pte Ltd’). Please be reminded that you are solely responsible for the trading decisions on your account. Any information and/or content is intended entirely for research, educational and informational purposes only and does not constitute investment or consultation advice or investment strategy. The information is not tailored to the investment needs of any specific person and therefore does not involve a consideration of any of the investment objectives, financial situation or needs of any viewer that may receive it. Past performance is not a reliable indicator of future results. Actual results may differ materially from those anticipated in forward-looking or past performance statements. We assume no liability as to the accuracy or completeness of any of the information and/or content provided herein and the Company cannot be held responsible for any omission, mistake nor for any loss or damage including without limitation to any loss of profit which may arise from reliance on any information supplied by TFA Global Pte Ltd.

Potential bearish drop?Aussie (AUD/USD) has reacted off the pivot and could drop to the pullback support, which is slightly above the 61.8% Fibonacci retracement.
Pivot: 0.6619
1st Support: 0.6540
1st Resistance: 0.6672
Disclaimer:
The opinions given above constitute general market commentary and do not constitute the opinion or advice of IC Markets or any form of personal or investment advice.
Any opinions, news, research, analyses, prices, other information, or links to third-party sites contained on this website are provided on an "as-is" basis, are intended to be informative only, and are not advice, a recommendation, research, a record of our trading prices, an offer of, or solicitation for, a transaction in any financial instrument and thus should not be treated as such. The information provided does not involve any specific investment objectives, financial situation, or needs of any specific person who may receive it. Please be aware that past performance is not a reliable indicator of future performance and/or results. Past performance or forward-looking scenarios based upon the reasonable beliefs of the third-party provider are not a guarantee of future performance. Actual results may differ materially from those anticipated in forward-looking or past performance statements. IC Markets makes no representation or warranty and assumes no liability as to the accuracy or completeness of the information provided, nor any loss arising from any investment based on a recommendation, forecast, or any information supplied by any third party

Heading towards 50% Fib resistance?AUD/JPY is rising towards the resistance level, which is a pullback resistance that aligns with the 50% Fibonacci retracement and could potentially reverse from this level to our take-profit.
Entry: 103.20
Why we like it:
There is an overlap resistance level that aligns with the 50% Fibonacci retracement.
Stop loss: 103.73
Why we like it:
There is a pullback resistance that aligns with the 78.6% Fibonacci retracement.
Take profit: 102.15
Why we like it:
There is a swing low support.
Enjoying your TradingView experience? Review us!
Please be advised that the information presented on TradingView is provided to Vantage (‘Vantage Global Limited’, ‘we’) by a third-party provider (‘Everest Fortune Group’). Please be reminded that you are solely responsible for the trading decisions on your account. There is a very high degree of risk involved in trading. Any information and/or content is intended entirely for research, educational and informational purposes only and does not constitute investment or consultation advice or investment strategy. The information is not tailored to the investment needs of any specific person and therefore does not involve a consideration of any of the investment objectives, financial situation or needs of any viewer that may receive it. Kindly also note that past performance is not a reliable indicator of future results. Actual results may differ materially from those anticipated in forward-looking or past performance statements. We assume no liability as to the accuracy or completeness of any of the information and/or content provided herein and the Company cannot be held responsible for any omission, mistake nor for any loss or damage including without limitation to any loss of profit which may arise from reliance on any information supplied by Everest Fortune Group.

GBPAUD to find sellers at current market price?GBPAUD - 24h expiry
Daily signals are mildly bearish.
50 1day EMA is at 2.0251.
Offers ample risk/reward to sell at the market.
Early optimism is likely to lead to gains although extended attempts higher are expected to fail.
Our outlook is bearish.
We look to Sell at 2.0249 (stop at 2.0321)
Our profit targets will be 2.0049 and 2.0019
Resistance: 2.0250 / 2.0300 / 2.0350
Support: 2.0180 / 2.0120 / 2.0075
Risk Disclaimer
The trade ideas beyond this page are for informational purposes only and do not constitute investment advice or a solicitation to trade. This information is provided by Signal Centre, a third-party unaffiliated with OANDA, and is intended for general circulation only. OANDA does not guarantee the accuracy of this information and assumes no responsibilities for the information provided by the third party. The information does not take into account the specific investment objectives, financial situation, or particular needs of any particular person. You should take into account your specific investment objectives, financial situation, and particular needs before making a commitment to trade, including seeking, under a separate engagement, as you deem fit.
You accept that you assume all risks in independently viewing the contents and selecting a chosen strategy.
Where the research is distributed in Singapore to a person who is not an Accredited Investor, Expert Investor or an Institutional Investor, Oanda Asia Pacific Pte Ltd (“OAP“) accepts legal responsibility for the contents of the report to such persons only to the extent required by law. Singapore customers should contact OAP at 6579 8289 for matters arising from, or in connection with, the information/research distributed.

AUDUSD Breakout Retest as Dollar Weakens!Hey Traders,
In today’s trading session, we are monitoring AUDUSD for a potential buying opportunity around the 0.66000 zone. The pair previously traded within a downtrend but has successfully broken out, signaling a shift in market structure.
Price is now in a healthy corrective phase, retracing toward the 0.66000 support zone, which aligns with prior resistance turned support — a classic breakout–retest setup.
Fundamental backdrop:
The US Dollar remains under pressure following softer macro conditions and fading expectations of sustained Fed hawkishness. Recent data continues to point toward a cooling US labor market, reinforcing a weaker USD environment and improving the risk-reward profile for AUDUSD on pullbacks.
Focus: Watching price behavior around 0.66000 for confirmation of bullish continuation.
Trade safe,
Joe

AUDUSD at Decision Point — Trend or Trap?Hey Traders,
In today’s trading session, we are monitoring AUDUSD for a potential buying opportunity around the 0.66200 zone.
Structure:
AUDUSD remains in a well-defined uptrend, and price is currently undergoing a healthy pullback toward the rising trend structure. The 0.66200 area stands out as a key zone of confluence, acting as both dynamic trend support and a prior reaction level.
Context:
As long as price holds above this level, the broader bullish structure remains intact, keeping the path open for a continuation toward recent highs.
Plan:
Watching for bullish reaction and confirmation around 0.66200 before considering continuation setups.
Trade safe,
Joe

EURGBP: Wait for Break!Hello Traders!
EURGBP could be highly affected by the GDP m/m news of the United Kingdom!
You use this analysis in two ways!
1st! taking Swing Trades.
2nd! Making intraday trads by using strategies like ORB and others.
Best Regards, Ali

AUDUSD - Future OutlookHistorical Retrospective:
Feb 2012 - mid-Mar 2020: clear technical five-wave impulsive move down.
Mid-Mar 2020 - Feb 2021: wave A , a corrective impulsive move.
Feb 2021 - present: wave B , a three-wave correction.
Expectation:
Wave C - a five-wave corrective impulse upward.
Targets:
From the current level (wave C underway): 0.84
From the end of the impulsive move: 0.80
Summary:
We are close to a reversal or have already completed it, with a strong upward move expected next.
---
Please subscribe and leave a comment.
You’ll get new information faster than anyone else.
---

Falling towards pullback support?Aussie (AUD/USD) is falling towards the pivot, which has been identified as a pullback support and could bounce to the 1st resistance.
Pivot: 0.6573
1st Support: 0.6516
1st Resistance: 0.6647
Disclaimer:
The opinions given above constitute general market commentary and do not constitute the opinion or advice of IC Markets or any form of personal or investment advice.
Any opinions, news, research, analyses, prices, other information, or links to third-party sites contained on this website are provided on an "as-is" basis, are intended to be informative only, and are not advice, a recommendation, research, a record of our trading prices, an offer of, or solicitation for, a transaction in any financial instrument and thus should not be treated as such. The information provided does not involve any specific investment objectives, financial situation, or needs of any specific person who may receive it. Please be aware that past performance is not a reliable indicator of future performance and/or results. Past performance or forward-looking scenarios based upon the reasonable beliefs of the third-party provider are not a guarantee of future performance. Actual results may differ materially from those anticipated in forward-looking or past performance statements. IC Markets makes no representation or warranty and assumes no liability as to the accuracy or completeness of the information provided, nor any loss arising from any investment based on a recommendation, forecast, or any information supplied by any third party

Bearish drop off?AUD/CHF is reacting off the resistance level, which is a pullback resistance and could drop from this level to our take profit.
Entry: 0.91626
Why we like it:
There is a pullback resistance level
Stop loss: 0.91861
Why we like it:
There is an overlap resistance level.
Take profit: 0.91181
Why we like it:
There is a pullback support level that is slightly above the 100% Fibonacci projection.
Enjoying your TradingView experience? Review us!
Please be advised that the information presented on TradingView is provided to Vantage (‘Vantage Global Limited’, ‘we’) by a third-party provider (‘Everest Fortune Group’). Please be reminded that you are solely responsible for the trading decisions on your account. There is a very high degree of risk involved in trading. Any information and/or content is intended entirely for research, educational and informational purposes only and does not constitute investment or consultation advice or investment strategy. The information is not tailored to the investment needs of any specific person and therefore does not involve a consideration of any of the investment objectives, financial situation or needs of any viewer that may receive it. Kindly also note that past performance is not a reliable indicator of future results. Actual results may differ materially from those anticipated in forward-looking or past performance statements. We assume no liability as to the accuracy or completeness of any of the information and/or content provided herein and the Company cannot be held responsible for any omission, mistake nor for any loss or damage including without limitation to any loss of profit which may arise from reliance on any information supplied by Everest Fortune Group.

NZD/AUD Forecast: The Climb to 0.90 Amid Diverging Rates
Current Status: The New Zealand Dollar (NZD) has stabilized against the Australian Dollar (AUD), trading at 0.8728 . After bottoming near 0.86 in November, the cross is recovering, driven by a recalibration of interest rate expectations and shifting economic currents.
Macroeconomic Analysis: The Central Bank Divergence
A primary driver of the NZD/AUD recovery is the reassessment of monetary policy trajectories. The Reserve Bank of New Zealand (RBNZ) faces persistent domestic inflation, tempering expectations for aggressive rate cuts. Conversely, the Reserve Bank of Australia (RBA) maintained its cash rate at 3.60% in December, maintaining a hawkish stance due to upside inflation risks. This narrowing policy gap, where the RBNZ is no longer significantly "out-dovin" the RBA, provides crucial support for the Kiwi dollar.
Geostrategy & Geopolitics: The China Factor
Both currencies remain sensitive to Chinese economic stability, but their exposure differs significantly. The AUD serves as a liquid proxy for Chinese industrial demand, facing volatility as Beijing recalibrates stimulus measures for 2026. In contrast, the NZD ties closely to soft commodities like dairy and meat, which see resilient demand despite broader geopolitical friction. As trade routes stabilize, lower volatility in New Zealand's export markets contributes to the currency's "safe harbor" appeal relative to the risk-sensitive Aussie.
Industry Trends: AgTech vs. Mining Tech
New Zealand’s shift toward high-margin agricultural technology (AgTech) is altering its export profile. Innovation in sustainable farming and automated dairy processing boosts productivity, offsetting headwinds from traditional commodity price fluctuations. Meanwhile, Australia’s mining sector grapples with high capital costs for green energy transitions. This structural divergence suggests New Zealand’s export economy is entering a phase of higher efficiency, supporting long-term valuation.
Economics: The Housing Market Constraints
Economic resilience is visible in the housing sector. Australian data indicates a 7.2% rise in home values since early 2025, driven by supply shortages. This "wealth effect" keeps consumption high, forcing the RBA to stay restrictive. New Zealand’s housing market shows more balanced supply-demand dynamics. This stability allows the RBNZ more flexibility, potentially reducing the risk of a policy error that could devalue the currency.
Forecast: The Path to 0.90
Current projections estimate the NZD/AUD cross will climb toward 0.90 by early 2027 . This forecast assumes a gradual normalization of the interest rate differential. The recovery will likely be non-linear; periods of Australian dollar strength are inevitable if global risk sentiment spikes. However, as the easing cycle proves shallower than feared and the RBA eventually pivots, the fundamental floor for the NZD is expected to rise.
Conclusion: The NZD/AUD is no longer trapped in a one-way bearish trend. Investors should watch the spread between Australian and New Zealand 2-year swap rates as the key indicator for the next leg higher.
