AUD/CAD LONG FROM SUPPORT
Hello, Friends!
Bullish trend on AUD/CAD, defined by the green colour of the last week candle combined with the fact the pair is oversold based on the BB lower band proximity, makes me expect a bullish rebound from the support line below and a retest of the local target above at 0.921.
Disclosure: I am part of Trade Nation's Influencer program and receive a monthly fee for using their TradingView charts in my analysis.
✅LIKE AND COMMENT MY IDEAS✅
AUDCAD

Swing Trading AUD/CAD: A Detailed Bullish Scenario📌 𝐀𝐬𝐬𝐞𝐭: AUD/CAD — “Aussie vs Canadian Dollar”
𝐅𝐨𝐫𝐞𝐱 𝐌𝐚𝐫𝐤𝐞𝐭 𝐓𝐫𝐚𝐝𝐞 𝐎𝐩𝐩𝐨𝐫𝐭𝐮𝐧𝐢𝐭𝐲 𝐆𝐮𝐢𝐝𝐞 (𝐒𝐰𝐢𝐧𝐠 𝐓𝐫𝐚𝐝𝐞)
🧭 𝐓𝐫𝐚𝐝𝐞 𝐏𝐥𝐚𝐧: 𝐁𝐮𝐥𝐥𝐢𝐬𝐡 — 𝐌𝐀 𝐏𝐮𝐥𝐥𝐛𝐚𝐜𝐤 + 𝐏𝐫𝐞𝐜𝐢𝐬𝐞 𝐑𝐞𝐭𝐞𝐬𝐭 𝐂𝐨𝐧𝐟𝐢𝐫𝐦𝐞𝐝
The trend structure remains bullish with clean higher-lows. Price has reacted strongly from the dynamic support zone around the Moving Averages, validating a trend-continuation setup. Momentum stays on the buyers’ side with exhaustion signs on the sellers.
🎯 𝐄𝐧𝐭𝐫𝐲: 𝐌𝐮𝐥𝐭𝐢-𝐋𝐚𝐲𝐞𝐫 𝐁𝐮𝐲 𝐎𝐫𝐝𝐞𝐫 𝐒𝐭𝐫𝐚𝐭𝐞𝐠𝐲 (𝐓𝐡𝐢𝐞𝐟 𝐌𝐞𝐭𝐡𝐨𝐝)
This plan uses a layered limit entry system to reduce risk and improve average execution:
Buy Limit Layers:
0.91400
0.91500
0.91600
0.91700
(You may increase or decrease layers based on your personal strategy.)
Concept: This layering method allows catching pullback liquidity sweeps and retest reactions across micro-levels — ideal for swing positioning.
🛡️ Stop Loss (SL): 0.91200
This is the proposed Thief SL.
However, you must adjust SL based on your risk tolerance, trade size, and personal strategy.
Your money—your responsibility.
🎯 Target (TP): 0.92400
Price is approaching a Police Barricade Zone — a strong resistance area where:
Market is entering overbought territory,
A possible bull trap might form,
Liquidity zones cluster tightly.
Take profits safely.
Again, adjust TP as per your risk and comfort.
📚 Related Pairs to Watch (Correlation Insights)
💱 1. USD/CAD ( OANDA:USDCAD )
Correlation: Moderate Positive
When CAD strengthens (often due to oil), USDCAD tends to drop, and AUDCAD may also feel downside pressure.
Watch oil and CAD macro data.
💱 2. AUD/USD ( OANDA:AUDUSD )
Correlation: Strong Positive with AUD strength
If AUD shows broad market strength versus USD, chances increase for AUD to outperform CAD as well.
Risk sentiment (RISK-ON/RISK-OFF) heavily impacts it.
💱 3. CAD/JPY ( OANDA:CADJPY )
Correlation: Risk sentiment indicator
When CADJPY weakens, global risk sentiment may be shifting, which can slow AUDCAD bullish momentum.
💱 4. AUD/JPY ( OANDA:AUDJPY )
Correlation: High risk sentiment sensitivity → guidance for AUD strength
If AUDJPY rallies, it shows strong AUD flows—supportive for AUDCAD longs.
💱 5. WTI Crude Oil ( TVC:USOIL )
Correlation: Inverse Effect on AUDCAD
CAD is an oil-linked currency.
Rising oil → CAD strengthens → AUDCAD may drop.
Falling oil → CAD weakens → AUDCAD tends to rise.
🧠 Final Notes
This is a structured swing setup designed for layered execution, strong risk control, and clarity.
Always adapt entries, stops, and targets to your own strategy.
Trade responsibly, trade smart.

AUDCAD: Long Trade Explained
AUDCAD
- Classic bullish formation
- Our team expects growth
SUGGESTED TRADE:
Swing Trade
Buy AUDCAD
Entry Level - 0.9188
Sl - 0.9176
Tp - 0.9210
Our Risk - 1%
Start protection of your profits from lower levels
Disclosure: I am part of Trade Nation's Influencer program and receive a monthly fee for using their TradingView charts in my analysis.
❤️ Please, support our work with like & comment! ❤️

AUDCAD Will Go Down! Sell!
Take a look at our analysis for AUDCAD.
Time Frame: 4h
Current Trend: Bearish
Sentiment: Overbought (based on 7-period RSI)
Forecast: Bearish
The market is testing a major horizontal structure 0.924.
Taking into consideration the structure & trend analysis, I believe that the market will reach 0.918 level soon.
P.S
The term oversold refers to a condition where an asset has traded lower in price and has the potential for a price bounce.
Overbought refers to market scenarios where the instrument is traded considerably higher than its fair value. Overvaluation is caused by market sentiments when there is positive news.
Like and subscribe and comment my ideas if you enjoy them!

AUDCAD – H4 | 02-12-2025 Wave 3 is back in playAUDCAD – H4 | 02-12-2025
Wave 3 is back in play
A clean Elliott Wave reaction once again.
Following the previous update, price extended lower to 0.90565, completing the blue wave 5, thereby finishing white wave C of yellow wave Y, and simultaneously confirming the completion of the red wave 2 corrective structure.
From the 0.90565 low, the market has rallied strongly into yellow wave 1 of red wave 3. Within this advance, the internal structure of yellow wave 1 is unfolding as a clear five-wave impulsive sequence in white, and price is currently progressing through white wave 5.
Price may push slightly higher to finalize this five-wave structure of yellow wave 1 before entering a corrective pullback as yellow wave 2.
Primary Plan
Wait for yellow wave 2 to complete, then look for long opportunities aligned with the powerful yellow wave 3 of red wave 3.
Invalidation
A break below 0.90565 would invalidate the count and require reassessment.

Bulls Still in Control?Hello traders! Here’s an idea for AUDCAD based on current structure, trend, and momentum.
(This is market analysis, not financial advice. Always use proper risk management and seek additional confirmations before entering a trade.)
Intraday Buy Idea (short term move)
• Entry: 0.91500 – 0.91600
• Stop-Loss: 0.91350 – 0.91300
• Target Area: 0.91800 – 0.92000
⸻
Market Analysis
AUD/CAD continues to trade within a relatively modest daily range—typical for this pair—especially as we approach the end of Q4 and move deeper into the holiday season, when liquidity thins and price action often becomes more choppy and range-bound.
On the 4-hour chart, an inverted head-and-shoulders pattern has formed. The market recently closed above the neckline/right-shoulder zone, confirming potential bullish structure. A clean retest of this zone (around 0.91500-0.91600) could provide an opportunity to catch the continuation of the bullish momentum that began late last week (around Nov 21).
Our target—0.92000—lines up closely with November’s high and a key structural resistance level. If momentum remains intact, price could attempt another test of this area.
⸻
Fundamentals (per economic sources)
Australia (AUD)
• The RBA has kept rates steady, maintaining stability in the AUD.
• Commodity prices trending higher (especially metals) provide underlying support for the Australian dollar.
• A potential shift toward U.S. Federal Reserve rate cuts later on can indirectly support AUD through broader USD softness and risk-on flows. (per economic sources)
Canada (CAD)
• Canada’s manufacturing sector continues to contract, signaling broader weakness.
• While recent GDP growth was positive, the expansion was driven mainly by oil exports and government spending, not broad economic strength.
• Mixed and uneven economic performance may limit near-term CAD strength.
Combined, these factors support a slightly bullish bias for AUD/CAD in the near term, aligning with this technical setup.

AUDCAD The Target Is UP! BUY!
My dear subscribers,
This is my opinion on the AUDCAD next move:
The instrument tests an important psychological level 0.9141
Bias - Bullish
Technical Indicators: Supper Trend gives a precise Bullish signal, while Pivot Point HL predicts price changes and potential reversals in the market.
Target - 0.9150
My Stop Loss - 0.9135
About Used Indicators:
On the subsequent day, trading above the pivot point is thought to indicate ongoing bullish sentiment, while trading below the pivot point indicates bearish sentiment.
Disclosure: I am part of Trade Nation's Influencer program and receive a monthly fee for using their TradingView charts in my analysis.
———————————
WISH YOU ALL LUCK

Multi swing high resistance ahead?AUD/CAD is rising towards the resistance level, which is a multi swing high resistance and could reverse from this level to our take profit.
Entry: 0.91961
Why we like it:
There is a multi-swing high resistance
Stop loss: 0.92483
Why we like it:
There is a resistance level at the 127.2% Fibonacci extension.
Take profit: 0.91181
Why we like it:
There is a pullback support level.
Enjoying your TradingView experience? Review us!
Please be advised that the information presented on TradingView is provided to Vantage (‘Vantage Global Limited’, ‘we’) by a third-party provider (‘Everest Fortune Group’). Please be reminded that you are solely responsible for the trading decisions on your account. There is a very high degree of risk involved in trading. Any information and/or content is intended entirely for research, educational and informational purposes only and does not constitute investment or consultation advice or investment strategy. The information is not tailored to the investment needs of any specific person and therefore does not involve a consideration of any of the investment objectives, financial situation or needs of any viewer that may receive it. Kindly also note that past performance is not a reliable indicator of future results. Actual results may differ materially from those anticipated in forward-looking or past performance statements. We assume no liability as to the accuracy or completeness of any of the information and/or content provided herein and the Company cannot be held responsible for any omission, mistake nor for any loss or damage including without limitation to any loss of profit which may arise from reliance on any information supplied by Everest Fortune Group.

AUD/CAD BEST PLACE TO SELL FROM|SHORT
Hello, Friends!
We are going short on the AUD/CAD with the target of 0.910 level, because the pair is overbought and will soon hit the resistance line above. We deduced the overbought condition from the price being near to the upper BB band. However, we should use low risk here because the 1W TF is green and gives us a counter-signal.
Disclosure: I am part of Trade Nation's Influencer program and receive a monthly fee for using their TradingView charts in my analysis.
✅LIKE AND COMMENT MY IDEAS✅

AUDCAD SELLsim looking on selling audcad price has been looking good and we have alot of major news coming this week...

Choppy market, but still present opportunities…Hello traders!
Weekly outlooks will most likely be published over the weekend while the market is closed. This gives us the opportunity to analyze the market while it is dormant to eliminate the noise. We will begin the AUDCAD.
Short-term technicals are suggesting a slightly bullish market. Within the next month, we could see a choppy market where price range between 0.90500 and 0.91500. This could be likely since there are no major central bank surprises expected in the next 2–4 weeks and the commodities such as oil for Canada and iron for Australia are currently stable and RBA & BoC holding rates steady as we head into December, hopefully no surprises from China.
Looking at the chart provided, we had a weekly low around 0.90671 on Tuesday right before midnight and the market rallied quickly 0.91320. This low that was created act as a strong support this week and the market attempted to break below this support and failed as buyers took advantage of a premium price near 0.90500. We end the trading week closing above 0.91000 which may indicate bullish intentions, at least for now. If price remains above 0.90500, we could see this pair trading around 0.91500 before the end of the quarter.
This is an idea, not a signal…. and we should continue looking for confirmations. Remember, we can always try to predict the market, but it’s best to know when to react.

AUD-CAD Bullish Rebound Ahead! Buy!
Hello,Traders!
AUDCAD made a nice bearish stretch but is now hovering above a strong demand level so as the bullish pressure builds, we might see a move up towards the inefficiency above.Time Frame 5H.
Sell!
Comment and subscribe to help us grow!
Check out other forecasts below too!
Disclosure: I am part of Trade Nation's Influencer program and receive a monthly fee for using their TradingView charts in my analysis.

AUDCAD Set To Grow! BUY!
My dear subscribers,
My technical analysis for AUDCAD is below:
The price is coiling around a solid key level - 0.9117
Bias - Bullish
Technical Indicators: Pivot Points Low anticipates a potential price reversal.
Super trend shows a clear buy, giving a perfect indicators' convergence.
Goal - 0.9143
About Used Indicators:
By the very nature of the supertrend indicator, it offers firm support and resistance levels for traders to enter and exit trades. Additionally, it also provides signals for setting stop losses
Disclosure: I am part of Trade Nation's Influencer program and receive a monthly fee for using their TradingView charts in my analysis.
———————————
WISH YOU ALL LUCK

AUD/CAD LONG FROM SUPPORT
Hello, Friends!
Bullish trend on AUD/CAD, defined by the green colour of the last week candle combined with the fact the pair is oversold based on the BB lower band proximity, makes me expect a bullish rebound from the support line below and a retest of the local target above at 0.917.
Disclosure: I am part of Trade Nation's Influencer program and receive a monthly fee for using their TradingView charts in my analysis.
✅LIKE AND COMMENT MY IDEAS✅

AUDCAD RISKY LONG|
✅AUDCAD is sliding into a clean demand zone where liquidity rests below recent lows. Expect a reaction as price taps this imbalance. Targeting a retracement toward the marked FVG before continuation. Time Frame 2H.
LONG🚀
✅Like and subscribe to never miss a new idea!✅

AUDCAD Forming Bullish MomentumAUD/CAD has formed a clean base around the 0.9150–0.9200 range, suggesting that buyers are defending this zone and accumulation may be underway. The recent move upward with a potential breakout in play aligns with a view that the Aussie could be set for further strength. If momentum continues, we could see AUD push toward the 0.9300–0.9400 area, which would be a compelling risk-reward opportunity for bulls.
On the macro side, there’s a strong interest rate differential working in favor of AUD. The Reserve Bank of Australia is holding its rate at 3.60%, according to recent data, while the Bank of Canada has cut its rate to 2.25%, signifying a dovish tilt. This gap draws carry flows toward the AUD from yield-seeking investors. Meanwhile, Australia’s economic growth outlook remains decent, with the RBA projecting GDP to grow by around 2.0% in December 2025.
Commodity plays also support AUD strength: as a major exporter of raw materials, Australia benefits when global demand remains firm. That said, downside risks exist. A sharper-than-expected economic slowdown in Canada, combined with further rate cuts, could weigh on the loonie and reinforce AUD strength. On the flip side, if Australia faces inflationary pressures, the RBA might be forced to re-adjust its policy, which could compress the rate edge.

AUDCAD: Bullish Continuation & Long Trade
AUDCAD
- Classic bullish pattern
- Our team expects retracement
SUGGESTED TRADE:
Swing Trade
Buy AUDCAD
Entry - 0.9155
Stop - 0.9145
Take -0.9173
Our Risk - 1%
Start protection of your profits from lower levels
Disclosure: I am part of Trade Nation's Influencer program and receive a monthly fee for using their TradingView charts in my analysis.
❤️ Please, support our work with like & comment! ❤️

Stop!Loss|Market View: USDCAD🙌 Stop!Loss team welcomes you❗️
In this post, we're going to talk about the near-term outlook for the USDCAD currency pair☝️
Potential trade setup:
🔔Entry level: 1.39721
💰TP: 1.41321
⛔️SL: 1.39021
"Market View" - a brief analysis of trading instruments, covering the most important aspects of the FOREX market.
👇 In the comments 👇 you can type the trading instrument you'd like to analyze, and we'll talk about it in our next posts.
💬 Description: Strengthening of the USD is expected in the near future, as noted in previous reviews. Against this backdrop, the Canadian dollar could demonstrate one of the most effective moves in favor of the USD. The buying zone is currently located in the range of 1.39400 - 1.40010. The most likely scenario is an upward reversal from this area with a target of resistance at 1.41400.
Thanks for your support 🚀
Profits for all ✅
❗️ Updates on this idea can be found below 👇

AUDCAD: Short Trading Opportunity
AUDCAD
- Classic bearish pattern
- Our team expects retracement
SUGGESTED TRADE:
Swing Trade
Sell AUDCAD
Entry - 0.9163
Stop - 0.9170
Take - 0.9152
Our Risk - 1%
Start protection of your profits from lower levels
Disclosure: I am part of Trade Nation's Influencer program and receive a monthly fee for using their TradingView charts in my analysis.
❤️ Please, support our work with like & comment! ❤️

AUDCAD | Bullish SetupPrice looking hot here with multiple patterns in one.
Looking for a long term swing with some day trades in between.
Overall target 🎯0.93555

AUDCAD: Bearish Continuation & Short Trade
AUDCAD
- Classic bearish formation
- Our team expects fall
SUGGESTED TRADE:
Swing Trade
Sell AUDCAD
Entry Level - 0.9158
Sl - 0.9169
Tp - 0.9138
Our Risk - 1%
Start protection of your profits from lower levels
Disclosure: I am part of Trade Nation's Influencer program and receive a monthly fee for using their TradingView charts in my analysis.
❤️ Please, support our work with like & comment! ❤️

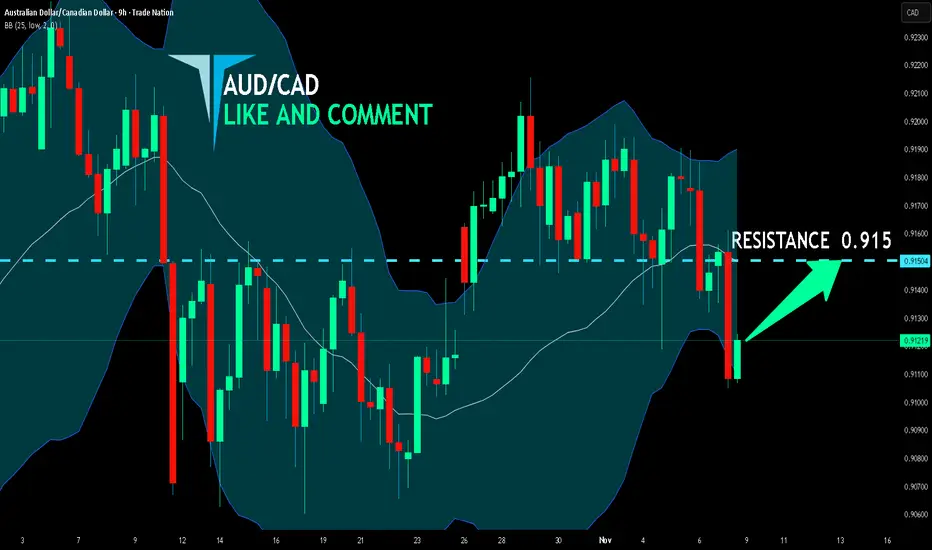
AUD/CAD SENDS CLEAR BULLISH SIGNALS|LONG
Hello, Friends!
We are targeting the 0.915 level area with our long trade on AUD/CAD which is based on the fact that the pair is oversold on the BB band scale and is also approaching a support line below thus going us a good entry option.
Disclosure: I am part of Trade Nation's Influencer program and receive a monthly fee for using their TradingView charts in my analysis.
✅LIKE AND COMMENT MY IDEAS✅
AUD/CAD Daily Market OutlookThe AUD/CAD structure on the daily timeframe is showing clear signs of bearish pressure after repeated rejections within the 0.91500–0.92270 supply zone. Price has been consolidating beneath this resistance area, forming lower highs and indicating a weakening bullish momentum.
My expectation is a continuation to the downside, targeting the next significant liquidity level around 0.84439, but the short-term confirmation zone sits at 0.90789.
At the moment, price is hovering just above 0.90789. For a cleaner and higher-probability sell scenario, I require a decisive daily close below 0.90789, followed by a bearish engulfing candle to signal strong seller dominance. Such a break would confirm that the market has transitioned from distribution into a stronger downside phase.
Trade Idea (Sell Bias):
• Entry Zone: Confirmation comes after a clear close below 0.90789 followed by an engulfing candle.
• Stop Loss: Positioned above the red zone around 0.92270, protecting against any liquidity grab or false breakout.
• Targets: The broader downside structure points to a continuation towards the lower range around 0.84439, where previous major demand sits.
This setup aligns with the prevailing market structure, the visible supply rejection, and the need for confirmation to avoid premature entries. OANDA:AUDCAD
