AUDCAD is Breaking Triangle — Bullish Breakout Ahead of CPI?Today, I want to share a long trading opportunity on the AUDCAD pair ( FX:AUDCAD ), so stay tuned!
Currently, AUDCAD has successfully broken through its resistance line and is now situated within a heavy resistance zone(0.9585 CAD-0.9247 CAD).
From a classic technical analysis perspective, if we look at the AUDCAD chart on the 4-hour timeframe, we can see a symmetrical triangle pattern, which suggests a continuation of the recent bullish trend of AUDCAD.
From an Elliott Wave perspective, it appears that AUDCAD has completed microwave 4 of the main wave 5, and we can expect the start of microwave 5 of the main wave 5. The breakout above the upper line of the symmetrical triangle could confirm the end of the microwave 4.
Additionally, today’s Canadian CPI data could act as a key catalyst for AUDCAD.
Based on recent macro trends, I expect inflation pressures in Canada to remain soft.
If CPI comes at or below expectations, it should weaken CAD and support a bullish continuation on AUDCAD.
As long as the structure holds, I remain biased to the long side.
As a result, I expect that after breaking the upper line of the symmetrical triangle, AUDCAD could rise at least to 0.9357 CAD.
First Target: 0.9357 CAD
Second Target: 0.9397 CAD
Stop Loss(SL): 0.9241 CAD
💡 Please respect each other's opinions and express agreement or disagreement politely.
📌Australian Dollar/Canadian Dollar Analysis (AUDCAD), 4-hour time frame.
🛑 Always set a Stop Loss(SL) for every position you open.
✅ This is just my idea; I’d love to see your thoughts too!
🔥 If you find it helpful, please BOOST this post and share it with your friends.
Audcadlong

AUDCAD Under Heavy Supply | Downside Targets Align🔻🔥 AUDCAD Under Heavy Supply | Downside Targets Align 🎯
Overview:
AUDCAD is showing strong bearish conviction, with price firmly positioned below key resistance, opening the door for a sustained move lower.
Sell Zone (Focus Area):
🔴 0.9320
This level is acting as a confirmed supply area, where selling pressure is firmly in control.
Downside Targets:
🎯 Target 1: 0.9300 – Immediate downside reaction
🎯 Target 2: 0.9280 – Momentum continuation
🎯 Target 3: 0.9260 – Structure extension
🎯 Target 4: 0.9240 – Deeper downside target
🎯 Target 5: 0.9200 – Major downside objective
🚀 Extended Target: 0.9180 – Possible stretch if selling accelerates
Why This Setup Works:
✔ Strong rejection from a confirmed resistance level
✔ Clear bearish structure with momentum alignment
✔ Clean downside path with multiple target zones
Trade Management Insight:
Gradual profit booking across targets allows capital protection while keeping exposure for extended moves.
Execution Guidance:
Wait for price acceptance or rejection near the sell level before execution. Precision and patience matter.
Final Note:
As long as price respects the resistance level, downside continuation toward lower targets remains the dominant scenario.
⸻
✨ Special Note for Serious Traders
If you look for high-conviction setups with defined targets and disciplined execution, feel free to connect. I work closely with traders who value structure, control, and long-term consistency.
🔒 High conviction. Clear targets. Professional execution.

AUD/CAD Technical Outlook: Bullish Continuation Scenario🔥 AUD/CAD BULLISH BREAKOUT | Swing/Day Trade Setup 📈
🎯 AUSSIE DOLLAR VS CANADIAN DOLLAR - Forex Market Opportunity
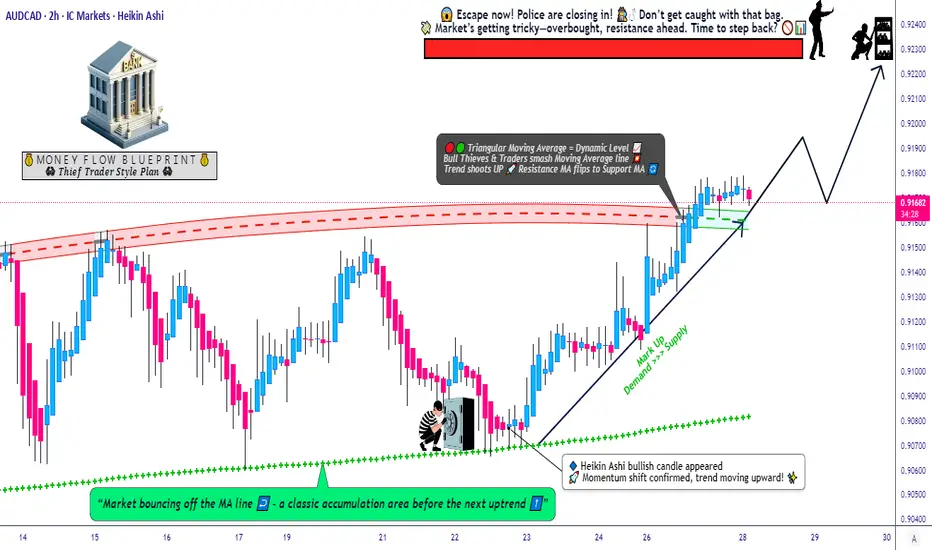
📊 CURRENT MARKET STATUS
Live Price: 0.91588 CAD (December 24, 2025)
Trend: BULLISH ✅
Setup Type: Triangular MA Pullback + SMA Dynamic Resistance BREAKOUT
🎲 THIEF STRATEGY - LAYERED ENTRY METHOD
⚡ ENTRY ZONES (Multi-Layer Limit Orders):
🔹 Layer 1: 0.91400
🔹 Layer 2: 0.91500
🔹 Layer 3: 0.91600
💡 Tip: Scale in based on YOUR risk tolerance - Add more layers if desired
Current Price Action: Market trading near Layer 2-3 zone - ACTIVE ENTRY WINDOW
🛡️ RISK MANAGEMENT
🔴 STOP LOSS (Thief's SL): 0.91300
⚠️ IMPORTANT: Dear Ladies & Gentlemen (Thief OG's) - This is MY stop loss level. ADJUST YOUR SL BASED ON YOUR OWN STRATEGY & RISK APPETITE. You are responsible for your own risk management.
🎯 PROFIT TARGET
🟢 TARGET: 0.92200
Exit Reasoning:
✅ Police Barricade = Strong Resistance Zone
✅ Overbought Conditions Expected
✅ Potential Trap + Correction Zone
✅ Take Profits & ESCAPE with Gains!
⚠️ IMPORTANT: Dear Ladies & Gentlemen (Thief OG's) - This is MY take profit level. YOU CAN TAKE MONEY AT YOUR OWN RISK. Not financial advice - make your own decisions!
📈 CORRELATED PAIRS TO WATCH
💵 USD-Based Correlations:
AUD/USD - Primary correlation driver (0.6613 current price)
Positive correlation: AUD strength benefits both pairs
USD/CAD - Inverse correlation monitor
CAD weakness = AUD/CAD bullish support
NZD/CAD (0.7939) - Regional correlation
Oceanic currency strength indicator
AUD/JPY (104.31) - Risk sentiment gauge
Risk-on = AUD strength, supports our bullish view
⛽ Commodity Correlation:
Crude Oil Prices - CRITICAL for CAD strength
⬇️ Oil DOWN = CAD Weakness = AUD/CAD UP ✅
⬆️ Oil UP = CAD Strength = AUD/CAD Pressure ⚠️
📰 KEY ECONOMIC FACTORS TO CONSIDER
🇦🇺 AUSTRALIA (AUD Drivers):
Reserve Bank of Australia (RBA) Policy
Interest rate decisions
Monetary policy stance
Commodity Exports
Iron ore prices (China demand)
Coal & LNG exports
China Economic Data
Australia's largest trading partner
Manufacturing PMI, GDP growth
Employment Change & Wage Growth
Labor market strength = AUD support
Australian Q3 GDP (upcoming key release)
🇨🇦 CANADA (CAD Drivers):
Bank of Canada (BoC) Policy
Rate cuts expectations
Inflation targeting (CPI data)
Crude Oil Prices ⛽ (MOST IMPORTANT)
Canada's top export
WTI & Brent correlation
US Economic Data
85% of Canadian exports go to USA
USD/CAD heavily influences AUD/CAD
Employment Data & GDP
Canadian economic health indicators
Trade Balance
Export/import levels impact CAD value
🧠 TECHNICAL SETUP SUMMARY
✅ Triangular Moving Average pullback completed
✅ Simple Moving Average dynamic resistance BROKEN
✅ Support zone holding at lower entry layers
✅ Bullish momentum building for 0.92200 target
✅ Risk-reward ratio favorable with layered entries
💬 Engagement Question for Community:
👉 What's YOUR take on AUD/CAD? Are you watching crude oil prices or RBA policy more closely? Drop your analysis below! 👇
🔔 Follow for more setups | 👍 LIKE if this helps | 💬 COMMENT your thoughts
#AUDCAD #ForexTrading #SwingTrade #DayTrading #ThiefStrategy #TechnicalAnalysis #ForexSignals #TradingView #CommodityCurrencies #RiskManagement

Trading The AUD/CAD Breakout - A Systematic Approach.🎯 Aussie vs Cad Dollar – Market Capital Flow Blueprint (AUD/CAD Bull Setup) 🦘🍁
Hello Market Money Makers & Thief OG’s!
We’re watching the AUD/CAD pair with a bullish bias — the Aussie is showing strength vs the Loonie, and the capital-flow looks supportive. Here’s the plan:
📈 Setup:
A breakout of the triangular moving average structure has just been confirmed — signalling a potential swing/day trade environment.
Risk-reward is favourable, and layered entries give us flexibility in execution.
🛒 Entry Strategy (Layering Style):
Using multiple buy limit orders (classic Thief layering method) at the following levels:
0.91300
0.91400
0.91500
0.91600
(You can add more layers if you like — scale as you see fit.)
🚫 Stop Loss (Thief’s SL):
0.91100 — if price drops below here the trade is invalidated.
Note: Dear Ladies & Gentlemen (Thief OG’s), I am not recommending you blindly follow my SL — it's your choice, you can make money then take money at your own risk.
🎯 Target (TP):
0.92300 — this level acts as a police barricade (strong resistance) + overbought trap zone.
Note: Dear Ladies & Gentlemen (Thief OG’s), I am not recommending you blindly follow my TP — it's your choice, you can make money then take money at your own risk.
🔍 Watch-Pairs / Correlations:
OANDA:USDCAD – watch relative strength of USD vs CAD.
OANDA:AUDJPY – for Aussie strength confirmation.
OANDA:GBPCAD – another CAD-weakness proxy.
Monitoring these helps us see if CAD remains weak or if AUD continues to shine.
📌 Key Points / Why This Setup Works:
Capital flow: Aussie assets drawing interest, contributing to AUD strength.
Breakout confirmation: Moving average triangle resolved bullishly.
Layered entries: lets us average into the trade if price comes down to support.
Target zone backed by resistance and structural trap — good exit zone.
Stop-loss placement protects capital if market flips direction.
✨ “If you find value in my analysis, a 👍 and 🚀 boost is much appreciated — it helps me share more setups with the community!”
Disclaimer: This is Thief style trading strategy just for fun.
#AUDCAD #Forex #FX #DayTrade #SwingTrade #CapitalFlow #LayeringStrategy #ThiefTrader
Swing Trading AUD/CAD: A Detailed Bullish Scenario📌 𝐀𝐬𝐬𝐞𝐭: AUD/CAD — “Aussie vs Canadian Dollar”
𝐅𝐨𝐫𝐞𝐱 𝐌𝐚𝐫𝐤𝐞𝐭 𝐓𝐫𝐚𝐝𝐞 𝐎𝐩𝐩𝐨𝐫𝐭𝐮𝐧𝐢𝐭𝐲 𝐆𝐮𝐢𝐝𝐞 (𝐒𝐰𝐢𝐧𝐠 𝐓𝐫𝐚𝐝𝐞)
🧭 𝐓𝐫𝐚𝐝𝐞 𝐏𝐥𝐚𝐧: 𝐁𝐮𝐥𝐥𝐢𝐬𝐡 — 𝐌𝐀 𝐏𝐮𝐥𝐥𝐛𝐚𝐜𝐤 + 𝐏𝐫𝐞𝐜𝐢𝐬𝐞 𝐑𝐞𝐭𝐞𝐬𝐭 𝐂𝐨𝐧𝐟𝐢𝐫𝐦𝐞𝐝
The trend structure remains bullish with clean higher-lows. Price has reacted strongly from the dynamic support zone around the Moving Averages, validating a trend-continuation setup. Momentum stays on the buyers’ side with exhaustion signs on the sellers.
🎯 𝐄𝐧𝐭𝐫𝐲: 𝐌𝐮𝐥𝐭𝐢-𝐋𝐚𝐲𝐞𝐫 𝐁𝐮𝐲 𝐎𝐫𝐝𝐞𝐫 𝐒𝐭𝐫𝐚𝐭𝐞𝐠𝐲 (𝐓𝐡𝐢𝐞𝐟 𝐌𝐞𝐭𝐡𝐨𝐝)
This plan uses a layered limit entry system to reduce risk and improve average execution:
Buy Limit Layers:
0.91400
0.91500
0.91600
0.91700
(You may increase or decrease layers based on your personal strategy.)
Concept: This layering method allows catching pullback liquidity sweeps and retest reactions across micro-levels — ideal for swing positioning.
🛡️ Stop Loss (SL): 0.91200
This is the proposed Thief SL.
However, you must adjust SL based on your risk tolerance, trade size, and personal strategy.
Your money—your responsibility.
🎯 Target (TP): 0.92400
Price is approaching a Police Barricade Zone — a strong resistance area where:
Market is entering overbought territory,
A possible bull trap might form,
Liquidity zones cluster tightly.
Take profits safely.
Again, adjust TP as per your risk and comfort.
📚 Related Pairs to Watch (Correlation Insights)
💱 1. USD/CAD ( OANDA:USDCAD )
Correlation: Moderate Positive
When CAD strengthens (often due to oil), USDCAD tends to drop, and AUDCAD may also feel downside pressure.
Watch oil and CAD macro data.
💱 2. AUD/USD ( OANDA:AUDUSD )
Correlation: Strong Positive with AUD strength
If AUD shows broad market strength versus USD, chances increase for AUD to outperform CAD as well.
Risk sentiment (RISK-ON/RISK-OFF) heavily impacts it.
💱 3. CAD/JPY ( OANDA:CADJPY )
Correlation: Risk sentiment indicator
When CADJPY weakens, global risk sentiment may be shifting, which can slow AUDCAD bullish momentum.
💱 4. AUD/JPY ( OANDA:AUDJPY )
Correlation: High risk sentiment sensitivity → guidance for AUD strength
If AUDJPY rallies, it shows strong AUD flows—supportive for AUDCAD longs.
💱 5. WTI Crude Oil ( TVC:USOIL )
Correlation: Inverse Effect on AUDCAD
CAD is an oil-linked currency.
Rising oil → CAD strengthens → AUDCAD may drop.
Falling oil → CAD weakens → AUDCAD tends to rise.
🧠 Final Notes
This is a structured swing setup designed for layered execution, strong risk control, and clarity.
Always adapt entries, stops, and targets to your own strategy.
Trade responsibly, trade smart.

Bulls Still in Control?Hello traders! Here’s an idea for AUDCAD based on current structure, trend, and momentum.
(This is market analysis, not financial advice. Always use proper risk management and seek additional confirmations before entering a trade.)
Intraday Buy Idea (short term move)
• Entry: 0.91500 – 0.91600
• Stop-Loss: 0.91350 – 0.91300
• Target Area: 0.91800 – 0.92000
⸻
Market Analysis
AUD/CAD continues to trade within a relatively modest daily range—typical for this pair—especially as we approach the end of Q4 and move deeper into the holiday season, when liquidity thins and price action often becomes more choppy and range-bound.
On the 4-hour chart, an inverted head-and-shoulders pattern has formed. The market recently closed above the neckline/right-shoulder zone, confirming potential bullish structure. A clean retest of this zone (around 0.91500-0.91600) could provide an opportunity to catch the continuation of the bullish momentum that began late last week (around Nov 21).
Our target—0.92000—lines up closely with November’s high and a key structural resistance level. If momentum remains intact, price could attempt another test of this area.
⸻
Fundamentals (per economic sources)
Australia (AUD)
• The RBA has kept rates steady, maintaining stability in the AUD.
• Commodity prices trending higher (especially metals) provide underlying support for the Australian dollar.
• A potential shift toward U.S. Federal Reserve rate cuts later on can indirectly support AUD through broader USD softness and risk-on flows. (per economic sources)
Canada (CAD)
• Canada’s manufacturing sector continues to contract, signaling broader weakness.
• While recent GDP growth was positive, the expansion was driven mainly by oil exports and government spending, not broad economic strength.
• Mixed and uneven economic performance may limit near-term CAD strength.
Combined, these factors support a slightly bullish bias for AUD/CAD in the near term, aligning with this technical setup.

Choppy market, but still present opportunities…Hello traders!
Weekly outlooks will most likely be published over the weekend while the market is closed. This gives us the opportunity to analyze the market while it is dormant to eliminate the noise. We will begin the AUDCAD.
Short-term technicals are suggesting a slightly bullish market. Within the next month, we could see a choppy market where price range between 0.90500 and 0.91500. This could be likely since there are no major central bank surprises expected in the next 2–4 weeks and the commodities such as oil for Canada and iron for Australia are currently stable and RBA & BoC holding rates steady as we head into December, hopefully no surprises from China.
Looking at the chart provided, we had a weekly low around 0.90671 on Tuesday right before midnight and the market rallied quickly 0.91320. This low that was created act as a strong support this week and the market attempted to break below this support and failed as buyers took advantage of a premium price near 0.90500. We end the trading week closing above 0.91000 which may indicate bullish intentions, at least for now. If price remains above 0.90500, we could see this pair trading around 0.91500 before the end of the quarter.
This is an idea, not a signal…. and we should continue looking for confirmations. Remember, we can always try to predict the market, but it’s best to know when to react.

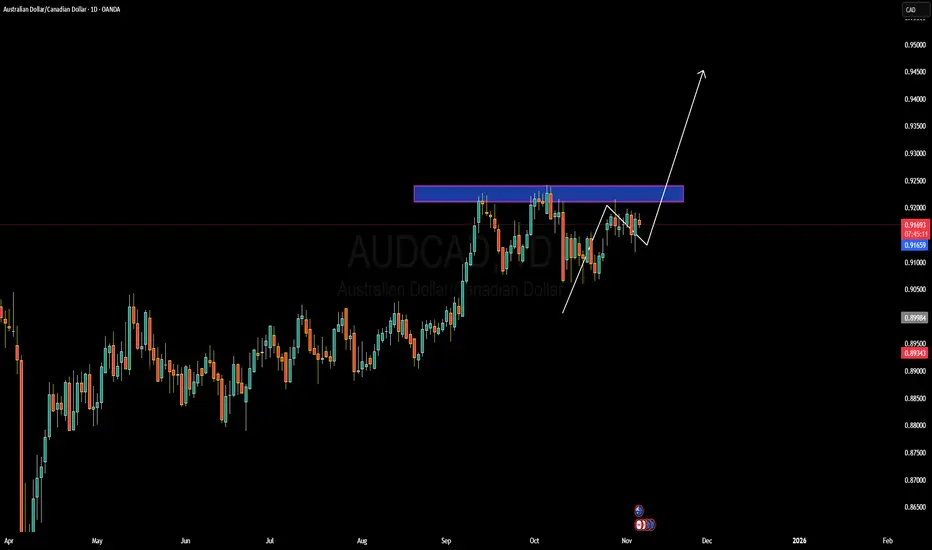
AUDCAD Forming Bullish MomentumAUD/CAD has formed a clean base around the 0.9150–0.9200 range, suggesting that buyers are defending this zone and accumulation may be underway. The recent move upward with a potential breakout in play aligns with a view that the Aussie could be set for further strength. If momentum continues, we could see AUD push toward the 0.9300–0.9400 area, which would be a compelling risk-reward opportunity for bulls.
On the macro side, there’s a strong interest rate differential working in favor of AUD. The Reserve Bank of Australia is holding its rate at 3.60%, according to recent data, while the Bank of Canada has cut its rate to 2.25%, signifying a dovish tilt. This gap draws carry flows toward the AUD from yield-seeking investors. Meanwhile, Australia’s economic growth outlook remains decent, with the RBA projecting GDP to grow by around 2.0% in December 2025.
Commodity plays also support AUD strength: as a major exporter of raw materials, Australia benefits when global demand remains firm. That said, downside risks exist. A sharper-than-expected economic slowdown in Canada, combined with further rate cuts, could weigh on the loonie and reinforce AUD strength. On the flip side, if Australia faces inflationary pressures, the RBA might be forced to re-adjust its policy, which could compress the rate edge.

AUDCAD: Bearish as Aussie Struggles Against Resilient LoonieAUDCAD has come under renewed selling pressure, sliding back toward key support zones after failing to sustain gains above 0.9200. The Canadian dollar remains supported by solid employment data and oil market stability, while the Australian dollar faces headwinds from weaker Chinese demand and a cautious RBA. With momentum shifting lower, AUDCAD looks poised for further downside if support levels give way.
Current Bias
Bearish – Price is testing the lower end of its recent consolidation and risks breaking down toward 0.8950.
Key Fundamental Drivers
AUD Weakness: RBA’s cautious tone and China’s slower growth outlook weigh heavily on the Australian dollar.
CAD Strength: Stronger-than-expected labor market data and oil resilience underpin CAD.
Commodity Flows: Oil boosts CAD, while iron ore softness limits AUD upside.
Macro Context
Interest Rate Expectations: RBA remains cautious, signaling no rush to hike, while BoC is data-dependent but reluctant to cut aggressively amid still-high inflation.
Economic Growth Trends: Australia faces slowing domestic consumption, while Canada’s growth outlook is steadier, albeit with labor market slack.
Commodity Flows: CAD benefits from oil’s relative stability, while AUD remains exposed to weakening iron ore demand from China.
Geopolitical Themes: US-China tariff tensions pressure AUD more directly, while CAD benefits from closer US trade alignment.
Primary Risk to the Trend
A rebound in Chinese stimulus measures or stronger-than-expected Australian data could provide support for AUD.
Most Critical Upcoming News/Event
Australia jobs data and CPI prints – critical for RBA policy outlook.
Canada CPI – pivotal for BoC’s rate stance.
Leader/Lagger Dynamics
AUDCAD is typically a lagger, reflecting broader AUD performance against China-sensitive pairs and CAD’s alignment with oil. It follows AUDUSD trends and CAD crosses but reacts slower than majors like AUDUSD or USDCAD.
Key Levels
Support Levels:
0.9050
0.8950
Resistance Levels:
0.9160
0.9230
Stop Loss (SL): 0.9230
Take Profit (TP): 0.8950
Summary: Bias and Watchpoints
AUDCAD is bearish, with downside momentum reinforced by weak AUD fundamentals and firmer CAD drivers. A break below 0.9050 opens the path to 0.8950, while resistance at 0.9160–0.9230 caps upside. Stop loss sits above resistance at 0.9230, and profit-taking is aimed near 0.8950. Watch for Australia’s jobs/CPI data and Canada’s CPI as the key catalysts that could either reinforce or undermine this bearish setup.

AUDCAD Forming Bullish ContinuationAUDCAD is showing strong signs of a potential bullish continuation as price consolidates just below a key resistance zone around the 0.9200 region. The market has maintained higher lows, reflecting steady buyer interest and a gradual shift in sentiment toward the upside. If the pair manages to break above this resistance with strong momentum, it could confirm a breakout structure, opening the door for a rally toward the 0.9350–0.9400 levels in the coming sessions. The technical picture supports the idea of accumulation, with the market forming a bullish flag-type pattern before continuation.
From a fundamental perspective, the Australian dollar remains relatively supported as the Reserve Bank of Australia maintains a firm tone on inflation and continues to assess the impact of its prior tightening measures. Meanwhile, the Canadian dollar has been weighed down by weaker oil prices and softening domestic demand, which have limited the Bank of Canada’s ability to maintain a hawkish stance. The diverging central bank outlooks and commodity performance are creating a favorable backdrop for further AUD strength against the CAD.
As long as AUDCAD holds above the 0.9100 support region, buyers are likely to maintain control, with the next key level of interest being the 0.9250 zone. A confirmed breakout above resistance would strengthen bullish conviction and align with the broader upward trend that has been building since mid-year. This setup remains technically and fundamentally aligned for potential continuation, making it a pair to keep on the radar for bullish opportunities in the near term.
AUDCAD Forming Descending WedgeAUDCAD on the 4H timeframe has been consolidating within a descending wedge structure, and price is now breaking out of the upper trendline, signaling a potential bullish shift. The series of higher lows forming near the wedge base hints at accumulation, while repeated rejections from the lower boundary suggest sellers are losing momentum. As long as price holds above the breakout zone, I expect continuation toward 0.9220 and eventually the 0.9300 region.
On the fundamental side, the Australian dollar is gaining traction as improving risk sentiment and stabilizing commodity demand support AUD strength. Meanwhile, the Canadian dollar is softening due to recent pullbacks in crude oil prices and increasing speculation that the Bank of Canada may not maintain its hawkish stance for long if economic slowdown persists. This divergence creates a favorable backdrop for AUDCAD bulls.
I’ll be watching for a minor retest of the broken wedge resistance to confirm support. If momentum holds, buyers could drive an impulsive leg toward previous supply areas. For now, I remain bullish as long as price stays above recent breakout levels, turning this structure into a profitable continuation play.

AUDCAD Long Trade IdeaTrend: Bearish
Divergence: Bullish
Reversal Pattern: Double Bottom
Bias: Bullish
Scenario: Broke LH we will take entry at 0.382 FIB
Trade Plan
Stop Loss: 0.90565
Entry Level: 0.91215
TP: 0.9187

AUDCAD: Watching for Pullback .. Here's My Trade Plan📊 AUDCAD has rallied strongly following the release of positive RBA data, giving the Aussie a notable boost 💹.
🔎 On the chart, we can clearly see a phase of bullish expansion 🚀. At this stage, my focus is on waiting for a retracement, allowing price to pull back and then confirm with a bullish break of structure on a lower timeframe for a long entry 🎯.
⚠️ Disclaimer: This analysis is for educational purposes only and not financial advice. Always apply proper risk management.

AUDCAD — Holding > 0.91477; Stay bullishChronex | AUDCAD - Bullish - Conviction - Medium | buy pullbacks
Structure: Bullish
Market Phase: Extension
Orderflow: Bullish
Daily: Bullish
H4: Bullish
H1: Bullish
Liquidity: Target IRL then ERL
Entry Model: Chain
Follow for timely Signals and Setups
What would make you stand aside today?

AUDCAD Will Keep Growing!
HI,Traders !
#AUDCAD made a bullish
Breakout of the key horizontal
Level of 0.90286 and the
Breakout is confirmed so
We are bullish biased
And we will be expecting
A further bullish continuation !
Comment and subscribe to help us grow !

AUDCAD - Expecting Bullish Continuation In The Short TermH1 - Strong bullish momentum.
No opposite signs.
Until the two Fibonacci support zones hold I expect the price to move higher further.
If you enjoy this idea, don’t forget to LIKE 👍, FOLLOW ✅, SHARE 🙌, and COMMENT ✍! Drop your thoughts and charts below to keep the discussion going. Your support helps keep this content free and reach more people! 🚀
--------------------------------------------------------------------------------------------------------------------

AUDCAD Bullish Setup: Waiting for the Pullback📈 The AUDCAD is showing strong bullish momentum ✅. I’m watching for a pullback on the 30-minute timeframe ⏰ into equilibrium ⚖️ as a potential buy opportunity 💹. Everything is broken down in the video 🎥 (not financial advice ⚠️).

AUDCAD Forex Heist Plan: Entry, SL & TP by Thief Trader Style🏴☠️🔥 AUD/CAD Bank Heist Plan – Thief Trader's Long Con in Motion! 🔥🏴☠️
Breakout Bulls vs Bearish Guards – Who Wins the Forex Vault This Time?
🌍 Hello Money Makers, Market Bandits, and Strategic Robbers! 💰🚀💣
It’s Thief Trader back again, dropping heat with another high-stakes Forex bank job – this time we're targeting the AUD/CAD vault. This is not your grandma’s trading plan. We’re executing a well-calculated heist based on a fusion of technical breakouts + fundamental drivers with a dose of pure trading psychology warfare. 🎯
💼 The Heist Blueprint: Long Entry Game Plan
🧠 Our job is to move in silence until the breakout alarms go off.
We target 0.90200 as the clean breakout trigger over the Moving Average. This zone marks the guard shift — bulls take over if we break through.
📌 Entry Types (Choose your weapon):
🔹 Buy Stop: Above 0.90200 (Post-MA breakout confirmation).
🔹 Buy Limit (DCA Style): Set limit buys at recent lows (M15/M30 swing low) for pullback entries. Layer your entries like a true strategist.
🔔 Set Alerts: Don't sleep on this. Place alerts at breakout zones – let the chart notify you when the bank door opens. 📡
🛑 Risk Management – The Escape Plan
We don't jump in blind. Place your Stop Loss ONLY AFTER the breakout confirms.
📍Suggested SL: 0.89600, near recent 4H wick low.
🔥 Reminder: Your stop depends on your lot size, risk tolerance, and how many entries you're stacking. Don't set it too tight – we don't want early alarms killing the mission.
🎯 Profit Target – Rob & Exit
📍 Primary TP: 0.91200
🎭 Or simply: Escape before the alarm rings (i.e., close early if you see price weakness near resistance or news surprises).
🧲 Scalpers, stick to long bias only. If you're running capital deep, go in hard. If not, ride with the swing team. Use trailing SLs to protect and ride the move like a ghost.
🧠 Behind the Heist – What Fuels Our Mission?
The AUD/CAD pair is showing bullish signs backed by:
✴️ Macroeconomic indicators
✴️ Central Bank divergences
✴️ COT data (Commitment of Traders)
✴️ Intermarket correlations
✴️ Sentiment shifts & positioning strategies
Before executing any trade, read your fundamentals. Study the landscape. Then strike. 🕵️♂️
⚠️ Trading Safety Alert – Timing Is Everything
🚫 Avoid placing trades during high-impact news.
✅ Use trailing SL to lock in profits and prevent whipsaw hits.
📊 Protect your capital like it’s stolen loot – because it is!
💥Support the Crew 💥
🚀 Smash that 💗 Boost Button if you’re vibing with the plan.
Every like strengthens the Thief Trading Crew – and gets us closer to daily market domination. 🎉💪
📲 Stay locked in. Another heist is coming soon.
Till then – rob smart, trade sharp, and vanish like a legend. 🐱👤💸
🔑 #AUDCAD #ThiefTrader #ForexBreakout #LongSetup #ScalpToSwing #TradeWithPlan #DCAEntry #ForexHeist #MarketStrategy #RiskReward

AUDCAD Long Position levels
A long position is initiated on AUDCAD following a significant bullish breakout from a multi-day consolidation. This idea outlines a two-tiered take-profit strategy, targeting key psychological and structural resistance levels, while managing risk with a defined stop loss.
Entry: 0.89560
Take Profit 1: 0.9001
Take Profit 2: 0.91560
Stop Loss: 0.88808
Current Status & Outlook: The price is currently trading just above the potential entry point. The trade is based on the expectation of a sustained upward move after the recent breakout, with a clear strategy for taking profits and managing risk.
Disclaimer
This analysis is for educational and informational purposes only and does not constitute financial advice. The provided trade idea is based on technical analysis and historical price action, and past performance is not indicative of future results. Trading foreign exchange on margin carries a high level of risk and may not be suitable for all investors. Before deciding to trade, you should carefully consider your investment objectives, level of experience, and risk appetite. You could lose some or all of your initial investment. Seek advice from an independent financial advisor if you have any doubts. Any action you take upon the information on this chart and analysis is strictly at your own risk.

AUDCAD – DAILY FORECAST Q3 | W31 | D30 | Y25
📊 AUDCAD – DAILY FORECAST
Q3 | W31 | D30 | Y25
Daily Forecast 🔍📅
Here’s a short diagnosis of the current chart setup 🧠📈
Higher time frame order blocks have been identified — these are our patient points of interest 🎯🧭.
It’s crucial to wait for a confirmed break of structure 🧱✅ before forming a directional bias.
This keeps us disciplined and aligned with what price action is truly telling us.
📈 Risk Management Protocols
🔑 Core principles:
Max 1% risk per trade
Only execute at pre-identified levels
Use alerts, not emotion
Stick to your RR plan — minimum 1:2
🧠 You’re not paid for how many trades you take, you’re paid for how well you manage risk.
🧠 Weekly FRGNT Insight
"Trade what the market gives, not what your ego wants."
Stay mechanical. Stay focused. Let the probabilities work.
FX:AUDCAD

AUDCAD – WEEKLY FORECAST Q3 | W31 | Y25📊 AUDCAD – WEEKLY FORECAST
Q3 | W30 | Y25
Weekly Forecast 🔍📅
Here’s a short diagnosis of the current chart setup 🧠📈
Higher time frame order blocks have been identified — these are our patient points of interest 🎯🧭.
It’s crucial to wait for a confirmed break of structure 🧱✅ before forming a directional bias.
This keeps us disciplined and aligned with what price action is truly telling us.
📈 Risk Management Protocols
🔑 Core principles:
Max 1% risk per trade
Only execute at pre-identified levels
Use alerts, not emotion
Stick to your RR plan — minimum 1:2
🧠 You’re not paid for how many trades you take, you’re paid for how well you manage risk.
🧠 Weekly FRGNT Insight
"Trade what the market gives, not what your ego wants."
Stay mechanical. Stay focused. Let the probabilities work.
FX:AUDCAD

AUDCAD - Possible Buy Setup AheadThe market is approaching a significant zone.
We’re standing by — no rush, no guessing.
If a clean bullish signal appears, we go long.
If it breaks through, we wait for a pullback and adapt.
Our job isn’t prediction — it’s reaction.
Follow the plan. Let the profits take care of themselves
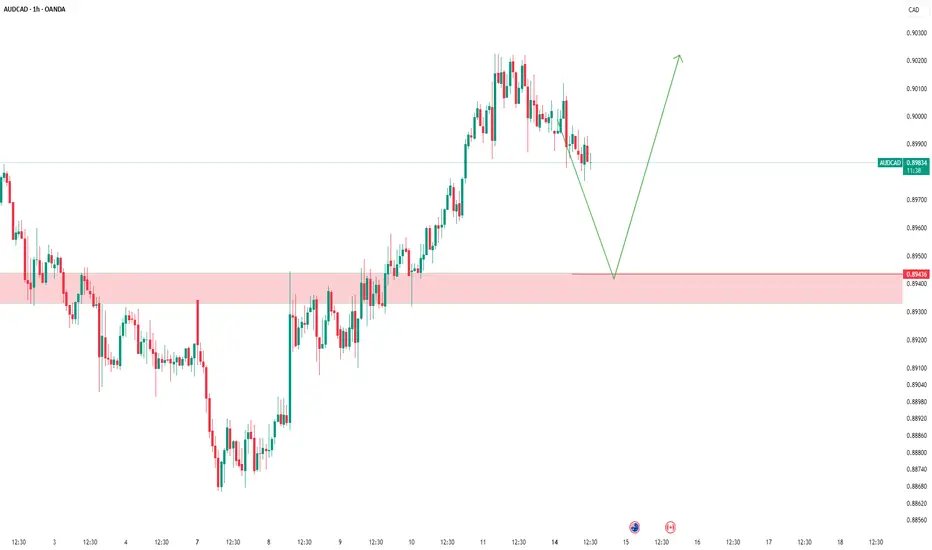
AUDCAD | Weekly Outlook | July 14, 2025🟦 AUDCAD | Weekly Outlook | ICT-Based Analysis
📅 Week Starting: July 14, 2025
🧠 "Don't chase — let the trade come to you."
🧭 Market Context (1H + HTF Alignment)
This chart outlines a clear Smart Money framework for AUDCAD using ICT principles. The market recently completed a manipulation phase below a major accumulation zone, forming a clear SMT divergence and respecting a CISD (Clean Internal Sell-side Displacement).
After manipulation and SMT confirmation, price respected the CISD and showed willingness to displace bullishly, suggesting a potential re-accumulation phase on the lower timeframes.
🔍 Key Observations
Accumulation + SMT:
We had a prolonged accumulation phase that led to a smart money manipulation (fakeout), marked by SMT divergence. This was followed by a bullish shift in structure, confirming intent.
CISD + CE Reaction:
Price respected the CISD zone and formed a bullish W reversal + OB/BI setup. This is a common ICT pattern before major expansions.
Re-Accumulation Area:
The current consolidation near ERL levels shows signs of controlled accumulation, with price respecting previous liquidity levels.
This area may act as a springboard for expansion towards HTF objectives.
📈 HTF Targeting: Reversal Area + EQH
The chart marks a High Time Frame Reversal Area (HTF) above the current price, potentially acting as a premium inefficiency or sell-side liquidity target.
EOH (Expansion Objective High) is drawn in that same region, providing a long-term magnet for price.
This aligns with the broader Monthly Cycle expectation.
🔄 Monthly Cycle Analysis
“Monthly Cycle is Created — Open, Low... Now We Wait for the High and Close.”
This suggests:
Monthly Open and Low are already formed.
A bullish monthly cycle is anticipated — meaning we're waiting for the High to form next.
Once the high is set, a retracement towards the Close level is expected by the end of the month.
This macro view gives us context for aiming long positions on pullbacks — buying dips within the re-accumulation range.
⚠️ Trader's Insight
Don’t Chase — Let the Trade Come to You.
The setup is not about chasing price. Instead, the idea is to:
Wait for price to return to favorable zones (e.g., CE of OB inside CISD)
Confirm intent with LTF SMT, FVGs, or M15 structural shifts
Target HTF inefficiencies and liquidity zones (EOH & Reversal Area)
🎯 Bias for the Week
Bullish, based on:
Monthly cycle direction (expecting HIGH)
Price behavior post-CISD respect
Clear smart money accumulation and displacement
Re-accumulation on LTFs suggesting continuation
