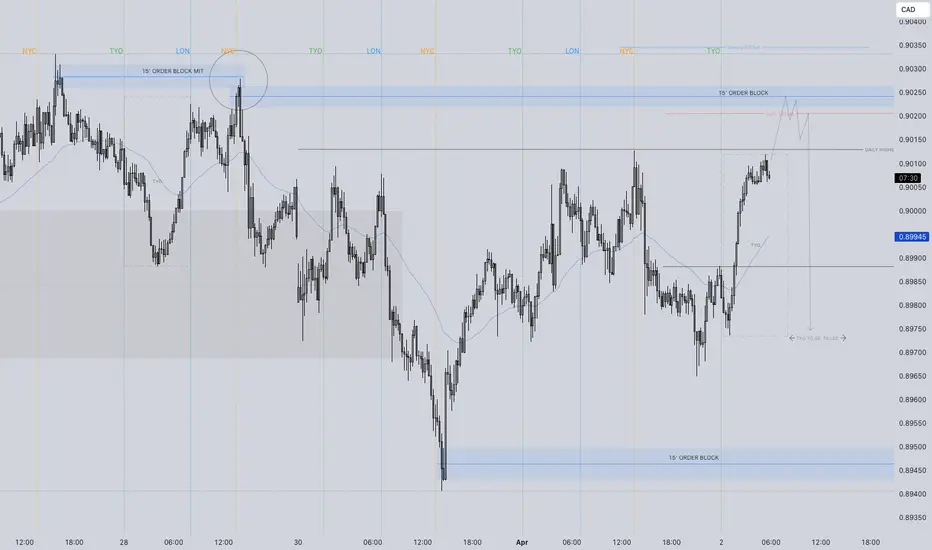
AUDCAD SHORT Q2 W14 Y25 WED 2ND APRIL 2025AUDCAD SHORT Q2 W14 Y25 WED 2ND APRIL 2025
All the ingredients for a high probability short position. Weekly & daily 50 Exponential moving averages coming to join the short party. Higher time frame, namely the weekly time frame currently range with EMA beautifully in the middle of price action. That leaves from a deeper look into the lower time frames to see where the higher time frame EMA's line up.
I'll keep it snappy, what I require is price NOT to touch the Tokyo lows. This is added into the bag of FRGNT confluences. Price needs to trickle into the 15' just above the current Tokyo session. I need lower time frame breaks of structure to form post London open. A lower time frame order block to be created to short from. 5' Break of structure is what is I'd like to see.
Short and snappy short synopsis. I hope the photo paints the narrative better than I can explain it.
FRGNT X
Audcadshort
#AUDCAD: 548+ Pips Selling Opportunity! Comment Your Views? OANDA:AUDCAD
We have a good selling opportunity coming up and this can worth up to 548 pips. We estimate trade to get activated within next week or so since we have NFP next week. We recommend all of you to use proper risk management. Good luck and have great weekend.

AUD/CAD Short🔍 Technical Context:
Market Structure:
Price is in a long-term sideways range with lower highs. AUD/CAD is struggling to break above the 0.90–0.91 region, showing signs of exhaustion.
Zone of Interest (Supply):
Purple box: 0.9000 – 0.9100
A clean historical rejection zone that has acted as both support and resistance multiple times since 2022.
Entry Type:
Sell Limit @ 0.9070 placed slightly below the top of the resistance zone to increase likelihood of getting triggered on a spike.
Stop Loss:
0.9175 – above multiple wick rejections and key structure highs. Allows breathing room for volatility without compromising the structure.
Take Profit Targets:
TP1: 0.8650 (conservative target at strong support)
TP2 (optional extension): 0.8500 (major long-term range low)
Risk-Reward Ratio:
~1:3 minimum to TP1, potentially 1:4+ if extended to 0.8500.
🧠 Strategic Notes:
Trigger Conditions:
Wait for a retrace to the 0.9070 zone rather than enter at market open. This is based on the idea that a final upward effort could grab liquidity and fill your limit.
Monthly Candle Watch:
Monday is month-end. Monitor the monthly close to determine if the structure still supports the trade idea. If the close is strongly bullish and you’re triggered early, be open to closing the trade early to avoid deeper drawdown.
Why It’s High Probability:
Multi-year horizontal structure
Repeated failure to hold above 0.90
Candlestick wicks rejecting the same zone
Fundamentals slightly favor CAD over AUD (higher real yields, oil correlation)
Defined invalidation point and asymmetric reward

AUDCAD Approaching Key Resistance — Potential Sell SetupOANDA:AUDCAD is approaching a key resistance zone, highlighted by strong selling interest. This area has historically acted as a supply zone, increasing the likelihood of a bearish reversal if sellers step in.
The current market structure suggests that if the price confirms resistance within this zone, we could see further downside movement. A successful rejection could push the pair toward 0.90700, a logical target based on prior price behavior and the current structure.
However, if the price breaks and holds above this resistance, the bearish outlook may be invalidated, potentially leading to further upside.
Just my take on support and resistance zones—not financial advice. Always confirm your setups and trade with solid risk management.
Best of luck!

AUD/CAD AnalysisAUD/CAD is technically in a Sell/Short Position.
You guys can manage your risk accordingly.


AUDCAD — Sell Setup at Key Resistance LevelOANDA:AUDCAD has reached a key resistance zone, highlighted by strong selling interest. This area has historically acted as a supply zone, increasing the likelihood of a bearish reversal if sellers step in.
The current price action suggests that if the pair confirms resistance through signals like bearish engulfing candles, long upper wicks, or increased selling volume, we could see a downward move toward 0.90250 — a logical target based on previous price behavior and market structure.
However, if the price breaks above this zone and sustains, the bearish outlook may be invalidated, opening the door for further upside.
Just my take on support and resistance zones—not financial advice. Always confirm your setups and trade with solid risk management.
Best of luck!

AUDCAD sellAUDCAD possible sells as the market had a double top on the 4hour 15 min and 5 min confirming this with a break of structure on 15 min and 5 min double top.

AUDCAD SELL IDEAOANDA:AUDCAD Overall bias is bearish. Price made a retest into the Daily AOI, awaiting a 4h bearish engulfing to confirm bearish bias to the downside on AUDCAD

AUDCAD - Look for a long !!Hello traders!
‼️ This is my perspective on AUDCAD.
Technical analysis: Here we are in a bullish market structure from 4H timeframe perspective, so I look for a long. My point of interest is imbalance filled + rejection from bullish OB.
Fundamental news: Upcoming week on Wednesday (GMT+2) we will see results of CPI on AUD and Interest Rate on CAD. News with high impact on currencies.
Like, comment and subscribe to be in touch with my content!

AudCad should follow the trend.Looking for Impulse Down.
AudCad now at Daily FVG area. I am expecting it will follow down trend to take lower liquidity. Make sure you have your own rules on RR and follow them. This is just a trading idea to help you gain better knowledge. If you have any question ask me in comments.
Learn & Earn!
Wave Trader Pro

AUDCAD Will Fall!
HI,Traders !
AUD-CAD made a retest
Of the horizontal resistance
Level of 0.90051 and we are
Already seeing a local
Bearish reaction so
We will be expecting a
Further move down!
Comment and subscribe to help us grow!

AUDCAD - Short from bearish OB !!Hello traders!
‼️ This is my perspective on AUDCAD.
Technical analysis: Here we are in a bearish market structure from 4H timeframe perspective, so I look for a short. My point of interest is imbalance filled + rejection from bearish OB.
Fundamental news: Upcoming week on Thursday (GMT+2) we will see results of Unemployment Rate on AUD, news with high impact on currency.
Like, comment and subscribe to be in touch with my content!

AUDCAD SELLING OPPORTUNITY.1D TF broke structure to the downside . my bias is bearish now . looking for price to retrace to my entry point.

AUDCAD - Look for a short !!Hello traders!
‼️ This is my perspective on AUDCAD.
Technical analysis: Here we are in a bearish market structure from 4H timeframe perspective, so I look for a short. I expect price to continue the retracement to fulfill the imbalance and then to reject from bearish OB.
Like, comment and subscribe to be in touch with my content!

AUDCAD SELLING OPPORTUNITYOANDA:AUDCAD
Audcad is in bearish trend , possible short opportunity.broke stracture to the downside.

Sell AUD/CAD Triangle BreakoutThe AUD/CAD pair on the M30 timeframe presents a Potential Selling Opportunity due to a recent breakout from a Triangle Pattern. This suggests a shift in momentum towards the downside in the coming hours.
Possible Short Trade:
Entry: Consider Entering A Short Position Below the Broken Trendline Of The Triangle After Confirmation. Ideally, This Would Be Around 0.9104
Target Levels:
1st Support – 0.9060
2nd Support – 0.9032
Your likes and comments are incredibly motivating and will encourage me to share more analysis with you.
Best Regards, KABHI FOREX TRADING
Thank you.

Sell AUD/CAD @ Bearish FlagThe AUD/CAD pair on the M30 timeframe presents a potential selling opportunity due to a recent downward breakout from a well-defined Bearish Flag pattern. This suggests a shift in momentum towards the downside in the coming Hours.
Key Points:
Sell Entry: Consider entering a short position around the current price of 0.9140, positioned close to the breakout level. This offers an entry point near the perceived shift in momentum.
Target Levels:
1st Support – 0.9093
2nd Support – 0.9058
Your likes and comments are incredibly motivating and will encourage me to share more analysis with you.
Best Regards, KABHI FOREX TRADING
Thank you.

AUDCAD Will Keep Falling!OANDA:AUDCAD AUDCAD is falling down
After the bearish breakout
Of the key horizontal level
Of 0.91695 which is now a
Resistance and we will be
Expecting a bearish continuation !

AUDCAD - Downside move !!Hello traders!
‼️ This is my perspective on AUDCAD.
Technical analysis: Here we are in a bearish market structure from 4H timeframe perspective, so I look for a short. I expect bearish price action after price filled the imbalance and rejected from bearish OB.
Like, comment and subscribe to be in touch with my content!

AUDCAD reached resistance of its trendline!AUDCAD reached the resistance and potentially will make reversal in 1H
Good luck!
SELL AUDCAD 0.925
SL 0.9305
TP 0.915

AUDCAD Short Trade SetupA short trade opportunity recently presented itself on the aussie-loonie trading chart.
This is occasioned by the bearish order block which acts as a resistance zone preventing any further upward price movement, the bearish engulfing candlestick pattern just inside the bearish order block and the fair value gaps in the uptrend prior to the price reversal.
The upward FVGs create a price imbalance which price will try to compensate for by moving downwards. These three confluences indicate the likelihood of a downward price movement.
With an entry price of 0.92390 or thereabouts, a stop order at 0.94059 (just above the most recent swing high indicated by the pivot point at 0.93772) and a profit target (0.88618) close to the level of one of the lowest most recent swing lows (just above the bullish order block which acts as a support zone to prevent any further downward price movement), we could potentially be looking at a 2.26 RR ratio or higher.
That's 166.9 PIPS risk (SL) and 377.2 PIPS target (TP).
Alternatively, you could decide not to set any TP and just trail your stops to make the most out of the market.
As always, please apply appropriate risk management depending upon your trading account balance, your risk appetite and other important factors.

AUDCAD - Short active !!Hello traders!
‼️ This is my perspective on AUDCAD.
Technical analysis: Here we are in a bearish market structure from 4H timeframe perspective, so I look for a short. I expect bearish price action from here as price filled the imbalance and rejected from OB.
Like, comment and subscribe to be in touch with my content!
