AUD/CAD Technical Analysis
The counter is currently trading around a strong resistance zone that triggered a sell-off previously.
According to the wave, it has now completed the ABC correction for the down move it made.
Further, the entire setup looks like a head and shoulder in the higher timeframes.
Hence, we expect the pair to move down from here.
Audcadshort

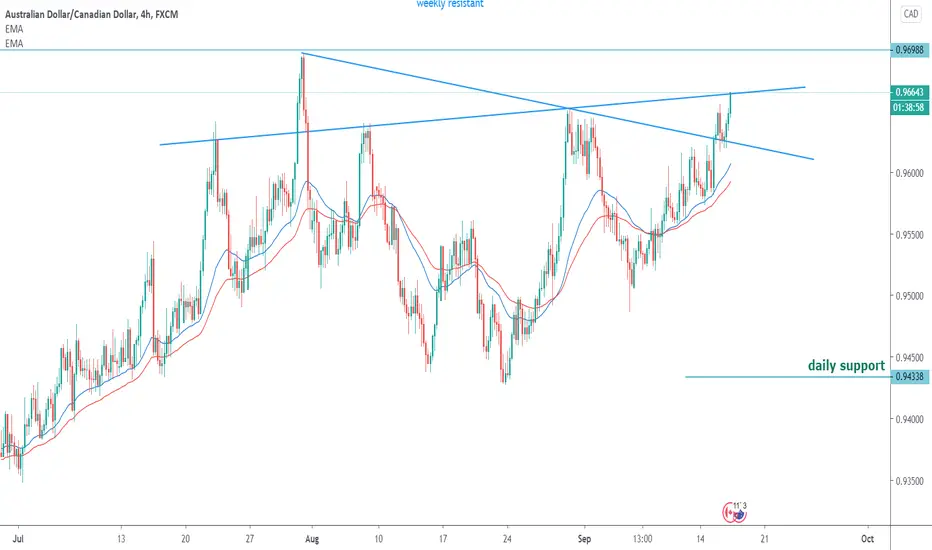
audcadthis might be a resistant for audcad let's hope if it rejects the trend line or keep moving up.


AUDCAD DOWNAUDCAD
The price has respected the channel once more and I believe it will reach the dotted line to come back down again and reach the purple zone. Wait for the retest before taking your entry.
.
.
.
El precio respeto el canal una vez mas y creo que el precio llegara hasta la linea punteada roja para volver a bajar y llegar hasta la zona morada. Esperen hasta que el precio retestee la zona para tomar una entrada a la baja.

Short Position on AUDCAD 4HHello Traders!
-------------------------------------------------------------
🚀Sell Execution according to the market.


AUD/CAD 13.09.2020Open Position: Sell 0.96160 (valid until 17.09.20)
Take Profit: 0.95695
Stop Loss: 0.96602


AUDCAD - Let's GoLots of confidence behind this trade lets see if it manages to get that lift off power.

AUDCAD SHORTThis is a SELL up here - working Double Top. Tight stops, could make a run at 0.96 then try again!
It is a looong way down so it's worth a try - or even several!


AUDCAD ON A CHANNELAUDCAD
The price is going down on a channel and im hoping for tonight that the price respects the level as a ceiling and continues the way down near level 0.945.
.
.
.
El precio esta bajando por un canal y estoy esperando que el precio respete la zona donde esta en este momento como un techo y vuelva a bajar hasta tocar el nivel 0.945.

AUDCAD - Day trade signal by Keltner 7 Sep 2020* The signal are tested in 3,5 years. Winrate stability over 52% every year.
Risk: 1%.
* Tradingview's backtest time ~ 3.5 years/Premium account, differs between currency pairs (Cryto is the default backtest time is shorter because the market is open both Saturday and Sunday: about 2 years)
- Base on order: 2 ways to enter or combine both.
Method 1
+ Keltner channel: the price closed above or below Upper / Lower Keltner for signal 1. Wait for the price to adjust to the Basis line, then enter the order.
Method 2
+ Keltner channel: price closes above or below Upper 2 / Lower 2 Keltner gives signal 1. Wait for the price to adjust to Upper / Lower line, then enter the order.
Method 3: combine both, priority 1 if satisfied conditions
+ Pivot option: appear rising signal: Higher High / Higher Low. Decline signal: Lower Low / Lower High for signal 2.
- When the above conditions are met, the Indicator shows a Buy / Sell signal according to the trend.
-----------------------------------
- Stoploss: Calculated from the entry point + - actual fluctuation by the formula ATR (20) * risk ratio (risk).
- Profit: Calculated from the entry point of the command + - actual oscillation using ATR formula (20) * reward ratio (reward).
- Profit: Look the Summary below.
- Should be backtest 3 Years (long term), each Year (medium term) and Quarter or 6 months (short term). If each year the success rate is always more than 50%, can be used for actual trading

AUDCAD possible reversal at 0.618 price hit 0.618 fibs and holding above looks good here
need more volume and good bounce from this zone for trade

AUD/CAD in Bearish Formation.AUD/CAD is in a Flag formation, coming out from a leg down, which is expected to result into another leg down.
I am in since 0.95642 and I am taking profit sligthly above 300 level.
For the current setup to remain with a good risk reward ratio, I reccomend taking profit slightly above 0.95220.
Good luck with this trade, looks all good to me!
Tibor
