AUDCHF Will Go Up From Support! Buy!
Take a look at our analysis for AUDCHF.
Time Frame: 1h
Current Trend: Bullish
Sentiment: Oversold (based on 7-period RSI)
Forecast: Bullish
The market is approaching a key horizontal level 0.533.
Considering the today's price action, probabilities will be high to see a movement to 0.534.
P.S
Please, note that an oversold/overbought condition can last for a long time, and therefore being oversold/overbought doesn't mean a price rally will come soon, or at all.
Like and subscribe and comment my ideas if you enjoy them!
AUDCHF

AUDCHF Facing Supply Pressure | Downside Targets in Focus🔻🌊 AUDCHF Facing Supply Pressure | Downside Targets in Focus 🎯
Overview:
AUDCHF is showing bearish pressure, with price approaching a well-defined supply area, favoring a controlled move to the downside.
Sell Zone (Focus Area):
🔴 0.5358 – 0.5360
This zone represents a strong supply area where selling interest is expected to emerge.
Downside Targets:
🎯 Target 1: 0.5310 – Initial downside reaction
🎯 Target 2: 0.5300 – Deeper downside target
Why This Setup Works:
✔ Price reacting near a clear resistance zone
✔ Bearish structure favors downside continuation
✔ Clean, low-noise movement expected
Trade Management Insight:
Partial profit booking near Target 1 helps protect capital while allowing continuation toward lower targets.
Execution Guidance:
Wait for price to show rejection or acceptance near the sell zone before entering. Avoid early or emotional entries.
Final Note:
As long as price reacts from the supply area, the probability favors a move toward the downside targets.
⸻
✨ Special Note for Serious Traders
If you prefer structured levels, clear targets, and disciplined execution over noisy signals, feel free to connect. I work with traders who value precision, patience, and consistency.

AUDCHF | Completing Another Impulsive WaveHello traders,
I see on the chart AUDCHF is completing another impulsive wave 5 targeting at least the top of wave 3. Here is my TP targets:
• TP1: 0.53600
• TP2: 0.54000
• TP3: 0.54444
Stop Loss: Close below 0.52100
Good Luck!

AUDCHF Will Move Lower! Sell!
Take a look at our analysis for AUDCHF.
Time Frame: 1h
Current Trend: Bearish
Sentiment: Overbought (based on 7-period RSI)
Forecast: Bearish
The market is on a crucial zone of supply 0.529.
The above-mentioned technicals clearly indicate the dominance of sellers on the market. I recommend shorting the instrument, aiming at 0.528 level.
P.S
We determine oversold/overbought condition with RSI indicator.
When it drops below 30 - the market is considered to be oversold.
When it bounces above 70 - the market is considered to be overbought.
Like and subscribe and comment my ideas if you enjoy them!

AUDCHF: Short Trade with Entry/SL/TP
AUDCHF
- Classic bearish setup
- Our team expects bearish continuation
SUGGESTED TRADE:
Swing Trade
Short AUDCHF
Entry Point - 0.5274
Stop Loss - 0.5279
Take Profit - 0.5264
Our Risk - 1%
Start protection of your profits from lower levels
Disclosure: I am part of Trade Nation's Influencer program and receive a monthly fee for using their TradingView charts in my analysis.
❤️ Please, support our work with like & comment! ❤️

AUD/CHF BEARS ARE GAINING STRENGTH|SHORT
Hello, Friends!
Previous week’s green candle means that for us the AUD/CHF pair is in the uptrend. And the current movement leg was also up but the resistance line will be hit soon and upper BB band proximity will signal an overbought condition so we will go for a counter-trend short trade with the target being at 0.524.
Disclosure: I am part of Trade Nation's Influencer program and receive a monthly fee for using their TradingView charts in my analysis.
✅LIKE AND COMMENT MY IDEAS✅

AUDCHF Will Go Lower From Resistance! Sell!
Please, check our technical outlook for AUDCHF.
Time Frame: 1h
Current Trend: Bearish
Sentiment: Overbought (based on 7-period RSI)
Forecast: Bearish
The market is approaching a key horizontal level 0.525.
Considering the today's price action, probabilities will be high to see a movement to 0.524.
P.S
Please, note that an oversold/overbought condition can last for a long time, and therefore being oversold/overbought doesn't mean a price rally will come soon, or at all.
Like and subscribe and comment my ideas if you enjoy them!

AUDCHF Will Collapse! SELL!
My dear followers,
I analysed this chart on AUDCHF and concluded the following:
The market is trading on 0.5263 pivot level.
Bias - Bearish
Technical Indicators: Both Super Trend & Pivot HL indicate a highly probable Bearish continuation.
Target - 0.5255
Safe Stop Loss - 0.5268
About Used Indicators:
A super-trend indicator is plotted on either above or below the closing price to signal a buy or sell. The indicator changes color, based on whether or not you should be buying. If the super-trend indicator moves below the closing price, the indicator turns green, and it signals an entry point or points to buy.
Disclosure: I am part of Trade Nation's Influencer program and receive a monthly fee for using their TradingView charts in my analysis.
———————————
WISH YOU ALL LUCK

AUD/CHF SENDS CLEAR BEARISH SIGNALS|SHORT
AUD/CHF SIGNAL
Trade Direction: short
Entry Level: 0.5279
Target Level: 0.5271
Stop Loss: 0.5284
RISK PROFILE
Risk level: medium
Suggested risk: 1%
Timeframe: 1h
Disclosure: I am part of Trade Nation's Influencer program and receive a monthly fee for using their TradingView charts in my analysis.
✅LIKE AND COMMENT MY IDEAS✅

buy audchfprice has been bouncing off the boundaries of this falling wedge pattern which is common as it is one of the emotional setups. buy audchf with tight stop loss. low probability as i dont trade with chart patterns anymore but i wanna see how it plays out

AUD/CHF SENDS CLEAR BEARISH SIGNALS|SHORT
Hello, Friends!
Previous week’s green candle means that for us the AUD/CHF pair is in the uptrend. And the current movement leg was also up but the resistance line will be hit soon and upper BB band proximity will signal an overbought condition so we will go for a counter-trend short trade with the target being at 0.528.
Disclosure: I am part of Trade Nation's Influencer program and receive a monthly fee for using their TradingView charts in my analysis.
✅LIKE AND COMMENT MY IDEAS✅

AUDCHF Sellers In Panic! BUY!
My dear subscribers,
This is my opinion on the EURAUD next move:
The instrument tests an important psychological level 0.5292
Bias - Bullish
Technical Indicators: Supper Trend gives a precise Bullish signal, while Pivot Point HL predicts price changes and potential reversals in the market.
Target - 0.5317
About Used Indicators:
On the subsequent day, trading above the pivot point is thought to indicate ongoing bullish sentiment, while trading below the pivot point indicates bearish sentiment.
Disclosure: I am part of Trade Nation's Influencer program and receive a monthly fee for using their TradingView charts in my analysis.
———————————
WISH YOU ALL LUCK

AUD/CHF LONG FROM SUPPORT
Hello, Friends!
AUD/CHF pair is in the uptrend because previous week’s candle is green, while the price is evidently falling on the 4H timeframe. And after the retest of the support line below I believe we will see a move up towards the target above at 0.536 because the pair is oversold due to its proximity to the lower BB band and a bullish correction is likely.
Disclosure: I am part of Trade Nation's Influencer program and receive a monthly fee for using their TradingView charts in my analysis.
✅LIKE AND COMMENT MY IDEAS✅

AUDCHF Trading Opportunity! BUY!
My dear followers,
I analysed this chart on AUDCHF and concluded the following:
The market is trading on 0.5331 pivot level.
Bias - Bullish
Technical Indicators: Both Super Trend & Pivot HL indicate a highly probable Bullish continuation.
Target - 0.5345
Safe Stop Loss - 0.5323
About Used Indicators:
A super-trend indicator is plotted on either above or below the closing price to signal a buy or sell. The indicator changes color, based on whether or not you should be buying. If the super-trend indicator moves below the closing price, the indicator turns green, and it signals an entry point or points to buy.
Disclosure: I am part of Trade Nation's Influencer program and receive a monthly fee for using their TradingView charts in my analysis.
———————————
WISH YOU ALL LUCK

AUDUSD: resistance rejection🛠 Technical Analysis: On the 4-hour timeframe, AUDUSD has flashed a "Global bullish signal" via a Golden Cross (SMA 50 crossing above SMA 100, SMA 200). The price is currently consolidating above the breakout zone, with a short-term rally projected towards the strong resistance level at 0.6700. The trade setup anticipates a "sell-the-news" reaction or technical rejection at this ceiling, targeting a bearish rotation back towards the support cluster around 0.6615.
———————————————
❗️ Trade Parameters (SELL)
———————————————
➡️ Entry Point: Sell Limit at Resistance (approx. 0.6700 – 0.6710)
🎯 Take Profit: 0.6615 (Support)
🔴 Stop Loss: Above the resistance structure (approx. 0.6735)
⚠️ Disclaimer: This is a potential trade idea based on current analysis; market conditions and price direction are subject to change based on news factors and volatility.

Falling towards pullback support?AUD/CHF is falling towards the support level, which is a pullback support that aligns with the 38.2% Fibonacci retracement and could bounce from this level to our take profit.
Entry: 0.52861
Why we like it:
There is pullback support at the 38.2% Fibonacci retracement.
Stop loss: 0.52492
Why we like it:
There is an overlap support level that aligns with the 50% Fibonacci retracement.
Take profit: 0.5356
Why we like it:
There is a pullback resistance level.
Enjoying your TradingView experience? Review us!
Please be advised that the information presented on TradingView is provided to Vantage (‘Vantage Global Limited’, ‘we’) by a third-party provider (‘Everest Fortune Group’). Please be reminded that you are solely responsible for the trading decisions on your account. There is a very high degree of risk involved in trading. Any information and/or content is intended entirely for research, educational and informational purposes only and does not constitute investment or consultation advice or investment strategy. The information is not tailored to the investment needs of any specific person and therefore does not involve a consideration of any of the investment objectives, financial situation or needs of any viewer that may receive it. Kindly also note that past performance is not a reliable indicator of future results. Actual results may differ materially from those anticipated in forward-looking or past performance statements. We assume no liability as to the accuracy or completeness of any of the information and/or content provided herein and the Company cannot be held responsible for any omission, mistake nor for any loss or damage including without limitation to any loss of profit which may arise from reliance on any information supplied by Everest Fortune Group.

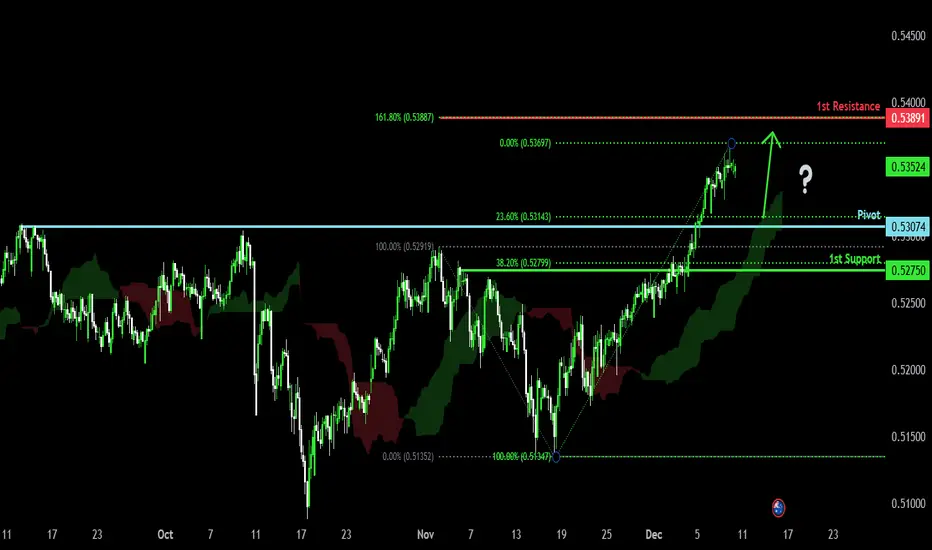
Bullish continuation?AUD/CHF could fall to the pivot which his a pullback support and could bounce to the 1st resistance.
Pivot: 0.53074
1st Support: 0.52750
1st Resistance: 0.53891
Disclaimer:
The opinions given above constitute general market commentary and do not constitute the opinion or advice of IC Markets or any form of personal or investment advice.
Any opinions, news, research, analyses, prices, other information, or links to third-party sites contained on this website are provided on an "as-is" basis, are intended to be informative only, and are not advice, a recommendation, research, a record of our trading prices, an offer of, or solicitation for, a transaction in any financial instrument and thus should not be treated as such. The information provided does not involve any specific investment objectives, financial situation, or needs of any specific person who may receive it. Please be aware that past performance is not a reliable indicator of future performance and/or results. Past performance or forward-looking scenarios based upon the reasonable beliefs of the third-party provider are not a guarantee of future performance. Actual results may differ materially from those anticipated in forward-looking or past performance statements. IC Markets makes no representation or warranty and assumes no liability as to the accuracy or completeness of the information provided, nor any loss arising from any investment based on a recommendation, forecast, or any information supplied by any third party
AUD-CHF Free Signal! Sell!
Hello,Traders!
AUDCHF has tapped directly into a horizontal supply area after sweeping buy-side liquidity above previous highs, forming an SMC distribution setup that favors a corrective move toward the next discount level below.
--------------------
Stop Loss: 0.5374
Take Profit: 0.5331
Entry: 0.5352
Time Frame: 12H
--------------------
Sell!
Comment and subscribe to help us grow!
Check out other forecasts below too!
Disclosure: I am part of Trade Nation's Influencer program and receive a monthly fee for using their TradingView charts in my analysis.

USDCHF: bullish breakout🛠 Technical Analysis: On the 4-hour timeframe, USDCHF triggered a "Global bullish signal" with the completion of a SMA lines (100 and 200), confirming a shift in momentum. The price has successfully broken out of a local descending correction channel and is currently stabilizing above the significant SMA cluster support. The technical setup projects a continuation of the rally towards the immediate resistance at 0.81115, with a potential growth to the 0.8200 handle.
———————————————
❗️ Trade Parameters (BUY)
———————————————
➡️ Entry Point: Approx. 0.8050
🎯 Take Profit: 0.81115 (Resistance), medium-term target at 0.8200
🔴 Stop Loss: Below the recent consolidation structure and SMA cluster (approx. 0.80200)
⚠️ Disclaimer: This is a potential trade idea based on current analysis; market conditions and price direction are subject to change based on news factors and volatility.

Bullish momentum to extend?AUD/CHF is falling towards the support level, which is a pullback support that aligns with the 23.6% Fibonacci retracement and could bounce from this level to our take profit.
Entry: 0.53042
Why we like it:
There is a pullback support that aligns with the 23.6% Fibonacci retracement.
Stop loss: 0.5267
Why we lik eit:
There is a pullback support level that aligns with the 38.2% Fibonacci retracement.
Take profit: 0.5392
Why we like it:
There is a resistance level at the 161.8% Fibonacci extension.
Enjoying your TradingView experience? Review us!
Please be advised that the information presented on TradingView is provided to Vantage (‘Vantage Global Limited’, ‘we’) by a third-party provider (‘Everest Fortune Group’). Please be reminded that you are solely responsible for the trading decisions on your account. There is a very high degree of risk involved in trading. Any information and/or content is intended entirely for research, educational and informational purposes only and does not constitute investment or consultation advice or investment strategy. The information is not tailored to the investment needs of any specific person and therefore does not involve a consideration of any of the investment objectives, financial situation or needs of any viewer that may receive it. Kindly also note that past performance is not a reliable indicator of future results. Actual results may differ materially from those anticipated in forward-looking or past performance statements. We assume no liability as to the accuracy or completeness of any of the information and/or content provided herein and the Company cannot be held responsible for any omission, mistake nor for any loss or damage including without limitation to any loss of profit which may arise from reliance on any information supplied by Everest Fortune Group.

AUDCHF: Bullish More After Breakout 🇦🇺🇨🇭
AUDCHF broke and closed above a key daily horizontal resistance.
Retesting a broken structure, the price formed a bullish flag pattern.
A breakout of its resistance line is a strong confirmation.
It indicates a highly probable movement up to 0.5656 level.
❤️Please, support my work with like, thank you!❤️
I am part of Trade Nation's Influencer program and receive a monthly fee for using their TradingView charts in my analysis.

AUDCHFAUDCHF price is in a correction phase. If the price can hold above 0.50914, it is expected that the price will rebound. Consider buying in the red zone.
*Trading is risky.
🔥Trading futures, forex, CFDs and stocks carries a risk of loss.
Please consider carefully whether such trading is suitable for you.
>>GooD Luck 😊
❤️ Like and subscribe to never miss a new idea!

AUD-CHF Free Signal! Sell!
Hello,Traders!
AUDCHF swept downside liquidity and already retested the mitigation block inside the horizontal supply, showing strong SMC rejection structure that opens room for a continuation lower toward the next draw-on-liquidity.
--------------------
Stop Loss: 0.5293
Take Profit: 0.5251
Entry: 0.5272
Time Frame: 3H
--------------------
Sell!
Comment and subscribe to help us grow!
Check out other forecasts below too!
