Can Aussie Strength Outrun the Swiss Franc This Week?💼 AUSSIE DOLLAR VS SWISS FRANC - Forex Market Profit Playbook
📊 Market Overview
Trading Style: Swing/Day Trade
Bias: 🟢 BULLISH
Strategy: The Thief's Layered Entry Method
💪 Currency Strength Analysis
🇦🇺 Australian Dollar (AUD) - Commodity Powerhouse
Current Strength: 🟢 STRENGTHENING
Key Drivers:
Commodity Prices: AUD correlates strongly with gold, iron ore, and base metals
Risk Appetite: Benefits from global risk-on sentiment
Interest Rates: RBA (Reserve Bank of Australia) monetary policy stance
Chinese Economic Data: Australia's largest trading partner impact
Trade Balance: Export-driven economy sensitive to global demand
Bullish Factors:
Positive commodity price momentum
Improving risk sentiment in global markets
Relative yield advantage attracting capital flows
🇨🇭 Swiss Franc (CHF) - The Safe Haven
Current Strength: 🔴 WEAKENING (vs AUD in this setup)
Key Drivers:
Safe-Haven Demand: Strengthens during market uncertainty
SNB Policy: Swiss National Bank intervention history
European Exposure: Close ties to Eurozone economy
Negative Real Yields: Limited yield appeal compared to other currencies
Risk Sentiment: Weakens when investors seek higher returns
Bearish Factors (for CHF):
Risk-on environment reducing safe-haven demand
Stronger commodity currencies outperforming
Capital rotation away from defensive assets
📊 AUD vs CHF: The Strength Battle
🥊 Current Matchup: AUD gaining ground against CHF
Why This Setup Works:
Divergence in Sentiment: Risk-on favors AUD, pressures CHF
Commodity Rally: Supporting Aussie strength
Yield Differential: AUD offers better carry trade potential
Technical Confirmation: Moving averages align with fundamental strength
🔍 Technical Analysis
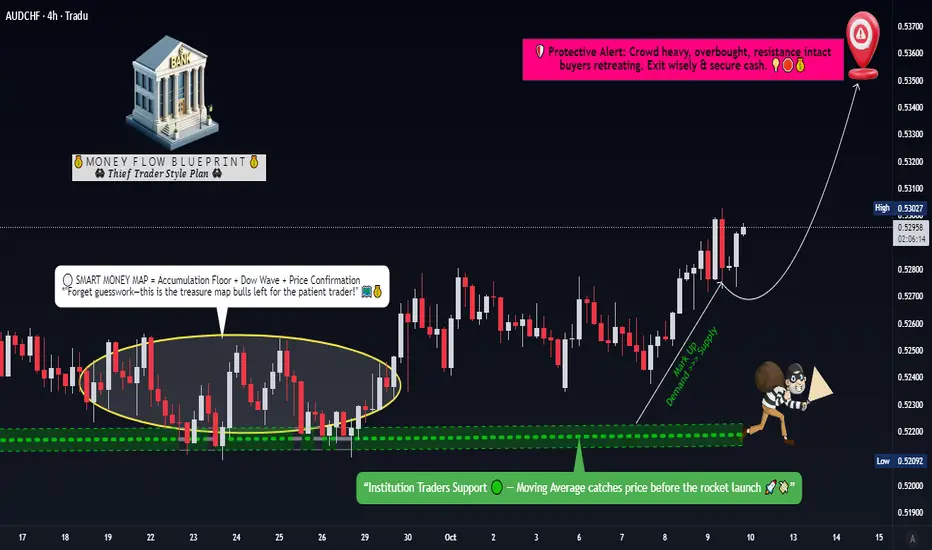
The AUD/CHF pair is showing bullish confirmation with moving averages pushing buyers to the upside. We're currently in an accumulation zone, presenting an excellent opportunity for strategic entries.
Key Observations:
Moving averages are aligned in favor of bulls
Price action indicates accumulation phase
Upside momentum building with buyer interest
Currency strength divergence supporting bullish bias
🎯 The Thief's Entry Strategy
Entry Method: Multiple Limit Orders (Layering Strategy)
This approach uses multiple buy limit orders to scale into the position strategically:
🔹 Suggested Entry Layers:
Layer 1: 0.52600
Layer 2: 0.52700
Layer 3: 0.52800
Layer 4: 0.52900
💡 You can add more layers or adjust based on your risk tolerance and account size. Alternatively, enter at any current price level if you prefer market execution.
🛡️ Risk Management
Stop Loss: 0.52400
⚠️ Important Note: Dear Traders (Thief OG's), this is my suggested stop loss level. However, you have full control — set your own risk parameters based on your trading plan and risk tolerance. Trade at your own discretion.
🎯 Profit Target
Take Profit: 0.53500
📍 Exit Strategy: There's a strong resistance zone + potential overbought conditions + liquidity trap area around this level. It's recommended to secure profits before reaching this zone or use trailing stops.
⚠️ Important Note: Dear Traders (Thief OG's), this is my suggested take profit target. However, you're the boss — take profits at your comfort level. Lock in gains when you feel it's right. Trade at your own risk.
🔗 Related Pairs to Watch
Keep an eye on these correlated pairs for confluence:
🇦🇺 AUD Pairs:
AUD/USD - Primary driver of Aussie strength
AUD/JPY - Risk sentiment indicator
AUD/NZD - Oceanic currency dynamics
🇨🇭 CHF Pairs:
EUR/CHF - Swiss franc strength gauge
USD/CHF - Dollar vs safe-haven dynamics
GBP/CHF - Alternative CHF exposure
💡 Correlation Context:
AUD is a commodity currency (tied to gold, iron ore, and risk appetite), while CHF is a traditional safe-haven currency. When risk-on sentiment dominates global markets, AUD typically strengthens against CHF. Monitor global equity markets, commodity prices, and risk sentiment for confluence.
⚖️ Disclaimer
⚠️ This is the "Thief Style" trading strategy — shared for educational and entertainment purposes only. This is NOT financial advice. Trading forex involves substantial risk of loss and is not suitable for all investors. Past performance is not indicative of future results. Always conduct your own analysis, manage your risk appropriately, and never trade with money you cannot afford to lose. You are solely responsible for your trading decisions.
✨ If you find value in my analysis, a 👍 and 🚀 boost is much appreciated — it helps me share more setups with the community!
#AUDCHF #ForexTrading #SwingTrading #DayTrading #TechnicalAnalysis #ForexSignals #AUD #CHF #CurrencyTrading #ForexStrategy #TradingIdeas #PriceAction #ForexCommunity #RiskManagement #TradingSetup #BullishSetup #ForexLife #ThiefStrategy #LayeredEntry #CurrencyStrength
Audchfsignals
Is AUD/CHF Poised for a Bullish Breakout? Join the Surge!🚀 AUSSIE vs SWISS: AUD/CHF Wealth Heist Strategy (Swing/Day Trade) 🦘
🎯 Market: AUD/CHF (Forex)
💡 Strategy: Bullish Swing/Day Trade with Re-Accumulation Confirmation.
Buckle up, traders! It's time to pull off a slick market heist with the "Thief Strategy" on AUD/CHF. We're layering up entries like a mastermind stacking cash, aiming for a high-voltage profit zone while dodging traps. Let’s break it down with style and precision! 😎
📈 Trade Setup: The Thief’s Playbook
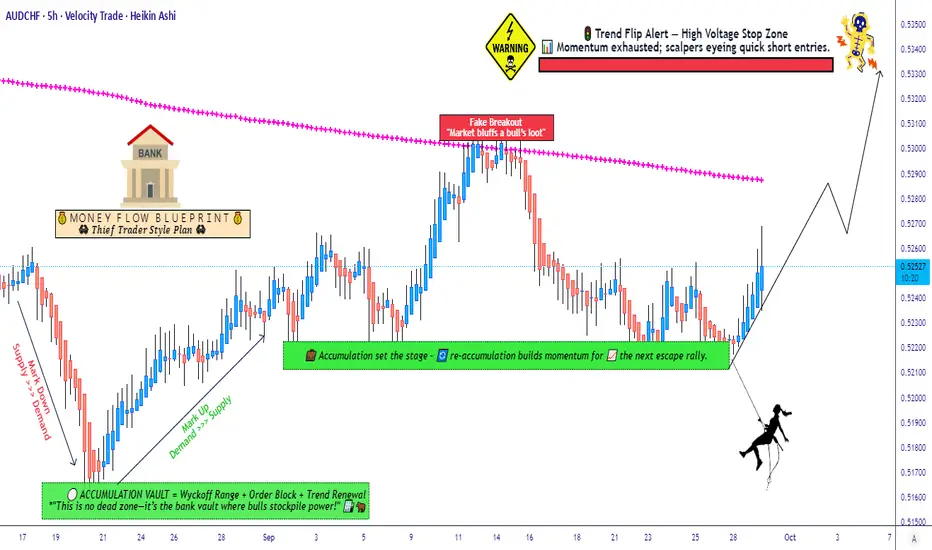
Bias: Bullish 🚀We’re spotting a re-accumulation pattern signaling the bulls are loading up for a breakout. AUD/CHF is primed for a move, and we’re ready to ride the wave!
Entry Strategy: Layered Buy Limit Orders (Thief Style) 🕵️♂️
Deploy multiple buy limit orders to stack the deck in your favor:
🎯 Buy Limit @ 0.52200
🎯 Buy Limit @ 0.52300
🎯 Buy Limit @ 0.52400
Pro Tip: Feel free to add more layers based on your risk appetite — scale up like a true market bandit!
Stop Loss: Thief’s Safety Net @ 0.52000 🛑
This is my suggested stop loss, but you’re the boss of your vault! Adjust based on your risk tolerance. Don’t let the market pickpocket your capital!
Take Profit: High-Voltage Resistance Zone @ 1.18700 ⚡A juicy resistance zone awaits, packed with overbought signals and a potential trap. Lock in profits here or adjust your exit to suit your style. Grab the loot and escape before the trap springs!
Note: This is a suggested target. You decide when to cash out — take profits at your own risk!
🔍 Why AUD/CHF? The Market Intel
Re-Accumulation Confirmation: The chart shows a textbook re-accumulation phase, with price consolidating before a bullish breakout. Volume and momentum are aligning for a push higher.
Market Dynamics: AUD (commodity-driven) vs. CHF (safe-haven) creates a tug-of-war. With risk-on sentiment rising, AUD could outmuscle CHF.
Trap Alert: Watch for a false breakout at the 1.18700 resistance zone. Overbought conditions may lure in early sellers — don’t get caught!
💵 Related Pairs to Watch
Keep an eye on these correlated pairs (priced in USD) to gauge market sentiment:
OANDA:AUDUSD : If the Aussie is pumping against the USD, it’s a good sign for AUD/CHF strength. Watch for bullish momentum here to confirm our bias.
OANDA:USDCHF : A weakening USD/CHF could amplify AUD/CHF’s upside as CHF loses ground. Check for bearish signals in USD/CHF to align with our trade.
OANDA:NZDCHF : Similar to AUD/CHF, NZD/CHF often moves in tandem due to AUD/NZD correlation. A bullish NZD/CHF could reinforce our setup.
Key Correlation Note: AUD and NZD often move together due to their commodity-driven economies. If AUD/USD and NZD/USD are rallying, it’s a green light for our AUD/CHF bullish bias. Conversely, a strong USD/CHF could cap our upside, so stay sharp!
🛠️ Thief Strategy Breakdown
Layering Entries: By stacking buy limit orders at 0.52200, 0.52300, and 0.52400, we’re averaging into the trade to catch the best entry zone. This minimizes risk if the market dips before blasting off.
Risk Management: The 0.52000 stop loss keeps our downside tight. Adjust your position size to keep risk below 1-2% of your account — don’t let the market rob you blind!
Profit Zone: The 1.18700 target is a high-probability resistance area. Use RSI or Stochastic indicators to confirm overbought conditions before exiting.
⚠️ Disclaimer
This is a Thief Style trading strategy crafted for fun and educational purposes. Trading involves risks, and you’re responsible for your own decisions. Always do your own research and manage your risk like a pro. No financial advice here — just a playful heist plan to spark your trading creativity!
✨ “If you find value in my analysis, a 👍 and 🚀 boost is much appreciated — it helps me share more setups with the community!”
#Hashtags: #AUDCHF #ForexTrading #SwingTrading #DayTrading #ThiefStrategy #Bullish #TechnicalAnalysis
AUD/CHF "Aussie vs Swiss" Forex Bank Heist Plan (Day Trade)🌟Hi! Hola! Ola! Bonjour! Hallo! Marhaba!🌟
Dear Money Makers & Robbers, 🤑 💰💸✈️
Based on 🔥Thief Trading style technical and fundamental analysis🔥, here is our master plan to heist the AUD/CHF "Aussie vs Swiss" Forex Bank. Please adhere to the strategy I've outlined in the chart, which emphasizes long entry. Our aim is to escape near the high-risk MA Zone. Risky level, overbought market, consolidation, trend reversal, trap at the level where traders and bearish robbers are stronger. 🏆💸"Take profit and treat yourself, traders. You deserve it!💪🏆🎉
Entry 📈 : "The vault is wide open! Swipe the Bullish loot at any price - the heist is on!
however I advise to Place buy limit orders within a 15 or 30 minute timeframe nearest or swing low or high level for pullback entries.
Stop Loss 🛑:
📍 Thief SL placed at the recent/swing low level Using the 1H timeframe (0.51500) Day/Swing trade basis.
📍 SL is based on your risk of the trade, lot size and how many multiple orders you have to take.
Target 🎯: 0.55000
🧲Scalpers, take note 👀 : only scalp on the Long side. If you have a lot of money, you can go straight away; if not, you can join Day traders and carry out the robbery plan. Use trailing SL to safeguard your money 💰.
💰💵💴💸AUD/CHF "Aussie vs Swiss" Forex Bank Heist Plan (Day / Swing Trade) is currently experiencing a bullishness🐂.., driven by several key factors.☝☝☝
📰🗞️Get & Read the Fundamental, Macro Economics, COT Report, Quantitative Analysis, Sentimental Outlook, Intermarket Analysis, Future trend targets and Overall outlook score... go ahead to check 👉👉👉🔗🔗
⚠️Trading Alert : News Releases and Position Management 📰 🗞️ 🚫🚏
As a reminder, news releases can have a significant impact on market prices and volatility. To minimize potential losses and protect your running positions,
we recommend the following:
Avoid taking new trades during news releases
Use trailing stop-loss orders to protect your running positions and lock in profits
💖Supporting our robbery plan 💥Hit the Boost Button💥 will enable us to effortlessly make and steal money 💰💵. Boost the strength of our robbery team. Every day in this market make money with ease by using the Thief Trading Style.🏆💪🤝❤️🎉🚀
I'll see you soon with another heist plan, so stay tuned 🤑🐱👤🤗🤩

AUDCHF Having a strong rebound on the 1.5 year Support.Last time we looked at AUDCHF (October 01 2024, see chart below), we took a long-term short trade based on the multi-year Channel Down:
The 0.56000 Target got hit and yet again the 1.5 year Support Zone (since August 2023) held. Sooner or later, this demand zone should break the pattern upwards and reverse the bearish trend.
Until then, we can continue buying on the Support Zone and target the Lower Highs. This time that trend-line happens to be where the 1W MA50 (blue trend-line) is headed at, so our Target is now 0.58000.
Apart from the Support Zone, we will only buy if the price breaks above Resistance 1, which will be past a Channel Down bullish break-out also, and target the 1W MA200 (orange trend-line) and Resistance 2 at 0.61000.
-------------------------------------------------------------------------------
** Please LIKE 👍, FOLLOW ✅, SHARE 🙌 and COMMENT ✍ if you enjoy this idea! Also share your ideas and charts in the comments section below! This is best way to keep it relevant, support us, keep the content here free and allow the idea to reach as many people as possible. **
-------------------------------------------------------------------------------
💸💸💸💸💸💸
👇 👇 👇 👇 👇 👇

AUD/CHF "The Aussie vs Swissy" Forex Market Bullish Heist Plan🌟Hi! Hola! Ola! Bonjour! Hallo!🌟
Dear Money Makers & Robbers, 🤑 💰
Based on 🔥Thief Trading style technical analysis🔥, here is our master plan to heist the AUD/CHF "The Aussie vs Swiss" Forex market. Please adhere to the strategy I've outlined in the chart, which emphasizes long entry. Our aim is the high-risk Red Zone. Risky level, overbought market, consolidation, trend reversal, trap at the level where traders and bearish robbers are stronger. 👀 So Be Careful, wealthy and safe trade.💪🏆🎉
Entry 📈 : You can enter a trade anywhere,
however I advise placing Buy limit orders within a 15 or 30 minute timeframe. Entry from the most recent or closest low level should be in retest.
Stop Loss 🛑: Using the 2H period, the recent / nearest low level.
Goal 🎯: 0.57340
Scalpers, take note : only scalp on the Short side. If you have a lot of money, you can go straight away; if not, you can join swing traders and carry out the robbery plan. Use trailing SL to safeguard your money 💰.
Warning⚠️ : Our heist strategy is incompatible with Fundamental Analysis news 📰 🗞️. We'll wreck our plan by smashing the Stop Loss 🚫🚏. Avoid entering the market right after the news release.
Take advantage of the target and get away 🎯 Swing Traders Please reserve the half amount of money and watch for the next dynamic level or order block breakout. Once it is resolved, we can go on to the next new target in our heist plan.
💖Supporting our robbery plan will enable us to effortlessly make and steal money 💰💵 Tell your friends, Colleagues and family to follow, like, and share. Boost the strength of our robbery team. Every day in this market make money with ease by using the Thief Trading Style.🏆💪🤝❤️🎉🚀
I'll see you soon with another heist plan, so stay tuned 🫂

AUDCHF Trade this rejection or break-outThe AUDCHF pair is now on its 1W MA50 (blue trend-line) having rebounding on the 1-year Support Zone. Even though the multi-year pattern is a Channel Down, we are low enough historically, having reached levels not seen since March 16 2020, that we may have to start considering a long-term reversal.
As such, our trading plan is focused on a potential rejection or bullish break-out. Short near the top of the Channel Down for a potential Lower Highs trend-line rejection and target 0.56000 (Support Zone). If however the price breaks above the Lower Highs trend-line, take the loss on the short and buy, targeting the 1W MA200 (orange trend-line) at 0.63000.
-------------------------------------------------------------------------------
** Please LIKE 👍, FOLLOW ✅, SHARE 🙌 and COMMENT ✍ if you enjoy this idea! Also share your ideas and charts in the comments section below! This is best way to keep it relevant, support us, keep the content here free and allow the idea to reach as many people as possible. **
-------------------------------------------------------------------------------
💸💸💸💸💸💸
👇 👇 👇 👇 👇 👇

AUDCHF BUY TF H4 TP = 0.5913On the H4 chart the trend started on Aug. 06 (linear regression channel).
There is a high probability of profit taking. Possible take profit level is 0.5913
Using a trailing stop is also a good idea!
Please leave your feedback, your opinion. I am very interested in it. Thank you!
Good luck!
Regards, WeBelievelnTrading

AUDCHF Channel Up intact. This pull-back is a buy opportunity.The AUDCHF pair is on the 3rd straight day of a strong short-term pull-back and just touched the 1D MA50 (blue trend-line) for the first time in almost 3 weeks. The long-term bullish trend remains intact though as the dominant structure is a 7-month Channel Up.
As long as the 1D MA200 (orange trend-line) holds, we will remain bullish, targeting 0.62250 (+6.20% Bullish Leg, similar to the previous two).
-------------------------------------------------------------------------------
** Please LIKE 👍, FOLLOW ✅, SHARE 🙌 and COMMENT ✍ if you enjoy this idea! Also share your ideas and charts in the comments section below! This is best way to keep it relevant, support us, keep the content here free and allow the idea to reach as many people as possible. **
-------------------------------------------------------------------------------
💸💸💸💸💸💸
👇 👇 👇 👇 👇 👇

AUDCHF Bottom of Channel Up. Buy opportunity.The AUDCHF pair gave us a solid sell signal last time (April 05, see chart below) but then broke above and established a Channel Up:
The price is now at the bottom (Higher Lows trend-line) of that Channel Up, below the 1D MA50 (blue trend-line), calling for a short-term buy amidst the start of the next Bullish Leg. On top of that, the RSI is approaching its 1-year Support Zone, which every time it was touched, the price rallied by at least +4.50%.
As a result, we remain bullish as long as the 1D MA200 (orange trend-line) is intact and attempt a first buy now, targeting 0.61750 (+4.50%).
-------------------------------------------------------------------------------
** Please LIKE 👍, FOLLOW ✅, SHARE 🙌 and COMMENT ✍ if you enjoy this idea! Also share your ideas and charts in the comments section below! This is best way to keep it relevant, support us, keep the content here free and allow the idea to reach as many people as possible. **
-------------------------------------------------------------------------------
💸💸💸💸💸💸
👇 👇 👇 👇 👇 👇

AUDCHF - Potential Bullish OpportunityThe AUD/CHF currency pair has recently exhibited notable price action, presenting an opportunity for technical analysis. Employing harmonic pattern recognition and key support levels, this report aims to outline potential bullish movements and associated trade parameters.
Harmonic Pattern Formation:
A Harmonic Pattern (XABCD) has emerged within the AUD/CHF pair, signaling a potential reversal from the prevailing bearish sentiment. This pattern, identified at a crucial support area, suggests an imminent bullish trajectory.
Key Support Area:
The formation of the Harmonic Pattern coincides with a significant support level, adding credence to the potential bullish outlook. This confluence strengthens the likelihood of a reversal and subsequent upward movement in price.
Technical Entry Strategy:
Entry: Consider initiating a long position near 0.58778, strategically positioned to capitalize on the anticipated bullish momentum.
Stop Loss: Implement a stop loss order at approximately 0.58274 to mitigate potential downside risk and preserve capital in the event of adverse price movements.
Profit Targets:
Target 1 (TP-1): Set the initial profit target at 0.59293, aligning with the expected bullish move following confirmation of the pattern.
Target 2 (TP-2): Establish a secondary profit target at 0.59794, aiming to capitalize further on the anticipated upward price trajectory.
Trade Management:
As with any trade, it is essential to remain vigilant and adapt to evolving market conditions. Monitor price action closely, particularly the breakout of the bearish 4-hour trendline, as confirmation of this breakout will validate the bullish bias and support trade execution.
Conclusion:
In summary, the AUD/CHF currency pair presents a compelling opportunity for bullish movement, supported by the formation of a Harmonic Pattern at a key support area. By adhering to the specified entry, stop loss, and profit target levels, traders can effectively capitalize on the anticipated upward price momentum while managing risk appropriately.
*Note: Trading involves inherent risks, and it is recommended to conduct thorough analysis and exercise prudent risk management strategies.*

AUDCHF 1D Golden Cross signaling a decline. Best sell in market.The AUDCHF pair has just formed a Golden Cross on the 1D time-frame but even though it is theoretically a bullish structure, it hasn't historically behaved as such for this pair. We view its effect on the 1W time-frame in order to go as back in time as possible and get conclusions.
In the past 10 years (since the May 2014 1D Golden Cross, which was bullish) there have been 5 such formations, all of which made the pair peak either before or on the Cross and delivered a Lower Low, in some instances even with brutal sell-offs.
In the last 2 occurrences, the 1D Golden Cross started Channel Down declines that both hit at least the 1D MA200 (orange trend-line) again before any trend change. As a result, we comfortably turn bearish now on AUDCHF, targeting the 1D MA200 by August.
-------------------------------------------------------------------------------
** Please LIKE 👍, FOLLOW ✅, SHARE 🙌 and COMMENT ✍ if you enjoy this idea! Also share your ideas and charts in the comments section below! This is best way to keep it relevant, support us, keep the content here free and allow the idea to reach as many people as possible. **
-------------------------------------------------------------------------------
💸💸💸💸💸💸
👇 👇 👇 👇 👇 👇

AUDCHF Risky Long!AUD-CHF is already making
A bullish rebound from
The horizontal support
Of 0.562654 and I think that
The pair will go even higher !

AUDCHF Triangle waiting for the break-out.The AUDCHF pair is trading within a Triangle pattern since August with the 1D MA200 (orange trend-line) acting as the Resistance, having consecutive near rejections in December. If that breaks, we expect an aggressive bullish run towards Resistance 2, despite the presence of Resistance (0.952625). In that case, we will buy the break-out and target 0.61500 (just below Resistance 2).
If however the Triangle breaks downwards first, we will wait until the price breaks below Support 1 (0.560685) and target 0.54000 (-9.09% from the recent high, which was a standard decline in 2023). This scenario is quite likely to take place as the 1D RSI has been trading within a Channel Down, showcasing a Bearish Divergence.
-------------------------------------------------------------------------------
** Please LIKE 👍, FOLLOW ✅, SHARE 🙌 and COMMENT ✍ if you enjoy this idea! Also share your ideas and charts in the comments section below! This is best way to keep it relevant, support us, keep the content here free and allow the idea to reach as many people as possible. **
-------------------------------------------------------------------------------
💸💸💸💸💸💸
👇 👇 👇 👇 👇 👇

AUDCHF On the verge of a strong move.The AUDCHF pair has been trading within a Channel Down since February's High and currently sits just below its top (Lower Highs trend-line). Having formed a 1D MA50/ 100 Bullish Cross and tests the Lower Highs for the 3rd time in 2 months, it is highly likely to finally break the bearish trend upwards. We will only buy though above the 1D MA200 (orange trend-line) and aim towards Resistance 1 at 0.61500. Until this break-out, we will follow the long-term bearish Channel Down and short aiming at 0.53500 (-9.09% similar to the two previous bearish sequences).
-------------------------------------------------------------------------------
** Please LIKE 👍, FOLLOW ✅, SHARE 🙌 and COMMENT ✍ if you enjoy this idea! Also share your ideas and charts in the comments section below! This is best way to keep it relevant, support us, keep the content here free and allow the idea to reach as many people as possible. **
-------------------------------------------------------------------------------
💸💸💸💸💸💸
👇 👇 👇 👇 👇 👇

AUDCHF ____ INCOMING BEARISH MOVEHello Guy,
It's another trading week and I want to share my view on AUDCHF with you. Legggoooo!!!
If you take a look at the monthly timeframe, you will notice that price just reacted from a monthly orderblock.
If you drop down to the weekly timeframe, you will notice that price had created a bearish CHOCH and has retraced to the weekly supply OB from which we can expect a bearish continuation. You may also notice that we are currently at the neckline of the M pattern on the weekly chart.
On the daily chart, you will notice how price just took out a strong supply zone which caused a strong drop in price. You can also notice the W pattern and we should expect a retracement.
Now, I am monitoring price movement in the 1-hour timeframe to see if I can get my trade setup to go short.
Endeavor to keep this pair on your radar.
Follow for more updates like this.
Cheers.
Jabari

AUDCHF: 18/10/2023:🔴Sell opportunity
Well, you can see important supply zone ond bearish order block on the chart.
In these zones we can search for a low time frame confirmation.
Please pay attention to the details.
💡Wait for the update!
🗓18/10/2023
🔎 DYOR
💌It is my honor to share your comments with me💌

AUDCHF Hit our bullish target. Now time to sell the Channel DownThe AUDCHF pair has hit the 0.58200 target (0.382 Fibonacci level) we set on our last buy call (see idea below) and is resting today at the top (Lower Highs trend-line) of the Channel Down pattern since the January 27 2023 High:
The price price is now on the 1D MA100 (green trend-line) and just below the 0.5 Fibonacci level. There is also a chance that the dotted Channel Down will be materialized, so the technical Lower High max extension is a little higher. The sell confirmation typically comes when the 1D MACD makes a Bearish Cross. Our target is a potential -9.10% extension at 0.54000.
-------------------------------------------------------------------------------
** Please LIKE 👍, FOLLOW ✅, SHARE 🙌 and COMMENT ✍ if you enjoy this idea! Also share your ideas and charts in the comments section below! **
-------------------------------------------------------------------------------
💸💸💸💸💸💸
👇 👇 👇 👇 👇 👇

AUDCHF Buy signal within the Channel Down.The AUDCHF pair has been trading within a Channel Down pattern since the January 27 2023 High. The price is currently on a 2-week rise and following the completion of a 1D MACD Bullish Cross, it can extend to at least the 0.382 Fibonacci level based on the previous two Lower Lows of the Channel Down. As a result, we are targeting 0.58200, which would also make a technical contact with the 1D MA100 (green trend-line).
-------------------------------------------------------------------------------
** Please LIKE 👍, FOLLOW ✅, SHARE 🙌 and COMMENT ✍ if you enjoy this idea! Also share your ideas and charts in the comments section below! **
-------------------------------------------------------------------------------
💸💸💸💸💸💸
👇 👇 👇 👇 👇 👇


AUDCHF Short-term Buy SignalThe AUDCHF pair reached the bottom (Lower Lows trend-line) of the 2-year Channel Down pattern and rebounded, testing now the 1D MA50 (blue trend-line). Then that 1D MA50 test took place after the RSI on the 1W time-frame rebounded on its Support Zone, all three times the price hit the 1D MA200 (orange trend-line). This can happen a little quicker at 0.62000 or slower at 0.61500. Choose the appropriate target depending on the course of the price action.
-------------------------------------------------------------------------------
** Please LIKE 👍, FOLLOW ✅, SHARE 🙌 and COMMENT ✍ if you enjoy this idea! Also share your ideas and charts in the comments section below! **
-------------------------------------------------------------------------------
💸💸💸💸💸💸
👇 👇 👇 👇 👇 👇

AUDCHF Consider this buy break-out signalThe AUDCHF pair hit yesterday its 1D MA200 (orange trend-line) for the first time since September 05 2022. The key on the current price action is the weekly (1W) closing. In September it failed to close a 1W candle above the 1D MA200 and naturally it got rejected to the bottom the long-term Channel Down that it has been trading in since mid 2021.
The current sequence is quite similar to the July 2021 - March 2022 fractal. The pair failed to close a week above the 1D MA200 during October 2021 and dropped back to the bottom of the Channel Down. In early March 2022 though, on the new 1D MA200 test, it succeeded at closing a week above it and the price soared eventually to the top (Lower Highs trend-line) of the Channel Down, just above the 1.236 Fibonacci extension level, completing a +10.60% rise.
So naturally if we get that weekly closing above the 1D MA200 now, probabilities are with us to buy and target 0.6800, whihc is slightly below a +10.60 extension and the 1.236 Fib. As long as the price closes below it though, it remains a sell opportunity, towards at least the 1D MA50 (blue trend-line) on the short-term.
-------------------------------------------------------------------------------
** Please LIKE 👍, FOLLOW ✅, SHARE 🙌 and COMMENT ✍ if you enjoy this idea! Also share your ideas and charts in the comments section below! **
-------------------------------------------------------------------------------
💸💸💸💸💸💸
👇 👇 👇 👇 👇 👇

AUDCHF - Break or channelThe pair has been trading in ascending channel, but currently from the 1HTF Perspective price is forming Lower highs and lower lows which is an indication of change in the preceding trend. Expecting the break of channel ,then a Retest or a possible continuation pattern for the move to the downside.

AUDCHF Inverse Head and Shoulders targeting the 1D MA200The AUDCHF pair has been trading within a Channel Down pattern since February 25 2021 High. At the moment, it is below the 1D MA50 (blue trend-line) but appears to have completed an Inverse Head and Shoulders (IH&S) pattern that is a technical formation typically found on market bottoms.
In fact, with the RSI on the 1W double bottoming and rebounding, the current pattern resembles the IH&S of the August 20 201 bottom. As you see, that pattern also trading the Right Shoulder around the 1D MA50 and then rebounded and hit the 1D MA200 (orange trend-line). We expect the 1D MA200 to get hit once more before a pull-back and is currently our medium-term target.
-------------------------------------------------------------------------------
** Please LIKE 👍, SUBSCRIBE ✅, SHARE 🙌 and COMMENT ✍ if you enjoy this idea! Also share your ideas and charts in the comments section below! This is best way to keep it relevant, support me, keep the content here free and allow the idea to reach as many people as possible. **
-------------------------------------------------------------------------------
You may also TELL ME 🙋♀️🙋♂️ in the comments section which symbol you want me to analyze next and on which time-frame. The one with the most posts will be published tomorrow! 👏🎁
-------------------------------------------------------------------------------
👇 👇 👇 👇 👇 👇
💸💸💸💸💸💸
👇 👇 👇 👇 👇 👇
