AUDCHF On the verge of a break-outThe AUDCHF pair seems to be repeating the October 2021 - January 2022 fractal both on candle and RSI terms on the 1D time-frame (both recording a -7.50% decline). The price has been closing below the 1D MA50 (blue trend-line) since June 15. A break above the 1D MA200 (orange trend-line) would be a bullish break-out signal, targeting the Lower Highs trend-line and (under conditions that we will analyze when the time comes), the 1.236 Fibonacci extension.
On the other hand, a break below 0.6500 (just below the July 01 low), would be a bearish break-out signal towards the 2.0 Fib lower extension (0.63000).
--------------------------------------------------------------------------------------------------------
** Please support this idea with your likes and comments, it is the best way to keep it relevant and support me. **
--------------------------------------------------------------------------------------------------------
Audchfsignals

AUDCHF Emerging Death Cross can push it back to 0.6513.The AUDCHF pair is seeing a short-term rebound following the July 01 Low and is approaching the 1D MA200 (orange trend-line) and 1D MA50 (blue trend-line). It has been trading below the latter since June 16 and the former since June 17.
The emerging Death Cross formation (when the MA50 crosses below the MA200) can put a stop to this short-term recovery and push the price to a new Low just like the last 1D Death Cross did a year ago, on July 28 2021. A 1D candle close above the 1D MA50 invalidates the Death Cross and targets the Lower Highs trend-line.
--------------------------------------------------------------------------------------------------------
** Please support this idea with your likes and comments, it is the best way to keep it relevant and support me. **
--------------------------------------------------------------------------------------------------------

AUDCHF Neutral for the summer, bullish break-out end-of-yearThe AUDCHF pair has been neutral since the start of April following our plan with great consistency, as outlined on our last analysis:
As you see, the price has been trading inside that box as the June - September 2020 fractal suggested. This time, we also have the 1W MA200 (red trend-line) that provides support. The 1D MACD shows that we are at a point where one last pull-back is possible before the pattern breaks to the upside. We keep scalping this formation until 0.7100 breaks, which will be a bullish break-out call aimed at 0.726500 and (under circumstances which we will update) the 1.236 Fibonacci extension at 0.746560.
--------------------------------------------------------------------------------------------------------
** Please support this idea with your likes and comments, it is the best way to keep it relevant and support me. **
--------------------------------------------------------------------------------------------------------

AUD/CHF is in bullish swing ...According to volume and technical analysis , AUD/CHF is in uptrend .
put your buy limit orders and relax .
Entery points are the 3 levels of Fibo ( 1 , 0.5 , 0 )
SL @ red Fibo level
TP @ green Fibo level
Good Luck guys ;) ...

DeGRAM | AUDCHF consolidationAUDCHF is consolidating on higher timeframes and it's approaching a major resistance zone.
We are considering selling at the 0.69150-0.69200 resistance zone.
-------------------
Share your opinion in the comments and support the idea with like. Thanks for your support!

AUDCHF Neutral medium-term, 0.7465 long-term.The AUDCHF pair is currently holding the 1D MA50 (blue trend-line) as Support and in a similar sequence as the June - September 2020 pattern, it may turn sideways on the medium-term and consolidate.
However, since the 0.618 Fibonacci retracement level has been broken, most likely it will maintain the bullish trend on the long-term. The next 1D MA200 (orange trend-line) contact, will most likely be the long-term buy signal. Our target is the 1.236 Fibonacci extension around 0.7465.
--------------------------------------------------------------------------------------------------------
** Please support this idea with your likes and comments, it is the best way to keep it relevant and support me. **
--------------------------------------------------------------------------------------------------------

AUDCHFAUDCHF M30 - an idea ✅
Buy!
E: 0,66120
Tp: 0,66720 ( 60 pips )
Sl: 0,65900 ( 22 pips )
RRR: 1 : 2,72

AUDCHF time to buyHi fellow traders, AUDCHF has reached the blue box and the flat correction is complete. Look for buys until one of the resistance levels, Goodluck!

AUDCHF: SIGNAL LONGTERM / SWING TRADE +200 PIPSDon't miss opportunity +200 PIPS
Risk Reward Ratio 1:3 max 1:4 with money management.
GOOD LUCK don't forget to leave a comment below and give thumbs up

AUDCHF Descending Triangle Breakout On the daily time frame, AUDCHF a Descending Triangle breakout and confirm by consolidating the price zone below the support level. We are going to open a short position.


AUDCHF: SIGNAL TRADING (buy after retest)AUDCHF have retest the price for descending wedge.
try this opportunity

AUDCHF signal (SHORT)Hello friends.
Please support my work by clicking the LIKE button(If you liked).Thank you!
Everything on the chart.
open pos: market
target: 0.6925
stop: ~0.698 (depending of ur risk). ALWAYS follow ur RM .
risk reward 1 to 7
Good luck everyone!
Follow me on TRADING View, if you don't want to miss my next analysis or signals.
It's not financial advice.
Dont Forget, always make your own research before to trade my ideas!
Open to your questions or suggestions(Looking for investors!).


AUDCHF: Neutral and ready to grow upthe price still on the range, possible to buy on the support before grow up

AUDCHF, will shoot the Stars, longAUDCHF, will shoot the Stars because it will respect the key level of Support! Watch out Friends!

AUDCHF ON WEEKLY RESISTANCE AREAHi Traders,
I would like to open Short Position in AUDCHF now, because this pair is on Weekly Support & Resistance Level, I am looking this pair to move downside because of Key Level, Fibo 78%, RSI Level and because of last week Engulfing Candle.

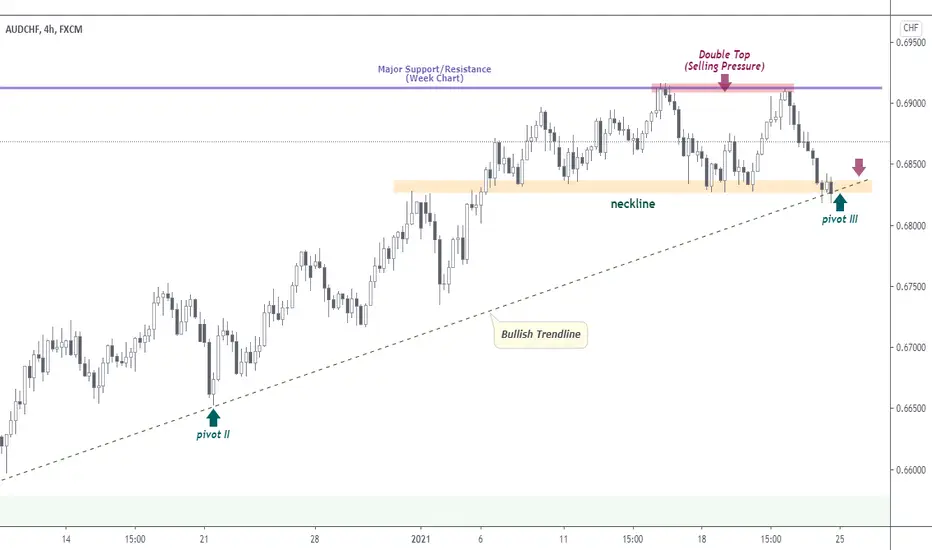
AUDCHF | Perspective for the new weekEven though we are generally in an uptrend, there are shreds of evidence that Buyers might have lost the steam that brought them this far as we await significant breakdown of neckline @ Fr0.68250 for confirmations that support Bearish bias.
Tendency: Downtrend ( Bearish )
Structure: Reversal Pattern (Double TOp) | Trendline
Observation: i. Uptrend: Line drawn under pivot lows explains the prevailing direction of price.
ii. Price is currently @ Fr0.68250 which has been a strong demand zone since the beginning of the year 2021.
iii. Evidence that supports my Bearish dimension is the double rejection of the major Support/Resistance level on Weekly chart @ Fr0.69130 which makes a Double Top - a strong Reversal pattern.
iv. As the Reversal pattern is on the verge of completion, it appears price is at a temporary end of a Bullish run and we have to be very careful as a Breakdown of neckline followed by retest/rejection might be the appropriate signal to sell in this instance.
v. We should not forget that the Neckline has been a strong Demand zone in the past and this could attract a handful presence of Buyers before the decline begins. It is worthy to note that if we observe any significant Bull run from the neckline, we might be looking in the direction of a rally... Hence, trade consciously!
Trading plan: SELL confirmation with a minimum potential profit of 250 pips.
Risk/Reward : 1:5
Potential Duration: 3 to 8 days
NB: This speculation can be considered to make decisions on lower timeframes.
Watch this space for updates as price action is been monitored.
Risk Disclaimer:
Margin trading in the foreign exchange market (including foreign exchange trading, CFDs, etc.) has a high risk and is not suitable for all investors. The content of this speculation (including all data) is organized and published by me for the sole purpose of education and assistance in making independent investment decisions. All information herein is for your reference only and I take no responsibility.
You are hereby advised to carefully consider your investment experience, financial situation, investment objective, risk tolerance level, and consult your independent financial adviser as to the suitability of your situation prior to making any investment.
I do not guarantee its accuracy and is not liable for any loss or damage which may result directly or indirectly from such content or the receipt of any instruction or notification therewith.
Past performance is not necessarily indicative of future results.


AUD shows weakness across boardAudchf is expected to fall lower in price,
To complete the bearish impulse wave,
Stop loss should be placed at the invalidation level shown

