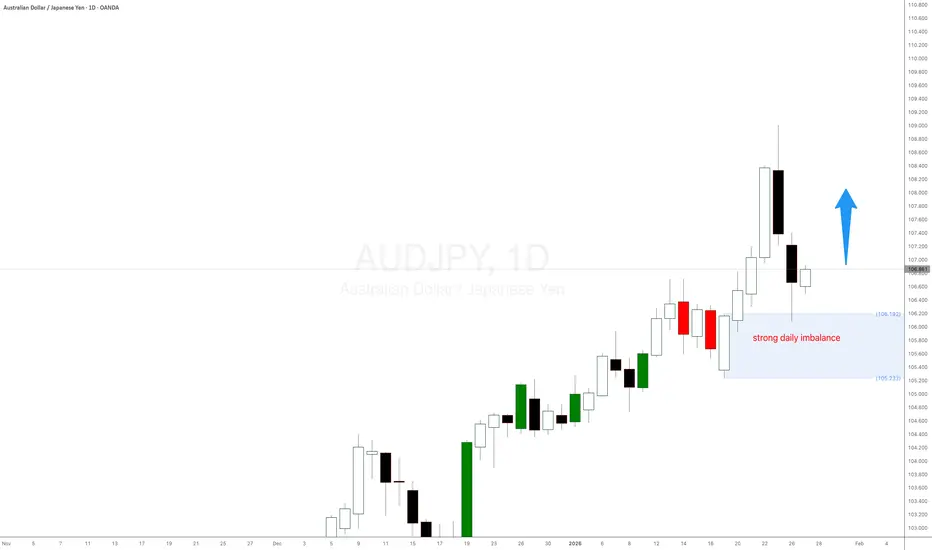
AUDJPY forex pair strong daily imbalanceAUDJPY forex pair strong daily imbalance took control and is trying to push the australiann dollar to higher grounds. The Japanese Yen is very weak accross the board. Let's see if this imbalance wants to play out.
AUDJPY
LONG ON AUD/JPYThe Jpy Index pushed up on Friday but is now starting to retrace/pullback/correct or fall.
We have a nice choc (change of character) from down to up on AJ on the 15min timeframe.
I expect price to drop first to 106.392 then rise.
This is a buy limit order. I will be looking to catch 100-200 pips.

AUDJPY Will Fall! Sell!
Take a look at our analysis for AUDJPY.
Time Frame: 4h
Current Trend: Bearish
Sentiment: Overbought (based on 7-period RSI)
Forecast: Bearish
The market is approaching a significant resistance area 108.263.
Due to the fact that we see a positive bearish reaction from the underlined area, I strongly believe that sellers will manage to push the price all the way down to 106.786 level.
P.S
We determine oversold/overbought condition with RSI indicator.
When it drops below 30 - the market is considered to be oversold.
When it bounces above 70 - the market is considered to be overbought.
Like and subscribe and comment my ideas if you enjoy them!

Potential bullish reversal?AUD/JPY is falling towards the support level, which is a pullback support, and could bounce from this level to our take profit.
Entry: 106.46
Why we like it:
There is a pullback support level
Stop loss: 106.12
Why we like it:
There is a pullback support level.
Take profit: 107.87
Why we like it:
There is a pullback resistance that aligns with the 61.8% Fibonacci retracement.
Enjoying your TradingView experience? Review us!
Please be advised that the information presented on TradingView is provided to Vantage (‘Vantage Global Limited’, ‘we’) by a third-party provider (‘Everest Fortune Group’). Please be reminded that you are solely responsible for the trading decisions on your account. There is a very high degree of risk involved in trading. Any information and/or content is intended entirely for research, educational and informational purposes only and does not constitute investment or consultation advice or investment strategy. The information is not tailored to the investment needs of any specific person and therefore does not involve a consideration of any of the investment objectives, financial situation or needs of any viewer that may receive it. Kindly also note that past performance is not a reliable indicator of future results. Actual results may differ materially from those anticipated in forward-looking or past performance statements. We assume no liability as to the accuracy or completeness of any of the information and/or content provided herein and the Company cannot be held responsible for any omission, mistake nor for any loss or damage including without limitation to any loss of profit which may arise from reliance on any information supplied by Everest Fortune Group.

AUDJPY | Weekly Bullish EngulfingAUDJPY remains structurally bullish and the higher timeframe context is still supportive of continuation.
The weekly chart printed a bullish engulfing candle, which is a strong confirmation signal when it appears within an established uptrend. This type of weekly engulfing often represents sell-side absorption and renewed demand, meaning pullbacks are still being bought and the market is not ready to reverse yet.
On the daily chart, price is moving inside a clean ascending channel, respecting higher lows and maintaining momentum.
After the latest impulsive leg, I’m not interested in chasing the highs. Instead, I’m looking for a controlled pullback into key demand areas to align with the trend and improve execution quality.
COT (Commitments of Traders)
COT positioning is not giving an aggressive “all-in” bullish signal on AUD, but JPY positioning remains fragile, which keeps the JPY-cross upside pressure valid. In this context, I treat COT as a supportive filter, not as the main trigger.
Seasonality
Seasonality supports the idea that upside continuation is possible, but it also suggests price may need a reset/pullback after a strong extension. That’s why I prefer a buy-the-dip approach rather than breakout chasing.
FX Sentiment (Retail Positioning)
Retail sentiment is extremely one-sided: around 89% of traders are short AUDJPY.
In trending conditions, this is often a contrarian tailwind and can help fuel continuation as shorts get squeezed.
Trading Plan
Bias: Bullish (LONG)
Execution idea: Wait for pullback into daily demand / channel support and look for confirmation (H4/D1 reaction).
Invalidation: Daily breakdown below the key demand zone + loss of channel structure.
Targets: Retest of highs first, then continuation into the next extension leg.

AUDJPY bullish breakout supported at 106.70The AUDJPY remains in a bullish trend, with recent price action showing signs of a breakout within the broader uptrend.
Support Zone: 106.70 – a key level from previous consolidation. Price is currently testing or approaching this level.
A bullish rebound from 106.70 would confirm ongoing upside momentum, with potential targets at:
108.50 – initial resistance
109.00 – psychological and structural level
109.50 – extended resistance on the longer-term chart
Bearish Scenario:
A confirmed break and daily close below 106.70 would weaken the bullish outlook and suggest deeper downside risk toward:
106.40 – minor support
106.00 – stronger support and potential demand zone
Outlook:
Bullish bias remains intact while the AUDJPY holds above 106.70. A sustained break below this level could shift momentum to the downside in the short term.
This communication is for informational purposes only and should not be viewed as any form of recommendation as to a particular course of action or as investment advice. It is not intended as an offer or solicitation for the purchase or sale of any financial instrument or as an official confirmation of any transaction. Opinions, estimates and assumptions expressed herein are made as of the date of this communication and are subject to change without notice. This communication has been prepared based upon information, including market prices, data and other information, believed to be reliable; however, Trade Nation does not warrant its completeness or accuracy. All market prices and market data contained in or attached to this communication are indicative and subject to change without notice.

Stop!Loss|Market View: AUDUSD🙌 Stop!Loss team welcomes you❗️
In this post, we're going to talk about the near-term outlook for the AUDUSD currency pair☝️
Potential trade setup:
🔔Entry level: 0.67910
💰TP: 0.67136
⛔️SL: 0.68449
"Market View" - a brief analysis of trading instruments, covering the most important aspects of the FOREX market.
👇 In the comments 👇 you can type the trading instrument you'd like to analyze, and we'll talk about it in our next posts.
💬 Description: As expected, pressure on the US dollar is easing by the end of the week, suggesting that the key buying priorities for the USD remain, especially in the medium term. For AUDUSD, in particular, a rebound from the upper boundary of the ascending channel is expected, with a target at the lower boundary. An additional target is seen near 0.66000.
Thanks for your support 🚀
Profits for all ✅

Bullish bounce off?AUD/JPY has bounced off the support level, which acts as an overlap support that aligns with the 38.25 Fibonacci retracement and could potentially rise from this level to our take profit.
Entry: 106.20
Why we like it:
There is an overlap support level that aligns with the 38.2% Fibonacci retracement.
Stop loss: 105.74
Why we like it:
There is a pullback support that is slightly below the 61.8% Fibonacci retracement.
Take profit: 107.24
Why we like it:
There is a resistance level at the 78.6% Fibonacci projection.
Enjoying your TradingView experience? Review us!
Please be advised that the information presented on TradingView is provided to Vantage (‘Vantage Global Limited’, ‘we’) by a third-party provider (‘Everest Fortune Group’). Please be reminded that you are solely responsible for the trading decisions on your account. There is a very high degree of risk involved in trading. Any information and/or content is intended entirely for research, educational and informational purposes only and does not constitute investment or consultation advice or investment strategy. The information is not tailored to the investment needs of any specific person and therefore does not involve a consideration of any of the investment objectives, financial situation or needs of any viewer that may receive it. Kindly also note that past performance is not a reliable indicator of future results. Actual results may differ materially from those anticipated in forward-looking or past performance statements. We assume no liability as to the accuracy or completeness of any of the information and/or content provided herein and the Company cannot be held responsible for any omission, mistake nor for any loss or damage including without limitation to any loss of profit which may arise from reliance on any information supplied by Everest Fortune Group.

AUDJPY Set To Fall! SELL!
My dear friends,
My technical analysis for AUDJPY is below:
The market is trading on 106.14 pivot level.
Bias - Bearish
Technical Indicators: Both Super Trend & Pivot HL indicate a highly probable Bearish continuation.
Target - 105.92
Recommended Stop Loss - 106.28
About Used Indicators:
A pivot point is a technical analysis indicator, or calculations, used to determine the overall trend of the market over different time frames.
Disclosure: I am part of Trade Nation's Influencer program and receive a monthly fee for using their TradingView charts in my analysis.
———————————
WISH YOU ALL LUCK

AUD/JPY BEARISH BIAS RIGHT NOW| SHORT
Hello, Friends!
We are now examining the AUD/JPY pair and we can see that the pair is going up locally while also being in a uptrend on the 1W TF. But there is also a powerful signal from the BB upper band being nearby, indicating that the pair is overbought so we can go short from the resistance line above and a target at 105.822 level.
Disclosure: I am part of Trade Nation's Influencer program and receive a monthly fee for using their TradingView charts in my analysis.
✅LIKE AND COMMENT MY IDEAS✅

AUD/JPY: Multi-Layer Execution Strategy | Technical & Macro View🔥 AUD/JPY Bullish Setup | Layered Buy Strategy | Smart Money Flow 📈
📌 Asset
AUD/JPY – Australian Dollar vs Japanese Yen
Forex Market Trade Opportunity Guide (Day / Swing Trade)
🧠 Market Bias
✅ Bullish Structure Confirmed
Price is holding above key demand with higher-timeframe support intact. Risk sentiment favors AUD strength while JPY remains weak under current macro conditions.
🎯 Trade Plan – Thief Layering Strategy 🧩
This setup uses a multiple limit-order layering method to optimize average entry price and reduce emotional execution.
🟢 Buy Limit Layers (Scale-In):
105.000
105.300
105.600
105.900
👉 (You may add or adjust layers based on your risk profile and capital allocation)
📌 Entry Logic:
Demand zone reaction
Mean reversion opportunity
Liquidity absorption near intraday lows
🏁 Take Profit (TP)
🎯 106.600
📍 Reasoning:
Prior resistance zone
Overbought conditions expected near highs
Possible liquidity trap above → book profits, don’t get greedy
⚠️ TP is flexible — partials are recommended based on price action.
🛑 Stop Loss (SL)
🔻 104.800
📌 SL Logic:
Invalidation of bullish structure
Below demand & liquidity pocket
⚠️ Risk management is personal — adapt SL to your strategy.
🌍 Live Fundamental & Economic Drivers (Macro Watch – London Session ⏱️)
📈 AUD Support Factors
Commodity demand resilience (China-linked exposure)
Risk-on sentiment across Asia-Pacific equities
Stable RBA stance compared to peers
📉 JPY Weakness Factors
Ongoing ultra-loose BoJ policy
Yield-spread favoring higher-yield currencies
Persistent carry-trade demand
🗓️ High-Impact Events to Monitor
🇦🇺 Australia: Employment data, CPI, RBA statements
🇯🇵 Japan: BoJ policy updates, CPI, wage data
🌐 Global: Risk sentiment, equity market flow, bond yields
📌 Always track live macro updates during London hours before execution.
🔗 Correlated & Related Pairs to Watch
💲 AUD/USD – Confirms AUD strength
💲 NZD/JPY – Risk sentiment alignment
💲 USD/JPY – Yen weakness validation
💲 AUD/NZD – Regional currency balance
👉 If AUD strength aligns across pairs and JPY remains soft → bullish AUD/JPY bias stays valid.
🧩 Key Technical Notes
✔️ Structure holding above demand
✔️ Layered entries reduce timing risk
✔️ Liquidity-based TP zone
✔️ Macro + technical confluence
⚠️ Risk Disclaimer
This idea is for educational purposes only.
You control your entries, exits, and risk. Trade responsibly.
💬 If this setup adds value, boost it with a 👍, 💬 your view, and ⭐ follow for more structured trade ideas.
Let the chart do the talking 📊🔥

AUDJPY: Bullish Continuation & Long Signal
AUDJPY
- Classic bullish setup
- Our team expects bullish continuation
SUGGESTED TRADE:
Swing Trade
Long AUDJPY
Entry Point - 105.65
Stop Loss - 105.53
Take Profit - 105.89
Our Risk - 1%
Start protection of your profits from lower levels
Disclosure: I am part of Trade Nation's Influencer program and receive a monthly fee for using their TradingView charts in my analysis.
❤️ Please, support our work with like & comment! ❤️

AUDJPY Buyers In Panic! SELL!
My dear friends,
Please, find my technical outlook for AUDJPY below:
The price is coiling around a solid key level - 106.29
Bias - Bearish
Technical Indicators: Pivot Points High anticipates a potential price reversal.
Super trend shows a clear sell, giving a perfect indicators' convergence.
Goal - 106.01
Safe Stop Loss - 106.44
About Used Indicators:
The pivot point itself is simply the average of the high, low and closing prices from the previous trading day.
Disclosure: I am part of Trade Nation's Influencer program and receive a monthly fee for using their TradingView charts in my analysis.
————————————
WISH YOU ALL LUCK

AUDJPY BULLISH TO BEARISH OUTLOOKThe Yen is setting up a major bullish rally against major currencies. In the interim we expect the Yen to weaken and allow prices to grab liquidity higher (110 region) before we see the long term bullish yen rally pushing AUDJPY to 86 levels possibly by close of 2026 or early 2027.

AUD/JPY BULLS ARE GAINING STRENGTH|LONG
AUD/JPY SIGNAL
Trade Direction: long
Entry Level: 105.605
Target Level: 106.012
Stop Loss: 105.332
RISK PROFILE
Risk level: medium
Suggested risk: 1%
Timeframe: 1h
Disclosure: I am part of Trade Nation's Influencer program and receive a monthly fee for using their TradingView charts in my analysis.
✅LIKE AND COMMENT MY IDEAS✅

AUD/JPY Price Outlook – Trade Setup📊 Technical Structure
OANDA:AUDJPY AUD/JPY pulled back after the recent rally and is now consolidating around the 105.70–105.93 support zone. This area overlaps with prior demand and a key technical base, where downside momentum has started to slow.
From a structural perspective, the current move appears to be a corrective pullback within an ongoing bullish trend, rather than a trend reversal. As long as price holds above the support zone, the broader price action favours a continuation higher toward the upper resistance area.
🎯 Trade Setup (Bullish Bias)
Entry Zone: 105.70 – 105.93
Stop Loss: 105.61
Take Profit 1: 106.62
Take Profit 2: 106.84
Risk–Reward Ratio: Approx. 1 : 2.36
📌 Invalidation
A sustained break and close below 105.61 would invalidate the bullish setup and suggest a deeper corrective move.
🌐 Macro Background
On the macro front, the Japanese Yen continues to face pressure despite repeated verbal warnings from Japanese officials regarding potential intervention. So far, these comments have failed to translate into concrete action, keeping the JPY structurally vulnerable.
Meanwhile, the Australian Dollar remains supported by expectations that the Reserve Bank of Australia maintains a relatively hawkish stance, especially compared with Japan’s still-accommodative policy environment. This ongoing policy divergence continues to underpin AUD/JPY, favouring buy-on-dips strategies rather than aggressive selling.
🔑 Key Technical Levels
Resistance Zone: 106.68 – 106.84
Support Zone: 105.70 – 105.93
Bullish Invalidation: Below 105.61
📌 Trade Summary
AUD/JPY is undergoing a healthy pullback within a broader bullish structure. As long as price holds above the 105.70 support zone, the technical bias favours a rebound toward the upper resistance band. The overall setup supports a buy-on-dips approach, rather than a bearish trend reversal.
⚠️ Disclaimer
This analysis is for reference only and does not constitute trading advice. Financial markets involve significant risk; proper risk and position management are essential.

AUDJPY: I finally Bought 🇦🇺🇯🇵
This morning, I finally opened a long position on AUDJPY.
I was patiently waiting for a pullback, after the last bullish wave
and BoS.
The price testing a powerful confluence zone based on a rising
trend line and a horizontal support.
With a high probability, it will rise now and reach 106.65 level.
❤️Please, support my work with like, thank you!❤️
I am part of Trade Nation's Influencer program and receive a monthly fee for using their TradingView charts in my analysis.

Bearish reversal off 61.8% Fib resistance?AUD/JPY is reacting off the resistance level, which is a pullback resistance that aligns with the 61.8% Fibonacci retracement and could reverse from this level to our take profit.
Entry: 106.26
Why we like it:
There is a pullback resistance level that aligns with the 61.8% Fibonacci retracement.
Stop loss: 106.69
Why we like it:
There is a multi-swing high resistance level.
Take profit: 105.59
Why we like it:
There is a pullback support level.
Enjoying your TradingView experience? Review us!
Please be advised that the information presented on TradingView is provided to Vantage (‘Vantage Global Limited’, ‘we’) by a third-party provider (‘Everest Fortune Group’). Please be reminded that you are solely responsible for the trading decisions on your account. There is a very high degree of risk involved in trading. Any information and/or content is intended entirely for research, educational and informational purposes only and does not constitute investment or consultation advice or investment strategy. The information is not tailored to the investment needs of any specific person and therefore does not involve a consideration of any of the investment objectives, financial situation or needs of any viewer that may receive it. Kindly also note that past performance is not a reliable indicator of future results. Actual results may differ materially from those anticipated in forward-looking or past performance statements. We assume no liability as to the accuracy or completeness of any of the information and/or content provided herein and the Company cannot be held responsible for any omission, mistake nor for any loss or damage including without limitation to any loss of profit which may arise from reliance on any information supplied by Everest Fortune Group.

AUDJPY uptrend continuation support at 105.36The AUDJPY remains in a bullish trend, with recent price action showing signs of a breakout within the broader uptrend.
Support Zone: 105.36 – a key level from previous consolidation. Price is currently testing or approaching this level.
A bullish rebound from 105.36 would confirm ongoing upside momentum, with potential targets at:
106.73 – initial resistance
107.53 – psychological and structural level
108.00 – extended resistance on the longer-term chart
Bearish Scenario:
A confirmed break and daily close below 105.36 would weaken the bullish outlook and suggest deeper downside risk toward:
104.80 – minor support
104.00 – stronger support and potential demand zone
Outlook:
Bullish bias remains intact while the AUDJPY holds above 105.36. A sustained break below this level could shift momentum to the downside in the short term.
This communication is for informational purposes only and should not be viewed as any form of recommendation as to a particular course of action or as investment advice. It is not intended as an offer or solicitation for the purchase or sale of any financial instrument or as an official confirmation of any transaction. Opinions, estimates and assumptions expressed herein are made as of the date of this communication and are subject to change without notice. This communication has been prepared based upon information, including market prices, data and other information, believed to be reliable; however, Trade Nation does not warrant its completeness or accuracy. All market prices and market data contained in or attached to this communication are indicative and subject to change without notice.

AUDNZD: continued growth🛠 Technical Analysis: On the H4 chart, AUDNZD remains in a broader bullish structure, consolidating above the key 1.1600 base after a strong impulse move. Price is coiling in a tight corrective flag/triangle, suggesting buyers are defending the range rather than reversing. The SMA50 is acting as dynamic support, while the current consolidation resistance sits near 1.16548 — a clean break higher would confirm continuation. The projected upside target is 1.17512, while a drop below the local support invalidates the setup.
———————————————
❗️ Trade Parameters (BUY)
———————————————
➡️ Entry Point: Buy near 16548
🎯 Take Profit: 1.17512
🔴 Stop Loss: 1.16225
⚠️ Disclaimer: This is a potential trade idea based on current analysis; market conditions and price direction are subject to change based on news factors and volatility.

Bearish drop?AUD/JPY is rising towards the pivot, which aligns with the 50% Fibonacci retracement, and could reverse to the 1st support that aligns with the 61.8% Fibonacci retracement.
Pivot: 106.19
1st Support: 105.49
1st Resistance: 106.68
Disclaimer:
The opinions given above constitute general market commentary and do not constitute the opinion or advice of IC Markets or any form of personal or investment advice.
Any opinions, news, research, analyses, prices, other information, or links to third-party sites contained on this website are provided on an "as-is" basis, are intended to be informative only, and are not advice, a recommendation, research, a record of our trading prices, an offer of, or solicitation for, a transaction in any financial instrument and thus should not be treated as such. The information provided does not involve any specific investment objectives, financial situation, or needs of any specific person who may receive it. Please be aware that past performance is not a reliable indicator of future performance and/or results. Past performance or forward-looking scenarios based upon the reasonable beliefs of the third-party provider are not a guarantee of future performance. Actual results may differ materially from those anticipated in forward-looking or past performance statements. IC Markets makes no representation or warranty and assumes no liability as to the accuracy or completeness of the information provided, nor any loss arising from any investment based on a recommendation, forecast, or any information supplied by any third party

AUDJPY Will Go Lower From Resistance! Sell!
Take a look at our analysis for AUDJPY.
Time Frame: 4h
Current Trend: Bearish
Sentiment: Overbought (based on 7-period RSI)
Forecast: Bearish
The price is testing a key resistance 106.402.
Taking into consideration the current market trend & overbought RSI, chances will be high to see a bearish movement to the downside at least to 105.687 level.
P.S
Overbought describes a period of time where there has been a significant and consistent upward move in price over a period of time without much pullback.
Like and subscribe and comment my ideas if you enjoy them!

Bullish continuation setup?AUD/JPY is falling towards the pivot, which acts as a pullback support that aligns with the 23.6% Fibonacci retracement and could bounce to the 1st resistance.
Pivot: 105.71
1st Support: 105.07
1st Resistance: 106.66
Disclaimer:
The opinions given above constitute general market commentary and do not constitute the opinion or advice of IC Markets or any form of personal or investment advice.
Any opinions, news, research, analyses, prices, other information, or links to third-party sites contained on this website are provided on an "as-is" basis, are intended to be informative only, and are not advice, a recommendation, research, a record of our trading prices, an offer of, or solicitation for, a transaction in any financial instrument and thus should not be treated as such. The information provided does not involve any specific investment objectives, financial situation, or needs of any specific person who may receive it. Please be aware that past performance is not a reliable indicator of future performance and/or results. Past performance or forward-looking scenarios based upon the reasonable beliefs of the third-party provider are not a guarantee of future performance. Actual results may differ materially from those anticipated in forward-looking or past performance statements. IC Markets makes no representation or warranty and assumes no liability as to the accuracy or completeness of the information provided, nor any loss arising from any investment based on a recommendation, forecast, or any information supplied by any third party
