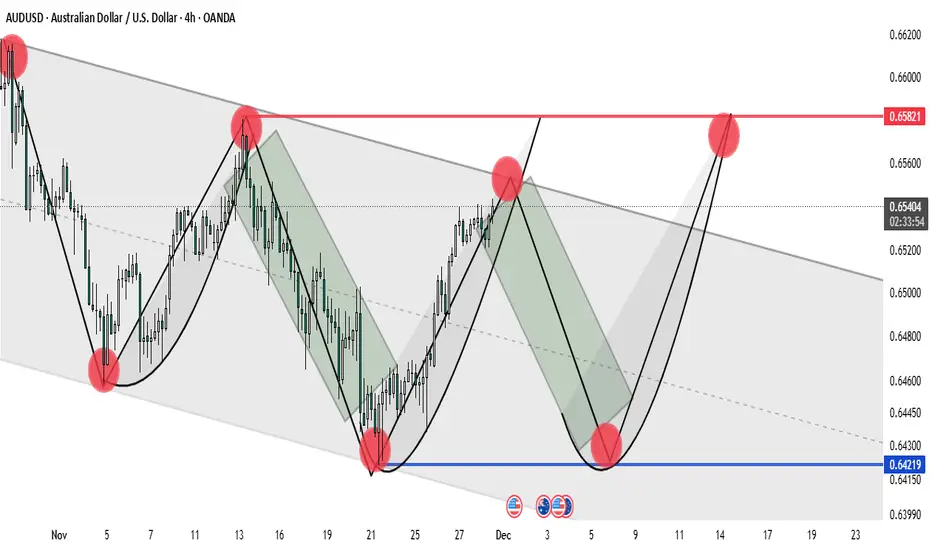
Bearish Symmetrical Triangle Breakdown with Strong Downside AUD/USD 4H – Bearish Symmetrical Triangle Breakdown with Strong Downside Momentum
Detailed Description & Analysis:
Pair: AUD/USD (Australian Dollar vs US Dollar)
Timeframe: 4-hour chart
Key Technical Observations:
Overall Trend:
Strongly bearish. The pair has been in a clear downtrend since early November, making lower highs and lower lows.
Pattern:
A large symmetrical triangle (highlighted in green shading) formed between roughly 10–25 November.
Upper trendline: descending resistance connecting the highs around 0.6620 → 0.6582 → 0.6539
Lower trendline: ascending support connecting the swing lows
The triangle acted as a continuation pattern within the broader downtrend.
Breakdown:
Price broke decisively below the lower trendline of the triangle around 25–26 November with a strong bearish candle and increased volume (visible acceleration downward). This confirms the bearish resolution of the pattern.
Current Price Action (as of 28 Nov):
Trading at ~0.6422 (marked in blue) after a sharp drop from the 0.6582–0.6590 area.
Recent 4H candles show almost uninterrupted selling pressure with very little retracement.
Key Levels:
Immediate resistance: Former triangle support (now resistance) around 0.6480–0.6500
Major horizontal resistance: 0.6582 (multiple prior highs)
Next major support: Psychological 0.6400, then 0.6350–0.6330 zone (2023–2024 lows)
Measured Move Target (from triangle):
Height of the triangle at its widest point ≈ 350–400 pips.
Subtracting from the breakdown point (~0.6520) gives a textbook target around 0.6120–0.6170 longer-term.
Momentum & Sentiment:
Extremely bearish. No meaningful bullish divergence or reversal candles yet. Risk of further capitulation toward multi-year lows if 0.6400 gives way.
Audsud
AudusdHello dear trader or investor
Today we share audusd chart according to this chart audusd may be make good fall so what’s you think about it..

AudsudHello dear trader or investor
Today we share audusd analysis
So it’s Chance made to fly
So what’s you thinking about it ?
Like and comment us

Audusd/NFP analysis Hello dear Trader or Investor
This Chart related with audusd analysis
NFP time audusd high chance to move fly it’s my perdition
So what’s you think about it ?
Like and comment plz


AUDUSD Analysis - ICT ConceptsHey traders, here is the analysis for the AUDUSD. If you guys like my analysis please hit like👍 and follow. Thanks. DISCLAIMER:- This is not financial advice.

AUDUSDthis is how we can get clear and clean setups
we analyz deeply with few confirmations and got 205 pips withen no time
im focusing on price action with few indicators for best and perfect entries
keep practicing on charts you will get these results soon


AUDUSD Hidden Bearish DivergenceHidden bearish divergence suggests that the AUDUSD will resume the
larger trend down and we have not bottomed yet. A new low? We can't not say.
This is not a buy here. Most instruments are showing similar divergences.


Aussie extends losses, job data nextIt has been a rough week for the Australian dollar, which has is down close to 2 per cent this week. AUD/USD is currently trading at 0.7232, down 0.28% on the day.
Australia releases key employment data early on Thursday, and the forecast is not encouraging. The economy is expected to have shed 42.5 thousand in July, after a gain of 29.1 thousand in June. The unemployment rate is projected to tick upwards to 5.0%, up from 4.9%. Wage growth data was released today, with Q2 showing a gain of 0.4%, down from 0.6% in the previous two quarters.
With much of Australia under lockdown due to the outbreak of the delta variant of Covid, employment numbers could get worse and send the Australian dollar lower. The currency has fallen 1.9% this week and earlier today fell to a 10-month low. Unless the upcoming job numbers are stronger than expected, it could continue to be a rough week for the Australian dollar.
The Federal Reserve will host a summit in Jackson Hole next week, and the meeting will be closely watched for any signals regarding a taper, possibly at the December meeting. Fed Chair Powell has taken great pains to telegraph his plans and keep the market in the loop. A tapering of the asset purchase program would be a massive move, and the Fed would make sure to clearly notify the markets of its plans at Jackson Hole or at the September meeting. With investors on the alert for a tapering signal, and an upsurge in Covid sapping confidence in the global recovery, sentiment towards the safe-haven US dollar should remain strong.
AUD is testing resistance at 0.7402. Close by, there is resistance at 0.7431. On the downside, 0.7225 is fluid in support. Below, there is support at 0.7103

AUDJPY buy opportunityHello dear traders. Here my idea to AUDJPY . we will expect bullish continuation to 78.132 level.
Traders, if you liked this idea or have your opinion on it, write in the comments.please like and subscribe to my profile.
Good luck to you.
This idea does not provide the financial advice.

AUDUSD Update As we predicted, AUDUSD was unable to break through the resistance lines.
Now I expect the price to break the support line and then reach the second support line.
Those who did not have time to sell from resistance lines can open sell after breaking through the support line.

GBPAUD - Break Above 1.80 Would Warrant Upside Into 1.81/2+Could bore you with technical/fundamental analysis but going into end of week its really just all eyes on 1.80 as spoken about

AUDUSDFrom the weekly point of views, the price was created a weekly strong demand zone, expect a deeper pullback to this area before another new impulse to the upside. From the daily perspective, this demand zone is correlated with the daily support area, because we have multiple support resistance touches inside of this area.
From the hedge funds' point of view, they are bearish bias on AUD on the longer-term perspectives. But in the today new report, they were added around 3.3k of long positions and closed 800 of short positions on AUD. During AUD push to the downside, short closed but long added, implies they are actually accumulating their long positions in order to buy at the lower price.
The proper way to approaching this pair is to wait for the pullback to the demand zone, then only looking for the long opportunity inside the demand area. A deeper pullback is expected since we have an overextended move to the upside from the weekly point of view.
The result might not follow my analysis, and this analysis is based on the technical and COT perspective.
Comment below let me know your views on AUDUSD.

AUDUSD bounced from support, potential for a further rise!
AUDUSD bounced off 0.68127 where it could potentially rise further to 0.68739.
Trading CFDs on margin carries high risk.
Losses can exceed the initial investment so please ensure you fully
understand the risks.

AUDUSD reversed from resistance, potential drop!
AUDUSD reversed off its resistance at 0.68486 where it could potentially drop further to 0.68321.
Trading CFDs on margin carries high risk.
Losses can exceed the initial investment so please ensure you fully
understand the risks.

AUDUSD reversed from resistance, potential drop!
AUDUSD reversed off its resistance at 0.68807 where it could potentially drop further to 0.68144.
Trading CFDs on margin carries high risk.
Losses can exceed the initial investment so please ensure you fully
understand the risks.


