AUDUSD | Bearish drop offThe price has reacted off our sell entry and could drop to our take profit.
AUDUSD

AUDUSD Daily Forecast -Q4 | W40 | D3 | Y25|
📅 Q4 | W40 | D3 | Y25|
📊 AUDUSD Daily Forecast
🔍 Analysis Approach:
I’m applying Smart Money Concepts, focusing on:
Identifying Points of Interest on the Higher Time Frames (HTFs) 🕰️
Using those POIs to define a clear trading range 📐
Refining those zones on Lower Time Frames (LTFs) 🔎
Waiting for a Break of Structure (BoS) for confirmation ✅
This method allows me to stay precise, disciplined, and aligned with the market narrative, rather than chasing price.
💡 My Motto:
"Capital management, discipline, and consistency in your trading edge."
A positive risk-to-reward ratio, paired with a high win rate, is the backbone of any solid trading plan 📈🔐
⚠️ Losses?
They’re part of the mathematical game of trading 🎲
They don’t define you — they’re necessary, they happen, and we move forward 📊➡️
🙏 I appreciate you taking the time to review my Daily Forecast.
Stay sharp, stay consistent, and protect your capital
— FRNGT 🚀
FX:AUDUSD

AUDUSD Daily Forecast - Q4 | W40 | D1 | Y25|📅 Q4 | W40 | D1 | Y25|
📊 AUDUSD Daily Forecast
🔍 Analysis Approach:
I’m applying Smart Money Concepts, focusing on:
Identifying Points of Interest on the Higher Time Frames (HTFs) 🕰️
Using those POIs to define a clear trading range 📐
Refining those zones on Lower Time Frames (LTFs) 🔎
Waiting for a Break of Structure (BoS) for confirmation ✅
This method allows me to stay precise, disciplined, and aligned with the market narrative, rather than chasing price.
💡 My Motto:
"Capital management, discipline, and consistency in your trading edge."
A positive risk-to-reward ratio, paired with a high win rate, is the backbone of any solid trading plan 📈🔐
⚠️ Losses?
They’re part of the mathematical game of trading 🎲
They don’t define you — they’re necessary, they happen, and we move forward 📊➡️
🙏 I appreciate you taking the time to review my Daily Forecast.
Stay sharp, stay consistent, and protect your capital
— FRNGT 🚀
FX:AUDUSD

AUDUSD Will Explode! BUY!
My dear subscribers,
My technical analysis for AUDUSD is below:
The price is coiling around a solid key level - 0.6592
Bias - Bullish
Technical Indicators: Pivot Points High anticipates a potential price reversal.
Super trend shows a clear buy, giving a perfect indicators' convergence.
Goal - 0.6603
My Stop Loss - 0.6585
About Used Indicators:
By the very nature of the supertrend indicator, it offers firm support and resistance levels for traders to enter and exit trades. Additionally, it also provides signals for setting stop losses
Disclosure: I am part of Trade Nation's Influencer program and receive a monthly fee for using their TradingView charts in my analysis.
———————————
WISH YOU ALL LUCK

AUD/USD could bounce from THIS support levelThe AUD/USD is one of my favourite long plays right now owing to a risk on rally, rallying metal prices, a more hawkish than expected RBA, and the US dollar being under pressure across the board.
Dip-buyers will need to step in around current levels near 0.6580 to maintain control. This level was support/resistance in the past, and my expectations are that it will likely hold as support.
Resistance is clear to see: at 0.6625. If this level gets cleared, then we could well see a continuation towards and above last month's high of 0.6707
By Fawad Razaqzada, market analyst with FOREX.com

EUR/USD | Euro Faces Pressure – Key Supply Zone at 1.1736–1.1762By analyzing the EUR/USD chart on the 2-hour timeframe, we can see that the price is currently trading around 1.172. I expect to see more downside movement soon.
The key supply zone is between 1.17360–1.17620, and if the price retests this area, we should watch closely for reactions. The possible downside targets are 1.17120, 1.1707, 1.16880, and 1.16720.
Please support me with your likes and comments to motivate me to share more analysis with you and share your opinion about the possible trend of this chart with me !
Best Regards , Arman Shaban

AUD/USD SENDS CLEAR BEARISH SIGNALS|SHORT
Hello, Friends!
AUD/USD pair is trading in a local downtrend which know by looking at the previous 1W candle which is red. On the 9H timeframe the pair is going up. The pair is overbought because the price is close to the upper band of the BB indicator. So we are looking to sell the pair with the upper BB line acting as resistance. The next target is 0.652 area.
Disclosure: I am part of Trade Nation's Influencer program and receive a monthly fee for using their TradingView charts in my analysis.
✅LIKE AND COMMENT MY IDEAS✅

Will Case A or Case B Play Out?"📉 The chart highlights a potential selling zone between 1.17670 – 1.18053, where sellers could dominate.
🔮 Two Scenarios Ahead:
Case A:
⬆️ Price extends higher, completing a 5-wave structure before meeting strong resistance.
💥 A reversal from the top zone could trigger a strong sell-off.
Case B:
⏳ Price faces an earlier rejection near current levels after a short corrective move.
🐻 Sellers step in sooner, pushing price toward the demand zone below.
⚖️ Question to you:
👉 Which scenario feels more likely — the wave completion & reversal (Case A) or the immediate rejection (Case B)?
✍️ Drop your analysis, trade plan, and seller zone insights in the comments ⬇️

AUDUSD Will Go Higher From Support! Buy!
Here is our detailed technical review for AUDUSD.
Time Frame: 4h
Current Trend: Bullish
Sentiment: Oversold (based on 7-period RSI)
Forecast: Bullish
The market is testing a major horizontal structure 0.661.
Taking into consideration the structure & trend analysis, I believe that the market will reach 0.666 level soon.
P.S
We determine oversold/overbought condition with RSI indicator.
When it drops below 30 - the market is considered to be oversold.
When it bounces above 70 - the market is considered to be overbought.
Like and subscribe and comment my ideas if you enjoy them!

AUD/USD: Bullish Momentum Builds Within Ascending TriangleAUD/USD has rebounded sharply from the 0.6523 support zone, forming a bottom structure and reclaiming its position above the upward trendline. Price is now consolidating within an ascending triangle near 0.6620, indicating growing bullish pressure.
A break above the 0.6630 resistance would confirm a continuation to higher levels, with momentum favoring buyers. As long as 0.6600 holds as support, the bullish outlook remains intact.

AUDUSD Daily Forecast - Q4 | W40 | D2 | Y25|📅 Q4 | W40 | D2 | Y25|
📊 AUDUSD Daily Forecast
🔍 Analysis Approach:
I’m applying Smart Money Concepts, focusing on:
Identifying Points of Interest on the Higher Time Frames (HTFs) 🕰️
Using those POIs to define a clear trading range 📐
Refining those zones on Lower Time Frames (LTFs) 🔎
Waiting for a Break of Structure (BoS) for confirmation ✅
This method allows me to stay precise, disciplined, and aligned with the market narrative, rather than chasing price.
💡 My Motto:
"Capital management, discipline, and consistency in your trading edge."
A positive risk-to-reward ratio, paired with a high win rate, is the backbone of any solid trading plan 📈🔐
⚠️ Losses?
They’re part of the mathematical game of trading 🎲
They don’t define you — they’re necessary, they happen, and we move forward 📊➡️
🙏 I appreciate you taking the time to review my Daily Forecast.
Stay sharp, stay consistent, and protect your capital
— FRNGT 🚀
FX:AUDUSD

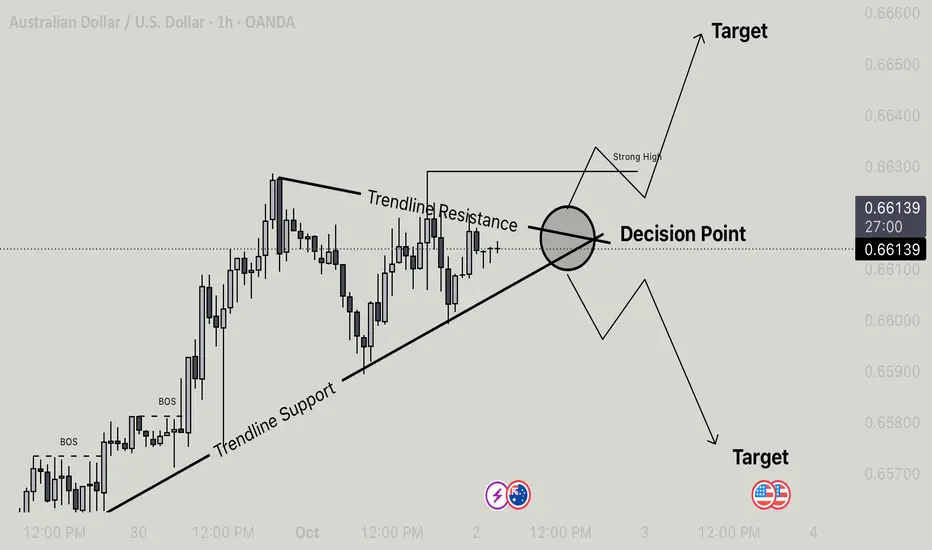
Aud/Usd - Make or Break ZonePrice is currently consolidating above trendline support and nearing a confluence zone of trendline resistance and a major Decision Point. Structure remains bullish after multiple BOS (Break of Structure), but momentum is slowing.
Two scenarios in play:
Bullish Case: A breakout above the descending trendline and Decision Point could lead to a push toward the Strong High and higher targets.
Bearish Case: A rejection from this zone may trigger a liquidity grab, targeting the lower Order Block zone around 0.79300, just above a strong low.
Waiting for clear reaction and price action confirmation at the Decision Point before taking a position. Patience is key.
AUDUSD Pullback Toward 0.65300 Within Ongoing UptrendHey Traders, in today's trading session we are monitoring AUDUSD for a buying opportunity around the 0.65300 zone. The pair is trading in an uptrend, with price currently correcting toward this key support/resistance level.
Structure: The broader bias remains bullish, but price is retracing after recent highs.
Key level in focus: 0.65300 — an area where buyers may look to step in and resume the upward move.
Fundamentals: Commodity-linked currencies remain supported by risk-on sentiment and a softer USD backdrop, which could help AUDUSD hold its bullish structure.
Trade safe,
Joe.

AUDUSD H4 | Bullish ReversalAUD/USD is falling towards the buy entry, which is a pullback support that lines up with the 38.2% Fibonacci retracement and could bounce from this level to the upside.
Buy entry is at 0.6581, which is a pullback support that lines up with the 38.2% Fibonacci retracement.
Stop loss is at 0.6551, which is a pullback support that is slightly above the 78.6% Fibonacci retracement.
Take profit is at 0.6665, which is a pullback resistance.
High Risk Investment Warning
Trading Forex/CFDs on margin carries a high level of risk and may not be suitable for all investors. Leverage can work against you.
Stratos Markets Limited (tradu.com ):
CFDs are complex instruments and come with a high risk of losing money rapidly due to leverage. 65% of retail investor accounts lose money when trading CFDs with this provider. You should consider whether you understand how CFDs work and whether you can afford to take the high risk of losing your money.
Stratos Europe Ltd (tradu.com ):
CFDs are complex instruments and come with a high risk of losing money rapidly due to leverage. 66% of retail investor accounts lose money when trading CFDs with this provider. You should consider whether you understand how CFDs work and whether you can afford to take the high risk of losing your money.
Stratos Global LLC (tradu.com ):
Losses can exceed deposits.
Please be advised that the information presented on TradingView is provided to Tradu (‘Company’, ‘we’) by a third-party provider (‘TFA Global Pte Ltd’). Please be reminded that you are solely responsible for the trading decisions on your account. There is a very high degree of risk involved in trading. Any information and/or content is intended entirely for research, educational and informational purposes only and does not constitute investment or consultation advice or investment strategy. The information is not tailored to the investment needs of any specific person and therefore does not involve a consideration of any of the investment objectives, financial situation or needs of any viewer that may receive it. Kindly also note that past performance is not a reliable indicator of future results. Actual results may differ materially from those anticipated in forward-looking or past performance statements. We assume no liability as to the accuracy or completeness of any of the information and/or content provided herein and the Company cannot be held responsible for any omission, mistake nor for any loss or damage including without limitation to any loss of profit which may arise from reliance on any information supplied by TFA Global Pte Ltd.
The speaker(s) is neither an employee, agent nor representative of Tradu and is therefore acting independently. The opinions given are their own, constitute general market commentary, and do not constitute the opinion or advice of Tradu or any form of personal or investment advice. Tradu neither endorses nor guarantees offerings of third-party speakers, nor is Tradu responsible for the content, veracity or opinions of third-party speakers, presenters or participants.

Potential bearish decline?The Aussie (AUD/USD) has rejected off the pivot and could drop to the 1s support, which is a pullback support.
Pivot: 0.6623
1st Support: 0.6529
1st Resistance: 0.6686
Disclaimer:
The above opinions given constitute general market commentary, and do not constitute the opinion or advice of IC Markets or any form of personal or investment advice.
Any opinions, news, research, analyses, prices, other information, or links to third-party sites contained on this website are provided on an "as-is" basis, are intended only to be informative, is not an advice nor a recommendation, nor research, or a record of our trading prices, or an offer of, or solicitation for a transaction in any financial instrument and thus should not be treated as such. The information provided does not involve any specific investment objectives, financial situation and needs of any specific person who may receive it. Please be aware, that past performance is not a reliable indicator of future performance and/or results. Past Performance or Forward-looking scenarios based upon the reasonable beliefs of the third-party provider are not a guarantee of future performance. Actual results may differ materially from those anticipated in forward-looking or past performance statements. IC Markets makes no representation or warranty and assumes no liability as to the accuracy or completeness of the information provided, nor any loss arising from any investment based on a recommendation, forecast or any information supplied by any third-party.

AUD/USD Price Outlook – Trade Setup📊 Technical Structure
OANDA:AUDUSD AUD/USD is consolidating around the 0.6600 handle, finding interim support near the 0.6572–0.6582 zone. The pair remains in a medium-term uptrend, supported by a rising trendline, and the current pullback appears corrective. A rebound from the support zone could see the pair retest the 0.6669–0.6680 resistance area.
🎯 Trade Setup
Entry: 0.6572 – 0.6582 (near support)
Stop Loss: 0.6564
Take Profit: 0.6680
Risk-to-Reward: ~1 : 5.41
🗝️ Key Technical Levels
Resistance Zone: 0.6669 – 0.6680
Support Zone: 0.6572 – 0.6582
Trendline Support: rising from 0.6500
🌍 Macro Background
The Australian Dollar remains under modest pressure after mixed domestic data: the AiG Industry Index improved but stayed in contraction and the Manufacturing PMI eased to 51.4. The Reserve Bank of Australia (RBA) kept rates at 3.6%, noting inflation remains contained for now, but signalled no clear forward guidance until November. On the US side, the looming government shutdown and expectations of a Fed rate cut in October (97% priced in) keep the US Dollar subdued, limiting AUD downside. If US data disappoints this week, AUD/USD could gain traction toward the resistance area.
📌 Trade Summary
AUD/USD is showing buying potential from the support zone near 0.6582, with upside room toward 0.6680. The setup favours a long position, backed by trendline support and dovish Fed expectations.
⚠️ Disclaimer
This analysis is for reference only and does not constitute trading advice. Trading involves significant risk, and proper risk management is essential.

AUUDSD: Sells? Wait For It... Wait For It...!Sept 17 marked the Swing High, taking out buy side liquidity. We've been in retracement since then. The structure looks to be turning bearish. Combine that with the strength of the US Dollar versus the current weakness in the AUD... look for an opportunity to sell, my people.
Enjoy!
May profits be upon you.
Leave any questions or comments in the comment section.
I appreciate any feedback from my viewers!
Like and/or subscribe if you want more accurate analysis.
Thank you so much!
Disclaimer:
I do not provide personal investment advice and I am not a qualified licensed investment advisor.
All information found here, including any ideas, opinions, views, predictions, forecasts, commentaries, suggestions, expressed or implied herein, are for informational, entertainment or educational purposes only and should not be construed as personal investment advice. While the information provided is believed to be accurate, it may include errors or inaccuracies.
I will not and cannot be held liable for any actions you take as a result of anything you read here.
Conduct your own due diligence, or consult a licensed financial advisor or broker before making any and all investment decisions. Any investments, trades, speculations, or decisions made on the basis of any information found on this channel, expressed or implied herein, are committed at your own risk, financial or otherwise.

AUDCAD LOCAL CORRECTION|SHORT|
✅AUDCAD price taps into the supply level after an extended rally, hinting at distribution. From an ICT view, this area may trigger a shift in order flow, drawing price toward inefficiency and the marked target zone. Time Frame 4H.
SHORT🔥
✅Like and subscribe to never miss a new idea!✅

AUD-USD Short From Supply Level! Sell!
Hello,Traders!
AUDUSD shows a rejection from the horizontal supply area, signaling Smart Money distribution at premium levels. Price action suggests liquidity sweep above resistance before shifting flow downward. Time Frame 3H.
Sell!
Comment and subscribe to help us grow!
Check out other forecasts below too!
Disclosure: I am part of Trade Nation's Influencer program and receive a monthly fee for using their TradingView charts in my analysis.

AUDUSD: Weak Market & Bearish Forecast
The recent price action on the AUDUSD pair was keeping me on the fence, however, my bias is slowly but surely changing into the bearish one and I think we will see the price go down.
Disclosure: I am part of Trade Nation's Influencer program and receive a monthly fee for using their TradingView charts in my analysis.
❤️ Please, support our work with like & comment! ❤️

BUY US Dollar! Sell xxxUSD Pairs! Buy USDxxx Pairs!This is the FOREX futures outlook for the Sept 30th.
In this video, we will analyze the following FX markets:
USD Index, EUR, GBP, AUD, NZD, CAD, CHF, and JPY.
Keep it simple! Buy USDxxx pairs. Sell xxxUSD pairs. Just wait for valid setups. Once price shows a valid change in the state of delivery on your entry TFs, enter.
Enjoy!
May profits be upon you.
Leave any questions or comments in the comment section.
I appreciate any feedback from my viewers!
Like and/or subscribe if you want more accurate analysis.
Thank you so much!
Disclaimer:
I do not provide personal investment advice and I am not a qualified licensed investment advisor.
All information found here, including any ideas, opinions, views, predictions, forecasts, commentaries, suggestions, expressed or implied herein, are for informational, entertainment or educational purposes only and should not be construed as personal investment advice. While the information provided is believed to be accurate, it may include errors or inaccuracies.
I will not and cannot be held liable for any actions you take as a result of anything you read here.
Conduct your own due diligence, or consult a licensed financial advisor or broker before making any and all investment decisions. Any investments, trades, speculations, or decisions made on the basis of any information found on this channel, expressed or implied herein, are committed at your own risk, financial or otherwise.

AUDUSD Daily Forecast -Q3 | W40 | D30 | Y25|📅 Q3 | W40 | D30 | Y25|
📊 AUDUSD Daily Forecast
🔍 Analysis Approach:
I’m applying Smart Money Concepts, focusing on:
Identifying Points of Interest on the Higher Time Frames (HTFs) 🕰️
Using those POIs to define a clear trading range 📐
Refining those zones on Lower Time Frames (LTFs) 🔎
Waiting for a Break of Structure (BoS) for confirmation ✅
This method allows me to stay precise, disciplined, and aligned with the market narrative, rather than chasing price.
💡 My Motto:
"Capital management, discipline, and consistency in your trading edge."
A positive risk-to-reward ratio, paired with a high win rate, is the backbone of any solid trading plan 📈🔐
⚠️ Losses?
They’re part of the mathematical game of trading 🎲
They don’t define you — they’re necessary, they happen, and we move forward 📊➡️
🙏 I appreciate you taking the time to review my Daily Forecast.
Stay sharp, stay consistent, and protect your capital
— FRNGT 🚀
FX:AUDUSD

AUD/USD Technical Roadmap – From TMA Pullback to Resistance Zone🦘 The Aussie Heist: AUD/USD Wealth Strategy Map (Swing/Day Trade) 💰
Asset: AUD/USD ("The Aussie")
Vibe: Bullish breakout with a cheeky thief-style layered entry! 😎
📜 The Master Plan: Stealing Profits with Style!
We’re cooking up a bullish setup on AUD/USD with a thief-inspired swing/day trading strategy. Here’s the blueprint to nab those pips:
✅ Bullish Confirmation: A solid bullish pan formation, backed by a Triangular Moving Average (TMA) pullback.
✅ Heikin Ashi Power: Bullish Heikin Ashi candles screaming, "The trend is your friend!"
✅ Double Bottom Setup: A classic double bottom on the TMA pullback, giving us that extra confidence to strike.
🕵️♂️ Entry: The Thief’s Layered Heist
This is where the Thief Strategy shines! We’re using a layered entry approach with multiple buy limit orders to sneak into the market like a pro. No single entry for us — we’re stacking the odds!
Buy Limit Layers:
🎯 0.65700
🎯 0.65800
🎯 0.65900
🎯 0.66000
Pro Tip: Feel free to add more layers based on your risk appetite — the more, the merrier! Just keep it calculated, you sly fox. 🦊
Note: You can enter at any price level within this range if you spot a good opportunity. The thief’s motto? Strike when the market’s distracted!
🛑 Stop Loss: The Thief’s Escape Plan
Set your Stop Loss at 0.65500 to keep the cops at bay.
Disclaimer: Dear Ladies & Gentlemen (Thief OGs), this SL is my suggestion, but it’s your heist! Adjust it to your risk tolerance and protect your loot. 💼
🎯 Target: Dodging the Police Barricade
Our profit target is set at 0.66800, where we expect a strong resistance zone (aka the police barricade), potential overbought conditions, and a sneaky trap for the bulls.Escape Plan: Lock in profits before the market turns on you!
Note: Thief OGs, this TP is my take, but you’re the boss of your trades. Take profits at your comfort level and run with the cash! 💸
🔍 Related Pairs to Watch
Keep an eye on these correlated forex pairs (all in USD) to spot potential confirmations or divergences:
OANDA:NZDUSD : The Kiwi often moves in tandem with the Aussie due to their economic ties. Watch for similar bullish setups!
OANDA:USDCAD : An inverse correlation — if USD weakens, AUD/USD and NZD/USD may rally.
FX:EURUSD : A broader USD strength/weakness gauge. If EUR/USD is climbing, it could support our bullish AUD/USD bias.
Key Point: AUD/USD is sensitive to commodity prices (gold, iron ore) and risk sentiment. A strong bullish move in NZD/USD or a weakening USD across pairs could supercharge this setup!
⚡ Why This Setup Rocks
TMA Pullback: A reliable signal for trend continuation.
Heikin Ashi Confirmation: Filters out noise and keeps us on the bullish path.
Layered Entries: Spreads risk and maximizes entry opportunities.
Double Bottom: A high-probability reversal pattern for extra confidence.
This setup is designed for swing/day traders who love a calculated, fun approach to the markets. Let’s steal those pips together! 😜
✨ “If you find value in my analysis, a 👍 and 🚀 boost is much appreciated — it helps me share more setups with the community!”
Disclaimer: This is a thief-style trading strategy crafted for fun and educational purposes. Trade at your own risk, and always use proper risk management. No financial advice here — just a playful take on market opportunities!
#TradingView #AUDUSD #ForexTrading #SwingTrading #DayTrading #ThiefStrategy #TechnicalAnalysis
