AUD/USD Intraday Analysis – September 30, 2025The AUD/USD pair has recently broken out from a short-term consolidation and is currently showing bullish momentum. On the 1-hour chart, price action suggests a potential ABC corrective wave structure forming, with wave (A) recently completed and wave (B) expected to provide a minor pullback before wave (C) continuation.
Key Technical Levels:
Support Zones:
0.6570 – 0.6560 (intraday support)
0.6540 – 0.6525 (stronger short-term support)
Resistance Zones:
0.6620 – 0.6625 (wave A high / near-term resistance)
0.6640 – 0.6650 (wave C target / extended resistance)
Trendlines: Price has respected the ascending trendline from the recent low, supporting the bullish outlook.
Fibonacci: A retracement towards 0.6575–0.6580 may offer a low-risk entry for buyers targeting wave (C).
Momentum: Bullish momentum remains intact, but RSI is approaching the overbought area, indicating a possible minor pullback (wave B) before continuation.
Intraday Trading Strategy:
Buy Setup:
Entry: 0.6575 – 0.6580
Stop Loss: 0.6560
Take Profit: 0.6620 (TP1), 0.6640 (TP2)
Sell Setup:
Consider selling only if price breaks below 0.6560 with strong bearish confirmation.
Conclusion:
The current structure favors bullish continuation after a minor pullback, aligning with the projected ABC pattern. Traders should wait for price to reach the support zone near 0.6575–0.6580 before considering long positions. Discipline and proper risk management remain essential .
AUDUSD

AUDUSD RBA may not cut rate, AUD bullishAUDUSD is trading on intraday bullish trend with potential news RBA may not cut rates again this cycle.
With further weakness on DXY has boosted AUD to bouce off the daily support level and may continue to trend back to the daily resistance line and even further break the high.
4h price actions hows a trong liquidity sweep in the previous session showing a ptential bounce of this market.

AUD-USD Free Signal! Sell!
Hello,Traders!
AUDUSD supply rejection within the horizontal supply area strengthens bearish SMC outlook, with price expected to dive lower as liquidity shifts in favor sellers.
—————————
Stop Loss: 0.6589
Take Profit: 0.6562
Entry: 0.6576
Time Frame 4H.
—————————
Sell!
Comment and subscribe to help us grow!
Check out other forecasts below too!
Disclosure: I am part of Trade Nation's Influencer program and receive a monthly fee for using their TradingView charts in my analysis.

AUDUSD Analysis todayHello traders, this is a complete multiple timeframe analysis of this pair. We see could find significant trading opportunities as per analysis upon price action confirmation we may take this trade. Smash the like button if you find value in this analysis and drop a comment if you have any questions or let me know which pair to cover in my next analysis.

AUDUSD Bullish consolidation supported at 0.6540The AUDUSD remains in a bullish trend, with recent price action showing signs of a breakout within the broader uptrend.
Support Zone: 0.6540 – a key level from previous consolidation. Price is currently testing or approaching this level.
A bullish rebound from 0.6540 would confirm ongoing upside momentum, with potential targets at:
0.6640 – initial resistance
0.6656 – psychological and structural level
0.6670 – extended resistance on the longer-term chart
Bearish Scenario:
A confirmed break and daily close below 0.6540 would weaken the bullish outlook and suggest deeper downside risk toward:
0.6520 – minor support
0.6500 – stronger support and potential demand zone
Outlook:
Bullish bias remains intact while the AUDUSD holds above 0.6540. A sustained break below this level could shift momentum to the downside in the short term.
This communication is for informational purposes only and should not be viewed as any form of recommendation as to a particular course of action or as investment advice. It is not intended as an offer or solicitation for the purchase or sale of any financial instrument or as an official confirmation of any transaction. Opinions, estimates and assumptions expressed herein are made as of the date of this communication and are subject to change without notice. This communication has been prepared based upon information, including market prices, data and other information, believed to be reliable; however, Trade Nation does not warrant its completeness or accuracy. All market prices and market data contained in or attached to this communication are indicative and subject to change without notice.

AUD/USD Intraday Technical Analysis – September 29, 2025The AUD/USD pair is currently trading at 0.65635, following a sharp downtrend from recent highs near 0.6680. On the hourly chart, we observe clear consolidation zones and potential ABC corrective patterns forming, which can provide actionable intraday trading opportunities.
Key Technical Observations:
Trend Analysis:
The overall trend remains bearish, confirmed by lower highs and lower lows on the hourly chart.
EMA alignment shows short-term EMA below the longer-term EMA, reinforcing downward momentum.
Support and Resistance Levels:
Immediate resistance: 0.6570 – 0.6575 (Point A)
Intraday support: 0.6528 – 0.6535 (Point B zone)
Next strong resistance: 0.6600 – 0.6620
Deeper support: 0.6500 – 0.6510
ABC Correction Scenario:
Price appears to be forming a potential ABC corrective pattern, with the current rally reaching Point A.
Anticipated retracement to Point B near 0.6530, followed by a rebound to Point C around 0.6575 – 0.6580.
Traders can use this structure for swing intraday entries, placing stops just beyond key support and resistance levels.
Fibonacci and Price Action:
Recent swing low near 0.6525 and swing high near 0.6570 suggest the 0.618 Fibonacci retracement aligns with the projected Point B (~0.6530), enhancing the validity of the retracement.
Watch for price rejection at Fibonacci levels, which may indicate continuation of the ABC corrective wave.
Trading Strategy:
Aggressive traders: Enter long positions near 0.6530 (Point B), targeting 0.6575 – 0.6580 (Point C) with tight stop-loss below 0.6525.
Conservative traders: Wait for confirmation of reversal at Point B, using candlestick patterns or EMA crossovers.
Avoid selling at current levels (0.6563) unless a break below 0.6530 occurs with strong momentum.
Conclusion:
AUD/USD remains in a short-term corrective structure within a larger downtrend. Monitoring the ABC pattern completion around key support and resistance levels provides clear trade setups for both intraday and swing traders. Follow these levels and adjust positions according to price action confirmation to minimize risk.

AUDUSD H4 | Approaching key resistanceThe Aussie (AUD/USD) is rising towards the sell entry which is an overlap resistance that is slightly below the 38.2% Fibonacci retracement and could reverse from this level to the downside.
Sell entry is at 0.6582, which is an overlap resistance that is slightly below the 38.2% Fibonacci retracement.
Stop loss is at 0.6634, which is a pullback resistance that aligns with the 61.8% Fibonacci retracement.
Take profit is at 0.6510, which is a pullback support.
High Risk Investment Warning
Trading Forex/CFDs on margin carries a high level of risk and may not be suitable for all investors. Leverage can work against you.
Stratos Markets Limited (tradu.com ):
CFDs are complex instruments and come with a high risk of losing money rapidly due to leverage. 65% of retail investor accounts lose money when trading CFDs with this provider. You should consider whether you understand how CFDs work and whether you can afford to take the high risk of losing your money.
Stratos Europe Ltd (tradu.com ):
CFDs are complex instruments and come with a high risk of losing money rapidly due to leverage. 66% of retail investor accounts lose money when trading CFDs with this provider. You should consider whether you understand how CFDs work and whether you can afford to take the high risk of losing your money.
Stratos Global LLC (tradu.com ):
Losses can exceed deposits.
Please be advised that the information presented on TradingView is provided to Tradu (‘Company’, ‘we’) by a third-party provider (‘TFA Global Pte Ltd’). Please be reminded that you are solely responsible for the trading decisions on your account. There is a very high degree of risk involved in trading. Any information and/or content is intended entirely for research, educational and informational purposes only and does not constitute investment or consultation advice or investment strategy. The information is not tailored to the investment needs of any specific person and therefore does not involve a consideration of any of the investment objectives, financial situation or needs of any viewer that may receive it. Kindly also note that past performance is not a reliable indicator of future results. Actual results may differ materially from those anticipated in forward-looking or past performance statements. We assume no liability as to the accuracy or completeness of any of the information and/or content provided herein and the Company cannot be held responsible for any omission, mistake nor for any loss or damage including without limitation to any loss of profit which may arise from reliance on any information supplied by TFA Global Pte Ltd.
The speaker(s) is neither an employee, agent nor representative of Tradu and is therefore acting independently. The opinions given are their own, constitute general market commentary, and do not constitute the opinion or advice of Tradu or any form of personal or investment advice. Tradu neither endorses nor guarantees offerings of third-party speakers, nor is Tradu responsible for the content, veracity or opinions of third-party speakers, presenters or participants.

AUDUSD Daily Forecast -Q3 | W40 | D29 | Y25|📅 Q3 | W40 | D29 | Y25|
📊 AUDUSD Daily Forecast
🔍 Analysis Approach:
I’m applying Smart Money Concepts, focusing on:
Identifying Points of Interest on the Higher Time Frames (HTFs) 🕰️
Using those POIs to define a clear trading range 📐
Refining those zones on Lower Time Frames (LTFs) 🔎
Waiting for a Break of Structure (BoS) for confirmation ✅
This method allows me to stay precise, disciplined, and aligned with the market narrative, rather than chasing price.
💡 My Motto:
"Capital management, discipline, and consistency in your trading edge."
A positive risk-to-reward ratio, paired with a high win rate, is the backbone of any solid trading plan 📈🔐
⚠️ Losses?
They’re part of the mathematical game of trading 🎲
They don’t define you — they’re necessary, they happen, and we move forward 📊➡️
🙏 I appreciate you taking the time to review my Daily Forecast.
Stay sharp, stay consistent, and protect your capital
— FRNGT 🚀

Q3 | W40 | D29 | Y25| -AUDUSD Daily Forecast📅 Q3 | W40 | D29 | Y25|
📊 AUDUSD Daily Forecast
🔍 Analysis Approach:
I’m applying Smart Money Concepts, focusing on:
Identifying Points of Interest on the Higher Time Frames (HTFs) 🕰️
Using those POIs to define a clear trading range 📐
Refining those zones on Lower Time Frames (LTFs) 🔎
Waiting for a Break of Structure (BoS) for confirmation ✅
This method allows me to stay precise, disciplined, and aligned with the market narrative, rather than chasing price.
💡 My Motto:
"Capital management, discipline, and consistency in your trading edge."
A positive risk-to-reward ratio, paired with a high win rate, is the backbone of any solid trading plan 📈🔐
⚠️ Losses?
They’re part of the mathematical game of trading 🎲
They don’t define you — they’re necessary, they happen, and we move forward 📊➡️
🙏 I appreciate you taking the time to review my Daily Forecast.
Stay sharp, stay consistent, and protect your capital
— FRNGT 🚀
FX:AUDUSD

AUDUSD BREAKDOWN 3 % -Q3 | W39 | D23 | Y25|📅 Q3 | W39 | D23 | Y25|
📊 AUDUSD BREAKDOWN
🔍 Analysis Approach:
I’m applying Smart Money Concepts, focusing on:
Identifying Points of Interest on the Higher Time Frames (HTFs) 🕰️
Using those POIs to define a clear trading range 📐
Refining those zones on Lower Time Frames (LTFs) 🔎
Waiting for a Break of Structure (BoS) for confirmation ✅
Confluence for the Long (Mid to Lower Time Frames)
✅ 4H area identified
✅ Price failed to continue the downtrend
✅ 4H range aligned with 4H order block
✅ Bullish 4H candle closures confirmed from the area
✅ 1H & 15’ Break of Structure (BOS) identified
✅ 15’ Order Block identified
✅ Price moved away, breaking structure from the 15’
✅ 5’ Order Block + clear BOS identified
✅ Buy limit set
🎯 AUDUSD – 3R secured
This method allows me to stay precise, disciplined, and aligned with the market narrative, rather than chasing price.
💡 My Motto:
"Capital management, discipline, and consistency in your trading edge."
A positive risk-to-reward ratio, paired with a high win rate, is the backbone of any solid trading plan 📈🔐
⚠️ Losses?
They’re part of the mathematical game of trading 🎲
They don’t define you — they’re necessary, they happen, and we move forward 📊➡️
🙏 I appreciate you taking the time to review my Daily Forecast.
Stay sharp, stay consistent, and protect your capital
— FRNGT 🚀

Bullish bounce off pullback support?The Aussie (AUD/USD) is reacting off the pivot which is a pullback support that aligns with the 50% Fibonacci retracement and could bounce to the 1st resistance.
Pivot: 0.6544
1st Support: 0.6399
1st Resistance: 0.6794
Disclaimer:
The above opinions given constitute general market commentary, and do not constitute the opinion or advice of IC Markets or any form of personal or investment advice.
Any opinions, news, research, analyses, prices, other information, or links to third-party sites contained on this website are provided on an "as-is" basis, are intended only to be informative, is not an advice nor a recommendation, nor research, or a record of our trading prices, or an offer of, or solicitation for a transaction in any financial instrument and thus should not be treated as such. The information provided does not involve any specific investment objectives, financial situation and needs of any specific person who may receive it. Please be aware, that past performance is not a reliable indicator of future performance and/or results. Past Performance or Forward-looking scenarios based upon the reasonable beliefs of the third-party provider are not a guarantee of future performance. Actual results may differ materially from those anticipated in forward-looking or past performance statements. IC Markets makes no representation or warranty and assumes no liability as to the accuracy or completeness of the information provided, nor any loss arising from any investment based on a recommendation, forecast or any information supplied by any third-party.

EUR USD AUD NVDA MSFT AVGO S&P500 BTC XRP Weekly InsightsIn this video, we dive into the key market movements and outlooks for major financial instruments over the past week. Highlights include:
Analysis of currency pairs: EUR/USD and AUD
Trends and technical setups for leading tech stocks: NVDA, MSFT, AAPL, AVGO
The S&P 500’s performance and what it suggests about broader market direction
Developments in cryptocurrency, with a focus on BTC and XRP
Whether you’re a trader, investor, or just interested in macro markets, this video gives you a consolidated, data-driven snapshot of where things stand and what to watch next.

AUDUSD Bearish Breakout!
HI,Traders !
#AUDUSD is going down
Now and the made
A bearish breakout of the
Key horizontal level
Of 0.65628 so we are locally
Bearish biased and we
Will be expecting a
Further bearish move down !
Comment and subscribe to help us grow !

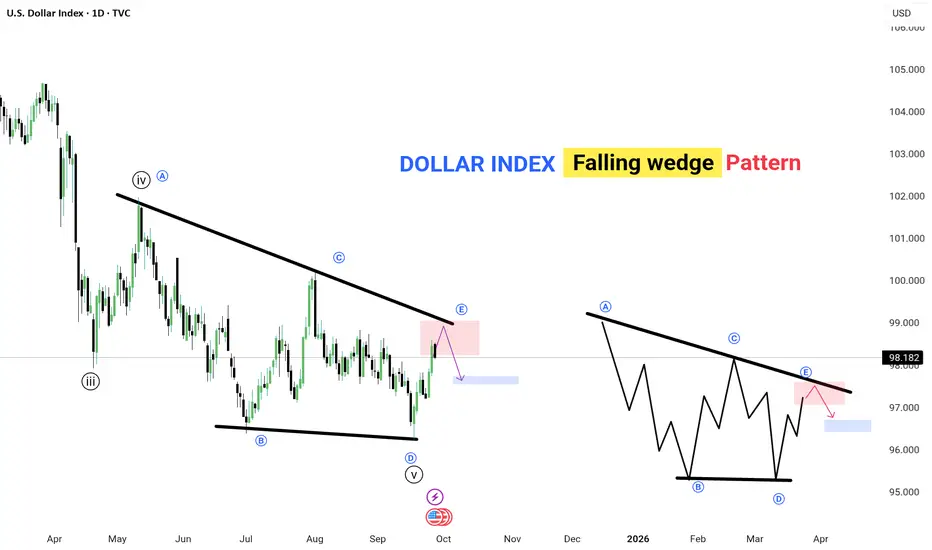
DOLLAR INDEX – Falling Wedge Pattern📉 The Dollar Index is forming a falling wedge, a classic reversal pattern.
🔹 Price is approaching the upper trendline resistance (point E).
🔹 Expect a potential pullback toward the support zone (highlighted in blue).
🔹 Pattern repeats: After E, a corrective dip is likely before the next move.
✅ Key Points:
Falling wedge usually signals trend reversal or continuation.
Watch for breakout confirmation above resistance for bullish continuation.
Current focus: resistance zone near 98–98.2, then potential drop to 96–97 support.
💡 Lesson: Patience pays — wait for clear rejection or breakout before trading this setup.
---
AUD-USD Bullish Confirmation! Buy!
Hello,Traders!
AUDUSD confirms breakout above neckline, shifting order flow bullish. SMC structure suggests price will expand toward liquidity resting at 0.6555. Time Frame 1H.
Buy!
Comment and subscribe to help us grow!
Check out other forecasts below too!
Disclosure: I am part of Trade Nation's Influencer program and receive a monthly fee for using their TradingView charts in my analysis.

XAU/USD | Gold at $3,740 – Demand Zone Decides the Next MoveBy analyzing the Gold chart on the 1-hour timeframe, we can see that yesterday the price finally started a correction, dropping to $3,717 . From this key psychological level, demand stepped in and pushed gold strongly up to $3,761 .
Currently, gold is trading around $3,740 , but it hasn’t fully stabilized yet. For that, the price needs to revisit the $3,711–$3,726 demand zone . If gold holds there, we could expect another powerful rally toward levels above $3,800 . Otherwise, we may soon see it dropping into the $3,600 range .
THE LATEST TA :
Please support me with your likes and comments to motivate me to share more analysis with you and share your opinion about the possible trend of this chart with me !
Best Regards , Arman Shaban

AUDUSD H4 | Potential bearish drop Based on the H4 chart analysis, we can see that the price has reacted off the sell entry and could drop from this level to the downside.
Sell entry is 0.6558, which is a pullback resistance.
Stop loss is at 0.6619, which is a pullback resistance.
Take profit is at 0.6483, which is a pullback support that is slightly above the 78.6% Fibonacci retracement.
High Risk Investment Warning
Trading Forex/CFDs on margin carries a high level of risk and may not be suitable for all investors. Leverage can work against you.
Stratos Markets Limited (tradu.com ):
CFDs are complex instruments and come with a high risk of losing money rapidly due to leverage. 65% of retail investor accounts lose money when trading CFDs with this provider. You should consider whether you understand how CFDs work and whether you can afford to take the high risk of losing your money.
Stratos Europe Ltd (tradu.com ):
CFDs are complex instruments and come with a high risk of losing money rapidly due to leverage. 66% of retail investor accounts lose money when trading CFDs with this provider. You should consider whether you understand how CFDs work and whether you can afford to take the high risk of losing your money.
Stratos Global LLC (tradu.com ):
Losses can exceed deposits.
Please be advised that the information presented on TradingView is provided to Tradu (‘Company’, ‘we’) by a third-party provider (‘TFA Global Pte Ltd’). Please be reminded that you are solely responsible for the trading decisions on your account. There is a very high degree of risk involved in trading. Any information and/or content is intended entirely for research, educational and informational purposes only and does not constitute investment or consultation advice or investment strategy. The information is not tailored to the investment needs of any specific person and therefore does not involve a consideration of any of the investment objectives, financial situation or needs of any viewer that may receive it. Kindly also note that past performance is not a reliable indicator of future results. Actual results may differ materially from those anticipated in forward-looking or past performance statements. We assume no liability as to the accuracy or completeness of any of the information and/or content provided herein and the Company cannot be held responsible for any omission, mistake nor for any loss or damage including without limitation to any loss of profit which may arise from reliance on any information supplied by TFA Global Pte Ltd.
The speaker(s) is neither an employee, agent nor representative of Tradu and is therefore acting independently. The opinions given are their own, constitute general market commentary, and do not constitute the opinion or advice of Tradu or any form of personal or investment advice. Tradu neither endorses nor guarantees offerings of third-party speakers, nor is Tradu responsible for the content, veracity or opinions of third-party speakers, presenters or participants.

AUDUSD - Bullish Control Ahead!Hello TradingView Family / Fellow Traders. This is Richard, also known as theSignalyst.
📈AUDUSD has been overall bullish trading within the rising channel marked in blue.
This week, AUDUSD has been retesting the lower bound of the channel.
Moreover, the green zone is a strong support.
🏹 Thus, the highlighted blue circle is a strong area to look for buy setups as it is the intersection of the lower blue trendline and green support.
📚 As per my trading style:
As #AUDUSD approaches the blue circle zone, I will be looking for trend-following bullish reversal setups (like a double bottom pattern, trendline break , and so on...)
📚 Always follow your trading plan regarding entry, risk management, and trade management.
Good luck!
All Strategies Are Good; If Managed Properly!
~Richard Nasr

Heading into pullback resistance?The Aussie (AUD/USD) is rising towards the pivot and could reverse to the pullback support that lines up with the 78.6% Fibonacci retracement.
Pivot: 0.6577
1st Support: 0.6485
1st Resistance: 0.6637
Disclaimer:
The above opinions given constitute general market commentary, and do not constitute the opinion or advice of IC Markets or any form of personal or investment advice.
Any opinions, news, research, analyses, prices, other information, or links to third-party sites contained on this website are provided on an "as-is" basis, are intended only to be informative, is not an advice nor a recommendation, nor research, or a record of our trading prices, or an offer of, or solicitation for a transaction in any financial instrument and thus should not be treated as such. The information provided does not involve any specific investment objectives, financial situation and needs of any specific person who may receive it. Please be aware, that past performance is not a reliable indicator of future performance and/or results. Past Performance or Forward-looking scenarios based upon the reasonable beliefs of the third-party provider are not a guarantee of future performance. Actual results may differ materially from those anticipated in forward-looking or past performance statements. IC Markets makes no representation or warranty and assumes no liability as to the accuracy or completeness of the information provided, nor any loss arising from any investment based on a recommendation, forecast or any information supplied by any third-party.

Q3 | W39 | D26 | Y25| Fun Coupon Fri -AUDUSD Daily Forecast📅 Q3 | W39 | D26 | Y25|
📊 AUDUSD Daily Forecast
Fun Coupon Fri
🔍 Analysis Approach:
I’m applying Smart Money Concepts, focusing on:
Identifying Points of Interest on the Higher Time Frames (HTFs) 🕰️
Using those POIs to define a clear trading range 📐
Refining those zones on Lower Time Frames (LTFs) 🔎
Waiting for a Break of Structure (BoS) for confirmation ✅
This method allows me to stay precise, disciplined, and aligned with the market narrative, rather than chasing price.
💡 My Motto:
"Capital management, discipline, and consistency in your trading edge."
A positive risk-to-reward ratio, paired with a high win rate, is the backbone of any solid trading plan 📈🔐
⚠️ Losses?
They’re part of the mathematical game of trading 🎲
They don’t define you — they’re necessary, they happen, and we move forward 📊➡️
🙏 I appreciate you taking the time to review my Daily Forecast.
Stay sharp, stay consistent, and protect your capital
— FRNGT 🚀
FX:AUDUSD

Bullish reversal for the Aussie?The price is falling towards the support level which is a pullback support that aligns with the 61.8% Fibonacci retracement and could bounce from this level to our take profit.
Entry: 0.6519
Why we like it:
There is a pullback support that aligns with the 61.8% Fibonacci retracement.
Stop loss: 0.6469
Why we like it:
There is a pullback support that aligns with the 78.6% Fibonacci retracement.
Take profit: 0.6580
Why we like it:
There is a pullback resistance.
Enjoying your TradingView experience? Review us!
Please be advised that the information presented on TradingView is provided to Vantage (‘Vantage Global Limited’, ‘we’) by a third-party provider (‘Everest Fortune Group’). Please be reminded that you are solely responsible for the trading decisions on your account. There is a very high degree of risk involved in trading. Any information and/or content is intended entirely for research, educational and informational purposes only and does not constitute investment or consultation advice or investment strategy. The information is not tailored to the investment needs of any specific person and therefore does not involve a consideration of any of the investment objectives, financial situation or needs of any viewer that may receive it. Kindly also note that past performance is not a reliable indicator of future results. Actual results may differ materially from those anticipated in forward-looking or past performance statements. We assume no liability as to the accuracy or completeness of any of the information and/or content provided herein and the Company cannot be held responsible for any omission, mistake nor for any loss or damage including without limitation to any loss of profit which may arise from reliance on any information supplied by Everest Fortune Group.

AUD/USD: Uptrend Supported by Stable Commodity MarketThe AUD/USD pair continues to rise, supported by the Australian dollar benefiting from a stable commodity market and a positive risk sentiment. The US dollar is under pressure due to the Fed cutting interest rates, weakening the USD.
AUD/USD is maintaining a strong uptrend, with resistance at 0.6650. Although there has been a slight correction, the primary trend remains upward. If the price breaks through the 0.6650 resistance, the next target could be the 0.6680 area. At the same time, the support trendline at 0.6580 remains intact.
Strategy to consider:
Buy at 0.6580, targeting 0.6650 and 0.6680.
Stop-loss below 0.6580 if the price drops sharply.
With the current uptrend and the stability of the underlying factors, AUD/USD could continue to reach new highs in the short term.

AUDUSD Is Going Up! Long!
Take a look at our analysis for AUDUSD.
Time Frame: 9h
Current Trend: Bullish
Sentiment: Oversold (based on 7-period RSI)
Forecast: Bullish
The market is approaching a key horizontal level 0.658.
Considering the today's price action, probabilities will be high to see a movement to 0.668.
P.S
Overbought describes a period of time where there has been a significant and consistent upward move in price over a period of time without much pullback.
Like and subscribe and comment my ideas if you enjoy them!
