AUDUSD Bullish Trend Continuation From Marked Support ZonesH4 - Bullish Trend in play
Two Solid Support Levels
Trend continuation very likely after pullback.
Audusdbuy

AUDUSD Short Term Buy IdeaH4 - Strong bullish move.
Currently it looks like a pullback is happening.
Until the two Fibonacci support zones hold I expect the price to move higher further.
If you enjoy this idea, don’t forget to LIKE 👍, FOLLOW ✅, SHARE 🙌, and COMMENT ✍! Drop your thoughts and charts below to keep the discussion going. Your support helps keep this content free and reach more people! 🚀
--------------------------------------------------------------------------------------------------------

AUDUSD FRGNT Daily Forecast - Q4 | W47| D19 | Y25 |📅 Q4 | W47| D19 | Y25 |
📊 AUDUSD FRGNT Daily Forecast
🔍 Analysis Approach:
I’m applying Smart Money Concepts, focusing on:
Identifying Points of Interest on the Higher Time Frames (HTFs) 🕰️
Using those POIs to define a clear trading range 📐
Refining those zones on Lower Time Frames (LTFs) 🔎
Waiting for a Break of Structure (BoS) for confirmation ✅
This method allows me to stay precise, disciplined, and aligned with the market narrative, rather than chasing price.
💡 My Motto:
"Capital management, discipline, and consistency in your trading edge."
A positive risk-to-reward ratio, paired with a high win rate, is the backbone of any solid trading plan 📈🔐
⚠️ Losses?
They’re part of the mathematical game of trading 🎲
They don’t define you — they’re necessary, they happen, and we move forward 📊➡️
🙏 I appreciate you taking the time to review my Daily Forecast.
Stay sharp, stay consistent, and protect your capital
— FRNGT 🚀
OANDA:AUDUSD

AUD/USD – Bearish Breakout Signal Triggered AUD/USD – Bearish Breakout Signal Triggered (79% Backtest Probability)
A fresh SELL signal has been generated on AUD/USD, driven by a confirmed Breakout pattern on the current timeframe.
This setup aligns strongly with our automated trend-following model and carries a 79% historical backtest probability, indicating a high-quality bearish continuation opportunity.
🔍 Technical Breakdown
The price structure on AUD/USD is currently reflecting:
1. Bearish Breakout Structure
The pair recently pushed through a minor intraday structure, forming a lower high — a classic precursor to bearish continuation.
The breakout reflects rejection of upper liquidity, signaling sellers stepping in with control.
2. Trend Alignment
Our trend-following model confirms that:
The pair is trading below key dynamic levels.
Momentum indicators show downside pressure building.
The breakout pattern is clean and free from noise, improving its reliability.
This confluence increases the confidence that the downside move may continue.
🌍 Market Context & Macro Influence
Dollar strength continues to weigh heavily on AUD/USD, as:
Risk sentiment remains fragile
Interest rate differentials favor USD
Recent macro data prints support a stronger dollar outlook
AUD continues to show weakness due to commodity softness and cautious global sentiment
In short, the macro backdrop supports the bearish technical structure currently forming on the chart.
📌 Key Technical Levels to Watch
Immediate Resistance: 0.65297
Sellers are expected to defend this zone aggressively.
Immediate Support: 0.64907
A clean break below this region may accelerate bearish momentum.
Major Resistance: 0.65753
A strong structural ceiling — bullish invalidation sits above this level.
Major Support: 0.64451
The next major liquidity target for sellers if the present breakout expands.
🎯 Trade Parameters (Based on 0.10 Lot Size)
Parameter Level
Entry 0.65102
Stop Loss (SL) 0.65302
Take Profit (TP) 0.64702
Risk $50
Potential Profit $100
R:R Ratio 1 : 2
This structure offers a clean, mechanical setup with well-defined risk boundaries.
🛡 Risk Management Notes
Professional-grade risk practices include:
Never risk more than 1–2% of total capital per trade
Consider scaling into the position if price retests the breakout zone
Use a trailing stop after price moves in your favor
Avoid holding during high-impact USD or AUD economic events
Ensure proper position sizing based on your account balance
If volatility expands, consider partial profit-taking
Breakout trades can accelerate quickly — staying disciplined is essential.
📌 Final Thoughts
AUD/USD currently presents a high-probability bearish continuation setup, supported by both technical structure and macro context.
With backtested performance at 79%, clear levels, and defined risk, this opportunity fits well within professional trend-following models.
Traders should monitor price behavior near support at 0.64907 — a breakdown from this region may trigger the next wave of selling pressure toward 0.64702 and beyond.

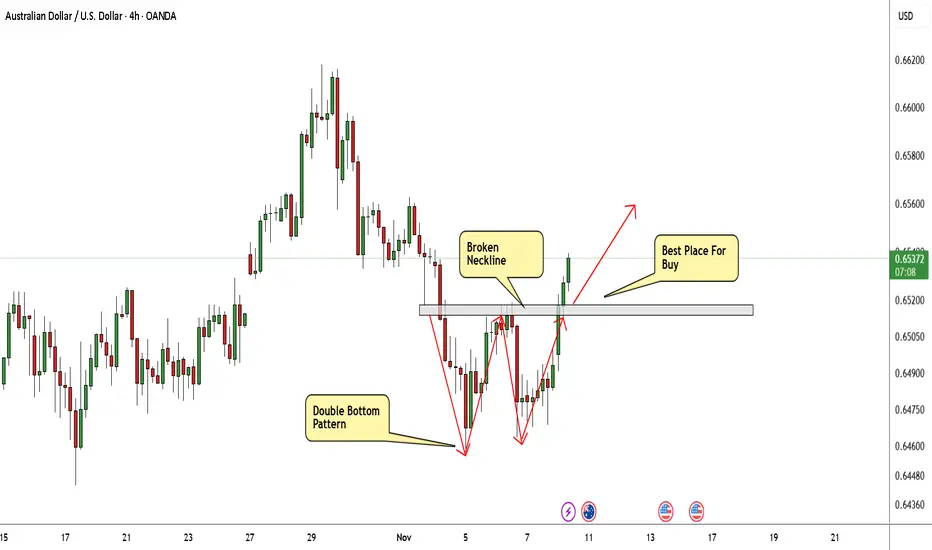
AUD/USD Made Clear Reversal Pattern,Long Setup To Get 150 Pips !Here is my 4H Chart On AUD/USD , The price creating a very clear reversal pattern ( Double Bottom Reversal Pattern ) and the price made a very good bullish price action now And the price confirmed the pattern by closing above the neckline. so we can enter a buy trade when the price go back to retest the broken neckline to can use a small stop loss , or we can enter now if you are aggressive trader but the stop loss will be bigger , and we can targeting from 50 to 100 pips with a decent stop loss .
Reasons To Enter :
1- Perfect Touch For The Area .
2- Clear Bullish Price Action .
3- Bigger T.F Giving Good Bullish P.A .
4- Clear Reversal Pattern .
5- Pattern Confirmed .
AUDUSD: Neutral View First Buy and Then Sell! Hey everyone!
Our first buy swing entry is going swimmingly! We’ve got over 500 pips running positively, and we reckon price can keep going up and then when it hits our selling zone, you can swing sell too. This is a fantastic opportunity where we can wait for price to do its thing and then when it reaches the sell zone, we can execute our order. But if you’re feeling adventurous and want to take a bit of a risk, you can take a buy entry at the given point and keep it up until it reaches our sell area.
With just one shot, we can make two entries!
Good luck and trade safely!
Thanks a bunch for your unwavering support! 😊
If you’d like to lend a hand, here are a few ways you can contribute:
- Like our ideas
- Comment on our ideas
- Share our ideas
Cheers,
Team Setupsfx_
❤️🚀

AUDUSD FRGNT Daily Forecast - Q4 | W46 | D11 | Y25 |📅 Q4 | W46 | D11 | Y25 |
📊 AUDUSD FRGNT Daily Forecast
🔍 Analysis Approach:
I’m applying Smart Money Concepts, focusing on:
Identifying Points of Interest on the Higher Time Frames (HTFs) 🕰️
Using those POIs to define a clear trading range 📐
Refining those zones on Lower Time Frames (LTFs) 🔎
Waiting for a Break of Structure (BoS) for confirmation ✅
This method allows me to stay precise, disciplined, and aligned with the market narrative, rather than chasing price.
💡 My Motto:
"Capital management, discipline, and consistency in your trading edge."
A positive risk-to-reward ratio, paired with a high win rate, is the backbone of any solid trading plan 📈🔐
⚠️ Losses?
They’re part of the mathematical game of trading 🎲
They don’t define you — they’re necessary, they happen, and we move forward 📊➡️
🙏 I appreciate you taking the time to review my Daily Forecast.
Stay sharp, stay consistent, and protect your capital
— FRNGT 🚀
OANDA:AUDUSD

AUD/USD 4H – Market Outlook and Trade ThesisFOREXCOM:AUDUSD AUD/USD is currently trading around 0.6495, sitting just above a prior minor liquidity pocket and approaching a broader demand zone centered around 0.64407. Price action has been steadily retracing from the recent swing highs, and the structure suggests a potential liquidity sweep into the 0.64407 demand zone, which aligns with the base of my marked region.
Bullish Scenario
My projection is that price will drop into 0.64407, tap the demand zone, reject strongly, and then rotate higher toward the previous major swing high.
My target aligns with the upper green zone toward 0.67065, which corresponds to a high-value inefficiency zone and a prior rejection level. This creates a logical buy-to-sell profile: liquidity grabs at the lows followed by a drive into a premium zone where sellers were previously active.
Stop-Loss Structure
Your stop loss should be placed at the red line below 0.64140, which strategically sits outside the deeper liquidity shelf. If hit, it would invalidate the entire bullish structure and confirm that buyers are not defending the zone.
This placement is logical because:
1. It protects you from minor stop hunts inside the redistribution wick cluster.
2. A break below 0.64140 would confirm bearish continuation rather than a corrective pullback.
⸻
Devil’s Advocate: What Could Break This Setup?
To avoid bias, here are the key threats to this bullish idea:
1. AUD remains fundamentally weak
If risk sentiment worsens or USD strength accelerates on macro data, price may not respect the 0.64407 zone at all.

AUDUSD FRGNT Daily Forecast Full Chart Analysis -Q4 | W45 | D7| 📅 Q4 | W45 | D7| Y25 |
📊 AUDUSD FRGNT Daily Forecast Full Chart Analysis
FRGNT FUN COUPON FRIDAY
🔍 Analysis Approach:
I’m applying Smart Money Concepts, focusing on:
Identifying Points of Interest on the Higher Time Frames (HTFs) 🕰️
Using those POIs to define a clear trading range 📐
Refining those zones on Lower Time Frames (LTFs) 🔎
Waiting for a Break of Structure (BoS) for confirmation ✅
This method allows me to stay precise, disciplined, and aligned with the market narrative, rather than chasing price.
💡 My Motto:
"Capital management, discipline, and consistency in your trading edge."
A positive risk-to-reward ratio, paired with a high win rate, is the backbone of any solid trading plan 📈🔐
⚠️ Losses?
They’re part of the mathematical game of trading 🎲
They don’t define you — they’re necessary, they happen, and we move forward 📊➡️
🙏 I appreciate you taking the time to review my Daily Forecast.
Stay sharp, stay consistent, and protect your capital
— FRNGT 🚀

AUDUSD FRGNT Daily Forecast - Q4 | W44 | D31| Y25 |📅 Q4 | W44 | D31| Y25 |
📊 AUDUSD FRGNT Daily Forecast
🔍 Analysis Approach:
I’m applying Smart Money Concepts, focusing on:
Identifying Points of Interest on the Higher Time Frames (HTFs) 🕰️
Using those POIs to define a clear trading range 📐
Refining those zones on Lower Time Frames (LTFs) 🔎
Waiting for a Break of Structure (BoS) for confirmation ✅
This method allows me to stay precise, disciplined, and aligned with the market narrative, rather than chasing price.
💡 My Motto:
"Capital management, discipline, and consistency in your trading edge."
A positive risk-to-reward ratio, paired with a high win rate, is the backbone of any solid trading plan 📈🔐
⚠️ Losses?
They’re part of the mathematical game of trading 🎲
They don’t define you — they’re necessary, they happen, and we move forward 📊➡️
🙏 I appreciate you taking the time to review my Daily Forecast.
Stay sharp, stay consistent, and protect your capital
— FRNGT 🚀
OANDA:AUDUSD

AUDUSD FRGNT Daily Forecast -Q4 | W44 | D31| Y25 |📅 Q4 | W44 | D31| Y25 |
📊 AUDUSD FRGNT Daily Forecast
🔍 Analysis Approach:
I’m applying Smart Money Concepts, focusing on:
Identifying Points of Interest on the Higher Time Frames (HTFs) 🕰️
Using those POIs to define a clear trading range 📐
Refining those zones on Lower Time Frames (LTFs) 🔎
Waiting for a Break of Structure (BoS) for confirmation ✅
This method allows me to stay precise, disciplined, and aligned with the market narrative, rather than chasing price.
💡 My Motto:
"Capital management, discipline, and consistency in your trading edge."
A positive risk-to-reward ratio, paired with a high win rate, is the backbone of any solid trading plan 📈🔐
⚠️ Losses?
They’re part of the mathematical game of trading 🎲
They don’t define you — they’re necessary, they happen, and we move forward 📊➡️
🙏 I appreciate you taking the time to review my Daily Forecast.
Stay sharp, stay consistent, and protect your capital
— FRNGT 🚀
OANDA:AUDUSD

AUDUSD FRGNT Daily Forecast -Q4 | W44 | D30| Y25 |📅 Q4 | W44 | D30| Y25 |
📊 AUDUSD FRGNT Daily Forecast
🔍 Analysis Approach:
I’m applying Smart Money Concepts, focusing on:
Identifying Points of Interest on the Higher Time Frames (HTFs) 🕰️
Using those POIs to define a clear trading range 📐
Refining those zones on Lower Time Frames (LTFs) 🔎
Waiting for a Break of Structure (BoS) for confirmation ✅
This method allows me to stay precise, disciplined, and aligned with the market narrative, rather than chasing price.
💡 My Motto:
"Capital management, discipline, and consistency in your trading edge."
A positive risk-to-reward ratio, paired with a high win rate, is the backbone of any solid trading plan 📈🔐
⚠️ Losses?
They’re part of the mathematical game of trading 🎲
They don’t define you — they’re necessary, they happen, and we move forward 📊➡️
🙏 I appreciate you taking the time to review my Daily Forecast.
Stay sharp, stay consistent, and protect your capital
— FRNGT 🚀
OANDA:AUDUSD

Is the Aussie Dollar Ready for a Strong Upside Push?🎯 AUD/USD: The Great Heist Setup | 200 SMA Breakout in Play! 💰
📊 Market Overview
The Aussie Dollar is making moves, ladies and gents! We've got a confirmed bullish breakout above the 200 Simple Moving Average — and you know what that means... it's time to plan our strategic entry! 🚀
🎭 The "Thief Strategy" Breakdown
🔍 Asset Analysis
Pair: AUD/USD (Aussie Dollar vs. US Dollar)
Market Type: Forex
Trade Style: Swing/Day Trade
Setup: Capital Flow Blueprint
📈 Technical Outlook
✅ Bullish bias confirmed with price breaking and holding above the 200 SMA
✅ Momentum building as buyers step in
✅ Higher timeframe structure supporting upside potential
🎯 Entry Strategy: "The Layering Heist"
The Thief Strategy uses multiple limit orders (layering technique) to scale into positions like a pro! Here's the blueprint:
💎 Multi-Layer Entry Zones:
Layer 1: 0.65400
Layer 2: 0.65600
Layer 3: 0.64800
Layer 4: 0.66000
Note: You can add more layers based on your capital allocation and risk appetite. Scale in smart, scale out smarter! 😎
🛡️ Risk Management
⛔ Stop Loss: 0.65200
Disclaimer: This is the Thief's SL level for reference. However, OG Thieves — set your own stop loss based on YOUR risk tolerance. Your capital, your rules! 🎲
🎯 Take Profit Target: 0.67000
Why 0.67000? This level acts as:
🚧 Strong resistance zone ("Police Barricade")
📊 Potential overbought territory
Historical trap zone — secure profits before the reversal!
Disclaimer: This is a suggested TP level. Trail your stops, scale out partially, or set your own target. Take money when you make money — it's your game! 💵
🔗 Correlated Pairs to Watch
Keep an eye on these related markets for confluence:
OANDA:NZDUSD — Commodity currency cousin, often moves in tandem with AUD
OANDA:AUDJPY — Risk-on sentiment gauge
OANDA:AUDCAD — Inter-commodity pair correlation
USD Index ( TVC:DXY ) — Inverse correlation with AUD/USD
Gold ( OANDA:XAUUSD ) — Aussie correlates with gold due to mining exports
💡 Pro Tip: If USD weakens broadly and gold rallies, AUD/USD typically benefits!
🔑 Key Points Summary
✨ Bullish breakout above 200 SMA = momentum shift
✨ Layering strategy allows better average entry price
✨ Risk-to-reward favors bulls with clear targets
✨ Watch DXY weakness and gold strength for confirmation
✨ Resistance at 0.67000 — bank profits before reversal zones!
✨ If you find value in my analysis, a 👍 and 🚀 boost is much appreciated — it helps me share more setups with the community!
#AUDUSD #ForexTrading #SwingTrading #DayTrading #ThiefStrategy #200SMA #Breakout #TechnicalAnalysis #ForexSignals #AussieDollar #LayeringStrategy #RiskManagement #ForexSetup #TradingIdeas #PriceAction
AUDUSD potential move in short term Had test of OB and trend shift on LTF, ptentially move to take buyside liqudity

AUDUSD Trade Plan - Waiting for a Pullback & Structure Break.The AUDUSD has officially broken structure to the upside, signaling bullish momentum ✅.
I’m currently waiting for price to retrace back into equilibrium within the previous swing range before considering any long positions—price is overextended at current levels and chasing here wouldn’t be smart ⚖️📉.
Patience is key as I wait for premium liquidity zones to be tapped for a high-probability entry setup 🎯.
⚠️ Disclaimer: This is market analysis and not financial advice.
AUDUSD Trade Plan - Waiting for a Pullback & Structure Break.

AUDUSD FRGNT Daily Forecast -Q4 | W43 | D21| Y25 | 📅 Q4 | W43 | D21| | Y25 |
📊 AUDUSD FRGNT Daily Forecast
🔍 Analysis Approach:
I’m applying Smart Money Concepts, focusing on:
Identifying Points of Interest on the Higher Time Frames (HTFs) 🕰️
Using those POIs to define a clear trading range 📐
Refining those zones on Lower Time Frames (LTFs) 🔎
Waiting for a Break of Structure (BoS) for confirmation ✅
This method allows me to stay precise, disciplined, and aligned with the market narrative, rather than chasing price.
💡 My Motto:
"Capital management, discipline, and consistency in your trading edge."
A positive risk-to-reward ratio, paired with a high win rate, is the backbone of any solid trading plan 📈🔐
⚠️ Losses?
They’re part of the mathematical game of trading 🎲
They don’t define you — they’re necessary, they happen, and we move forward 📊➡️
🙏 I appreciate you taking the time to review my Daily Forecast.
Stay sharp, stay consistent, and protect your capital
— FRNGT 🚀
OANDA:AUDUSD

AUD/USD: Bullish Reversal to 0.652?FX:AUDUSD is gearing up for a bullish reversal on the 1-hour chart , where price has respected the downward trendline as dynamic support, forming a lower high that suggests weakening bearish momentum. The entry zone aligns perfectly near this confluence, offering a high-probability long setup with potential for a bounce off the support zone.
Entry between 0.6420-0.6432 for a buy position. Targets at 0.650 (first) and 0.652 (second) near the resistance zone for excellent risk-reward. Set a stop loss on a close below 0.641 to safeguard against further downside. Watch for confirmation via a strong bullish candle with rising volume, as the pair tests key levels amid ongoing commodity influences.
Fundamentally, today we have speeches from Mr. Powell, Chairman of the Federal Reserve, ahead, and I anticipate potential market volatility. 💡
📝 Trade Plan:
✅ Entry Zone: 0.6420 – 0.6432 (buy area near confluence support)
❌ Stop Loss: Close below 0.6410
🎯 Targets:
TP1: 0.6500 (initial resistance)
TP2: 0.6520 (extended target zone)
What's your play on this setup? Comment below! 👇

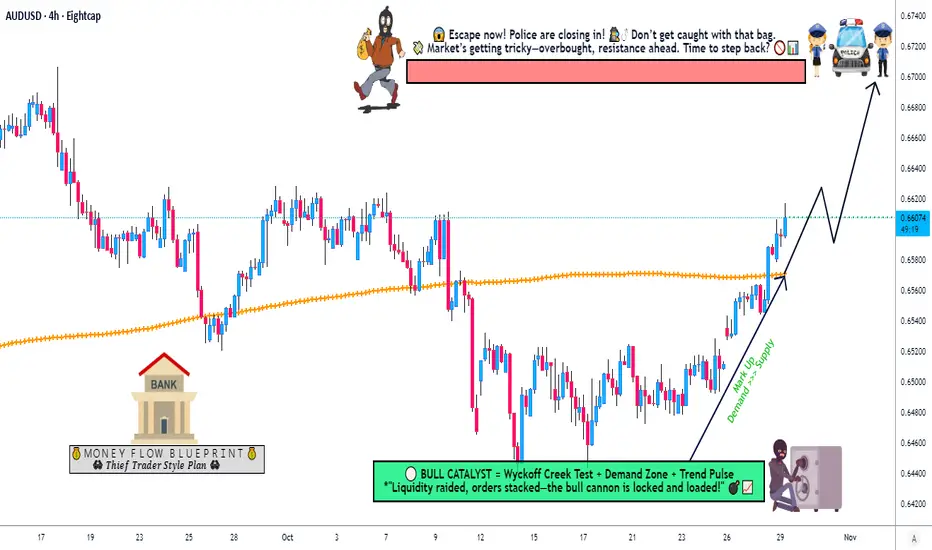
"AUD/USD Breakout | Bullish Robbery to Overbought Resistance"🚨💰🦘 AUD/USD "The Aussie" Forex Bank Heist 💰🚨
Oi mates & fellow market robbers! 🏴☠️💵
This is your Thief Trader breaking into the Aussie vault — and this time, the loot is in pips, not gold bars. 😎
💥 MISSION PLAN: Bullish raid with layered limit orders — stacking like a pro safecracker. No hesitation, no mercy. Entry? Any price the vault door swings open. 📈🔓
📍 ENTRY:
🎯 Slip in at ANY level, but a true thief knows how to wait for the pullback sweet spots. Layer the buys like bricks in a getaway tunnel.
🛑 STOP LOSS:
🚔 Park it at 0.64900 — our last escape hatch before the police sirens get too close.
🎯 TARGET:
💣 0.66200 — POLICE BARRICADE RESISTANCE ZONE 🚧🔥 Overbought territory where the getaway chopper is waiting.
📊 Why the Aussie vault is ripe for robbery:
Bullish momentum is loading up like a cash van before payday. 💵
Big players pushing price higher — we just tailgate the convoy. 🚚💨
Layering entries means more bags filled if the price dips before liftoff. 🛍️
⚠ Robbery Rules:
Avoid news time unless you love chaos. 📢
Keep SL tight and respect the plan — greedy thieves get caught.
Trailing stop = locking loot while the ride continues.
💖 Boost this heist plan if you’re rolling with the crew! 🚀💰 The more likes, the louder the sirens, the bigger the thrill.
🏆 Stay sharp, stay sneaky, and let’s rob the Aussie bank together! 🐱👤💸

AUD/USD Price Outlook – Trade Setup📊 Technical Structure
OANDA:AUDUSD AUD/USD is consolidating around the 0.6600 handle, finding interim support near the 0.6572–0.6582 zone. The pair remains in a medium-term uptrend, supported by a rising trendline, and the current pullback appears corrective. A rebound from the support zone could see the pair retest the 0.6669–0.6680 resistance area.
🎯 Trade Setup
Entry: 0.6572 – 0.6582 (near support)
Stop Loss: 0.6564
Take Profit: 0.6680
Risk-to-Reward: ~1 : 5.41
🗝️ Key Technical Levels
Resistance Zone: 0.6669 – 0.6680
Support Zone: 0.6572 – 0.6582
Trendline Support: rising from 0.6500
🌍 Macro Background
The Australian Dollar remains under modest pressure after mixed domestic data: the AiG Industry Index improved but stayed in contraction and the Manufacturing PMI eased to 51.4. The Reserve Bank of Australia (RBA) kept rates at 3.6%, noting inflation remains contained for now, but signalled no clear forward guidance until November. On the US side, the looming government shutdown and expectations of a Fed rate cut in October (97% priced in) keep the US Dollar subdued, limiting AUD downside. If US data disappoints this week, AUD/USD could gain traction toward the resistance area.
📌 Trade Summary
AUD/USD is showing buying potential from the support zone near 0.6582, with upside room toward 0.6680. The setup favours a long position, backed by trendline support and dovish Fed expectations.
⚠️ Disclaimer
This analysis is for reference only and does not constitute trading advice. Trading involves significant risk, and proper risk management is essential.

AUD/USD Bullish Reversal Setup – Support Bounce & Target 0.6706air & Timeframe
Pair: AUD/USD (Australian Dollar vs. US Dollar)
Timeframe: 2H (2-hour chart)
This means each candle represents 2 hours of price movement.
2. Market Structure
Trend Before Setup:
Price was in a downtrend, shown by the descending channel (red parallel lines).
Current Price: Around 0.6598
3. Key Levels
Support Zone:
0.6555 – 0.6583 (highlighted blue/grey box)
This is where price has been bouncing multiple times, showing demand (buyers).
Resistance / Target Zone:
0.6706 (blue line labeled “TARGET POINT”)
This is the next significant resistance, where traders may take profit.
4. Setup Explanation
This looks like a long (buy) setup:
Entry Zone: Near 0.6583 (support level).
Stop-Loss: Slightly below 0.6555 (to avoid fake breakouts).
Take-Profit Target: Around 0.6706
This gives a risk-reward ratio of about 3:1, which is a good setup.
5. Technical Pattern
Price seems to be breaking out of the downtrend channel, or at least testing the upper side of it.
If it successfully holds above the support and bounces, it signals a bullish reversal.
6. Trade Idea
📌 Bias: Bullish (Buy setup)
✅ Confirmation: Wait for price to respect the support zone (0.6583) and start moving upward with bullish candles.
🚫 Invalidation: If price breaks below 0.6555 and closes there, the setup fails (downtrend continues).
Summary
Scenario 1 (Bullish): Price respects support → move toward 0.6706 target.
Scenario 2 (Bearish): Price closes below 0.6555 → expect further downside toward 0.6520 or lower.

AUDUSD Daily Forecast -Q3 | W39 | D23 | Y25|📅 Q3 | W39 | D23 | Y25|
📊 AUDUSD Daily Forecast
🔍 Analysis Approach:
I’m applying Smart Money Concepts, focusing on:
Identifying Points of Interest on the Higher Time Frames (HTFs) 🕰️
Using those POIs to define a clear trading range 📐
Refining those zones on Lower Time Frames (LTFs) 🔎
Waiting for a Break of Structure (BoS) for confirmation ✅
This method allows me to stay precise, disciplined, and aligned with the market narrative, rather than chasing price.
💡 My Motto:
"Capital management, discipline, and consistency in your trading edge."
A positive risk-to-reward ratio, paired with a high win rate, is the backbone of any solid trading plan 📈🔐
⚠️ Losses?
They’re part of the mathematical game of trading 🎲
They don’t define you — they’re necessary, they happen, and we move forward 📊➡️
🙏 I appreciate you taking the time to review my Daily Forecast.
Stay sharp, stay consistent, and protect your capital
— FRNGT 🚀
FX:AUDUSD

AUDUSD Daily Forecast UPDATE BUY LIMIT -Q3 | W39 | D22 | Y25|Q3 | W39 | D22 | Y25|
📊 AUDUSD Daily Forecast
🔍 Analysis Approach:
I’m applying Smart Money Concepts, focusing on:
Identifying Points of Interest on the Higher Time Frames (HTFs) 🕰️
Using those POIs to define a clear trading range 📐
Refining those zones on Lower Time Frames (LTFs) 🔎
Waiting for a Break of Structure (BoS) for confirmation ✅
This method allows me to stay precise, disciplined, and aligned with the market narrative, rather than chasing price.
💡 My Motto:
"Capital management, discipline, and consistency in your trading edge."
A positive risk-to-reward ratio, paired with a high win rate, is the backbone of any solid trading plan 📈🔐
⚠️ Losses?
They’re part of the mathematical game of trading 🎲
They don’t define you — they’re necessary, they happen, and we move forward 📊➡️
🙏 I appreciate you taking the time to review my Daily Forecast.
Stay sharp, stay consistent, and protect your capital
— FRNGT 🚀
FX:AUDUSD

Q3 | W39 | D22 | Y25| - AUDUSD Daily Forecast📅 Q3 | W39 | D22 | Y25|
📊 AUDUSD Daily Forecast
🔍 Analysis Approach:
I’m applying Smart Money Concepts, focusing on:
Identifying Points of Interest on the Higher Time Frames (HTFs) 🕰️
Using those POIs to define a clear trading range 📐
Refining those zones on Lower Time Frames (LTFs) 🔎
Waiting for a Break of Structure (BoS) for confirmation ✅
This method allows me to stay precise, disciplined, and aligned with the market narrative, rather than chasing price.
💡 My Motto:
"Capital management, discipline, and consistency in your trading edge."
A positive risk-to-reward ratio, paired with a high win rate, is the backbone of any solid trading plan 📈🔐
⚠️ Losses?
They’re part of the mathematical game of trading 🎲
They don’t define you — they’re necessary, they happen, and we move forward 📊➡️
🙏 I appreciate you taking the time to review my Daily Forecast.
Stay sharp, stay consistent, and protect your capital
— FRNGT 🚀
FX:AUDUSD
