AUDUSD SELL | Idea Trading AnalysisAUDUSD is moving on Resistance zone..
The chart is above the support level, which has already become a reversal point twice.
We expect a decline in the channel after testing the current level.
We expect a decline in the channel after testing the current level
Hello Traders, here is the full analysis.
I think we can soon see more fall from this range! GOOD LUCK! Great SELL opportunity AUDUSD
I still did my best and this is the most likely count for me at the moment.
-------------------
Traders, if you liked this idea or if you have your own opinion about it, write in the comments. I will be glad ⚜️
Audusdidea

AUDUSD Potential Long!
HI,Traders !
#AUDUSD is trading in a
Local uptrend and the pair
Will soon hit a horizontal
Support level of 0.66126
From where we will be
Expecting a local
Bullish rebound !
Comment and subscribe to help us grow !

AUD/USD Bullish Repricing Scenario Developing🔥 AUD/USD — Aussie Dollar Bullish Expansion Play? | Swing / Day Trade
📌 Asset
AUD/USD – “THE AUSSIE”
Forex Market Trade Opportunity Guide (Swing / Day Trade)
📈 Market Bias
🟢 Bullish Structure Active
Higher-timeframe support holding with continuation potential toward premium resistance zones.
🎯 Trade Plan
Plan: Bullish continuation
Entry Model: Flexible positioning using layered limit orders
📥 Layered Buy Zones (Scale-In Model):
0.66000
0.66100
0.66200
0.66300
➡️ You may expand or reduce layers based on risk and capital management.
📌 Alternative: Market participation is valid at any favorable price level aligned with your strategy.
🛑 Risk Management
Stop Loss: 0.65900
⚠️ Always adjust stop loss according to your own risk model and account size.
📝 Note: This SL is a reference point, not a mandate. Capital protection comes first.
🎯 Profit Objective
Target Zone: 0.66900
📍 Area of strong resistance + overbought conditions + potential liquidity trap
➡️ Partial profits advised as price approaches resistance.
📝 Note: TP levels are optional. Lock profits based on your execution plan.
🔗 Related Pairs to Watch (Correlation Guide)
💵 TVC:DXY (U.S. Dollar Index)
📉 Inverse correlation
Weakening USD generally supports AUD/USD upside
Watch for rejection or breakdown in TVC:DXY for bullish confirmation
🇦🇺 AUD/JPY
📈 Risk-On Barometer
Strength in AUD/JPY often confirms bullish AUD momentum
Yen weakness + AUD strength = confirmation signal
🇦🇺 AUD/NZD
⚖️ Regional Strength Gauge
AUD outperforming NZD adds confidence to Aussie demand
Flat or rising structure supports AUD/USD bias
XAU/USD (Gold)
🔄 Commodity Correlation
AUD is commodity-linked
Gold strength often aligns with AUD inflows during USD softness
📊 Key Takeaways
✅ Bullish bias with layered execution
✅ Clear invalidation level
✅ Profit zone aligned with resistance & momentum exhaustion
✅ Confirmation through correlated AUD & USD instruments
💬 If this idea adds value, support with a 👍 and share your execution thoughts below.
Trade smart. Protect capital. Let the market pay you.

AUDUSD Price Action Near Descending Trendline – 4H OutlookAUDUSD 4H – Price Testing Key Descending Channel Resistance
Symbol: AUDUSD
Timeframe: 4H
Trend: Sideways to Bearish
Indicators: SMA 9 & SMA 20, Descending Channel
📉 Market Structure Analysis
AUDUSD has been trading inside a descending channel since September. Price recently bounced from the lower channel support and is now approaching the upper channel resistance zone around 0.6620–0.6650.
Despite the recent bullish push, price is failing to break and sustain above the descending resistance, indicating weak buying momentum at higher levels.
The 9 & 20 SMA are closely aligned, suggesting indecision and a possible rejection from resistance.
📌 Key Levels
Resistance: 0.6620 – 0.6650 (Descending channel top)
Support 1: 0.6500
Support 2: 0.6400
Channel Breakdown Target: 0.6300
📊 Trade Scenarios
🔴 Bearish Scenario (Preferred):
If price shows rejection near the channel resistance, a short setup is possible with targets back toward 0.6500 and 0.6400.
🟢 Bullish Scenario:
A strong 4H close above 0.6650 with volume could invalidate the channel and open upside toward 0.6750 – 0.6800.
⚠️ Conclusion
AUDUSD remains technically weak below descending resistance. Traders should wait for clear rejection or confirmed breakout before entering positions.
Always manage risk and wait for confirmation.
🔔 Like, comment & follow for more Forex analysis!

BUY AUDUSD nowAUDUSD was in a recent downtrend for the last few weeks and struggled to stay bullish, but recently it has just broken a strong resistance trend line which it tested several times and failed to break through. AUDUSD is very likely to hit the next major resistance zone which is market as the "TAKE PROFIT" LEVEL. There are many clear signs of new bullish movements. BUY AUDUSD now - great time to buy AUDUSD now

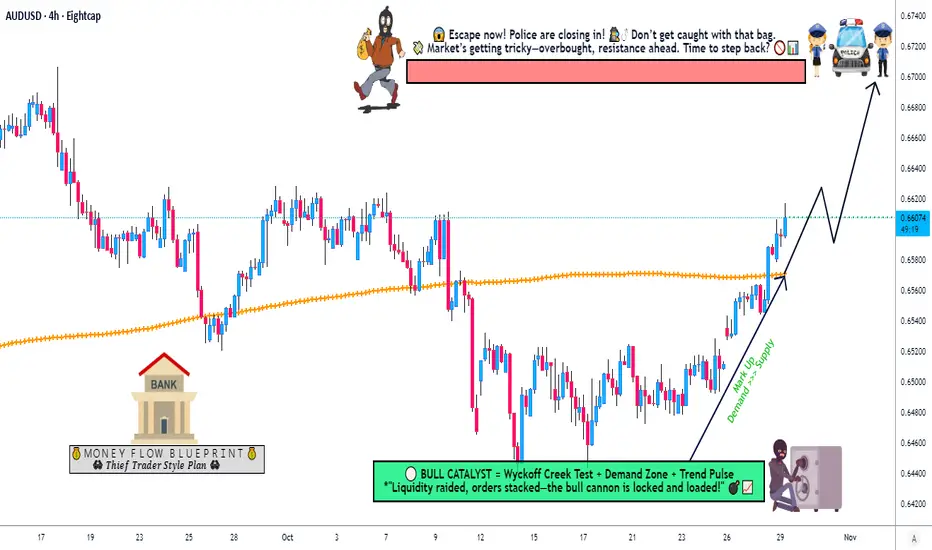
Is the Aussie Dollar Ready for a Strong Upside Push?🎯 AUD/USD: The Great Heist Setup | 200 SMA Breakout in Play! 💰
📊 Market Overview
The Aussie Dollar is making moves, ladies and gents! We've got a confirmed bullish breakout above the 200 Simple Moving Average — and you know what that means... it's time to plan our strategic entry! 🚀
🎭 The "Thief Strategy" Breakdown
🔍 Asset Analysis
Pair: AUD/USD (Aussie Dollar vs. US Dollar)
Market Type: Forex
Trade Style: Swing/Day Trade
Setup: Capital Flow Blueprint
📈 Technical Outlook
✅ Bullish bias confirmed with price breaking and holding above the 200 SMA
✅ Momentum building as buyers step in
✅ Higher timeframe structure supporting upside potential
🎯 Entry Strategy: "The Layering Heist"
The Thief Strategy uses multiple limit orders (layering technique) to scale into positions like a pro! Here's the blueprint:
💎 Multi-Layer Entry Zones:
Layer 1: 0.65400
Layer 2: 0.65600
Layer 3: 0.64800
Layer 4: 0.66000
Note: You can add more layers based on your capital allocation and risk appetite. Scale in smart, scale out smarter! 😎
🛡️ Risk Management
⛔ Stop Loss: 0.65200
Disclaimer: This is the Thief's SL level for reference. However, OG Thieves — set your own stop loss based on YOUR risk tolerance. Your capital, your rules! 🎲
🎯 Take Profit Target: 0.67000
Why 0.67000? This level acts as:
🚧 Strong resistance zone ("Police Barricade")
📊 Potential overbought territory
Historical trap zone — secure profits before the reversal!
Disclaimer: This is a suggested TP level. Trail your stops, scale out partially, or set your own target. Take money when you make money — it's your game! 💵
🔗 Correlated Pairs to Watch
Keep an eye on these related markets for confluence:
OANDA:NZDUSD — Commodity currency cousin, often moves in tandem with AUD
OANDA:AUDJPY — Risk-on sentiment gauge
OANDA:AUDCAD — Inter-commodity pair correlation
USD Index ( TVC:DXY ) — Inverse correlation with AUD/USD
Gold ( OANDA:XAUUSD ) — Aussie correlates with gold due to mining exports
💡 Pro Tip: If USD weakens broadly and gold rallies, AUD/USD typically benefits!
🔑 Key Points Summary
✨ Bullish breakout above 200 SMA = momentum shift
✨ Layering strategy allows better average entry price
✨ Risk-to-reward favors bulls with clear targets
✨ Watch DXY weakness and gold strength for confirmation
✨ Resistance at 0.67000 — bank profits before reversal zones!
✨ If you find value in my analysis, a 👍 and 🚀 boost is much appreciated — it helps me share more setups with the community!
#AUDUSD #ForexTrading #SwingTrading #DayTrading #ThiefStrategy #200SMA #Breakout #TechnicalAnalysis #ForexSignals #AussieDollar #LayeringStrategy #RiskManagement #ForexSetup #TradingIdeas #PriceAction
#AUDUSD: Accumulated Completed Now Time For DistributionThe AUD/USD currency pair has been quite active lately. It has moved from a period of buying to an early selling phase. This analysis looks at the market, how prices are moving, technical tools and what might happen when trading, keeping an eye on how to manage risk.
1. Market Overview
The Australian Dollar (AUD) has become stronger against the US Dollar (USD). After a long period of little change, the price action seems to be changing. The bulls are still in charge, with a target swing at 0.7050, which could be a 400-pip move from where they were accumulating.
In terms of the economy, AUD’s strength is supported by stable commodity prices and a positive outlook for Australia. The USD is feeling a bit uncertain because people are speculating about what the Federal Reserve will do next and how much risk people are willing to take around the world.
Price Action Structure:
Accumulation Phase:
The pair stayed around the 0.6650 – 0.6750 range, which showed that big investors were buying. This usually happens before a big move, which we saw on both daily and H4 charts.
Breakout and Shift to Distribution:
Recently, the price broke above the main resistance near 0.6800, which means it is going up. This confirms that the accumulation phase was right and that the market is set up for buyers. The next step is to move into the distribution phase, where prices are aiming for higher targets and testing the upper resistance zones before any possible reversal.
Swing Targets:
The main focus is on 0.7050, a spot where the price has reacted quite strongly before. For smaller gains, we have intermediate targets at 0.6920 and 0.6990. This move could be worth about 400 pips, which is a good chance for traders who are careful.
Fibonacci Retracement Levels:
A Fibonacci projection hints at possible targets around 0.6990 (which is a 1.618 extension) and 0.7050 (which is a 2.0 extension), which helps us stick to our price targets.
- First target: 0.6920 (this is where resistance is)
- Second target: 0.6990 (this is where Fibonacci levels meet)
- Final swing target: 0.7050 (this is a big supply zone)
The way people feel about the market can help us decide when to buy or sell. Smart money got in during the time when prices were building up, but they weren’t sure what to do. When the price broke out, it showed that more people were feeling bullish, and retail traders were joining in. The last part of the move towards 0.7050 will probably get more momentum traders before the price goes into a new pattern and might reverse.
Things like how well commodities are doing and what people expect the US interest rate to be will affect the pair. If people suddenly change their minds about risk, the price could get really volatile, so it’s important to keep an eye on news.
The AUD/USD pair has moved from a time when prices were building up to a bullish breakout, which means we might see a 400-pip move with a main target at 0.7050. The intermediate targets at 0.6920 and 0.6990 are good places to think about taking some profits. Looking at things like moving averages, RSI and Fibonacci levels, we can see that this is a good time to be bullish.
Traders should be careful with their risk, avoid using too much leverage and stay alert to important economic events that could change the price. By sticking to a plan and being disciplined, they can make the most of this good situation in the forex market.
Team Setupsfx_

AUDUSD Bullish Trend Continuation From Marked Support ZonesH4 - Bullish Trend in play
Two Solid Support Levels
Trend continuation very likely after pullback.

AUDUSD Short Term Buy IdeaH4 - Strong bullish move.
Currently it looks like a pullback is happening.
Until the two Fibonacci support zones hold I expect the price to move higher further.
If you enjoy this idea, don’t forget to LIKE 👍, FOLLOW ✅, SHARE 🙌, and COMMENT ✍! Drop your thoughts and charts below to keep the discussion going. Your support helps keep this content free and reach more people! 🚀
--------------------------------------------------------------------------------------------------------

AUDUSD FRGNT DAILY FORECAST - Q4 | W50 | D10 | Y25 |📅 Q4 | W50 | D10 | Y25 |
📊 AUDUSD FRGNT DAILY FORECAST
🔍 Analysis Approach:
I’m applying Smart Money Concepts, focusing on:
Identifying Points of Interest on the Higher Time Frames (HTFs) 🕰️
Using those POIs to define a clear trading range 📐
Refining those zones on Lower Time Frames (LTFs) 🔎
Waiting for a Break of Structure (BoS) for confirmation ✅
This method allows me to stay precise, disciplined, and aligned with the market narrative, rather than chasing price.
💡 My Motto:
"Capital management, discipline, and consistency in your trading edge."
A positive risk-to-reward ratio, paired with a high win rate, is the backbone of any solid trading plan 📈🔐
⚠️ Losses?
They’re part of the mathematical game of trading 🎲
They don’t define you — they’re necessary, they happen, and we move forward 📊➡️
🙏 I appreciate you taking the time to review my Daily Forecast.
Stay sharp, stay consistent, and protect your capital
— FRNGT 🚀
FX:AUDUSD

AUDUSD Short From Resistance!
HI,Traders !
#AUDUSD is going up but
Will soon hit a horizontal
Resistance level of 0.66126
From where a local bearish
Pullback is to be expected !
Comment and subscribe to help us grow !

AUDUSD: Wait Until The Pullback Ends Before Selling!Welcome back to the Weekly Forex Forecast for the week of Dec. 1-5th.
In this video, we will analyze the following FX market: AUDUSD
AUDUSD had a surprisingly strong week. The weekly candle closed above the previous candle. This would indicate some follow through towards last week's high.
But... it is in a pullback on the HTFs, and could turn over mid to late week, towards the downside.
Wait for the market structure shift before entering new trades.
I'm sticking with the overall trend down until the market shifts the other way.
Enjoy!
May profits be upon you.
Leave any questions or comments in the comment section.
I appreciate any feedback from my viewers!
Like and/or subscribe if you want more accurate analysis.
Thank you so much!
Disclaimer:
I do not provide personal investment advice and I am not a qualified licensed investment advisor.
All information found here, including any ideas, opinions, views, predictions, forecasts, commentaries, suggestions, expressed or implied herein, are for informational, entertainment or educational purposes only and should not be construed as personal investment advice. While the information provided is believed to be accurate, it may include errors or inaccuracies.
I will not and cannot be held liable for any actions you take as a result of anything you read here.
Conduct your own due diligence, or consult a licensed financial advisor or broker before making any and all investment decisions. Any investments, trades, speculations, or decisions made on the basis of any information found on this channel, expressed or implied herein, are committed at your own risk, financial or otherwise.

AUDUSD Bearish Bias!
HI,Traders !
#AUDUSD is making a
Retest of the horizontal
Resistance of 0.64759
So as we are locally
Bearish biased we will
Be expecting a further
Bearish move down !
Comment and subscribe to help us grow !

AUDUSD Idea 23.11.2025For audusd I am approaching the set sfp level which could probably be at a price of 0.64, then I would put a possible long below the next low that the market gives us or at least a local low, if I were to consider a short then at a level around the monthly level at a price of 0.663 where the price could be surprised but I would wait for a reaction at a level around the golden pocket level of 0.660

AUDUSD FRGNT Daily Forecast - Q4 | W47| D19 | Y25 |📅 Q4 | W47| D19 | Y25 |
📊 AUDUSD FRGNT Daily Forecast
🔍 Analysis Approach:
I’m applying Smart Money Concepts, focusing on:
Identifying Points of Interest on the Higher Time Frames (HTFs) 🕰️
Using those POIs to define a clear trading range 📐
Refining those zones on Lower Time Frames (LTFs) 🔎
Waiting for a Break of Structure (BoS) for confirmation ✅
This method allows me to stay precise, disciplined, and aligned with the market narrative, rather than chasing price.
💡 My Motto:
"Capital management, discipline, and consistency in your trading edge."
A positive risk-to-reward ratio, paired with a high win rate, is the backbone of any solid trading plan 📈🔐
⚠️ Losses?
They’re part of the mathematical game of trading 🎲
They don’t define you — they’re necessary, they happen, and we move forward 📊➡️
🙏 I appreciate you taking the time to review my Daily Forecast.
Stay sharp, stay consistent, and protect your capital
— FRNGT 🚀
OANDA:AUDUSD

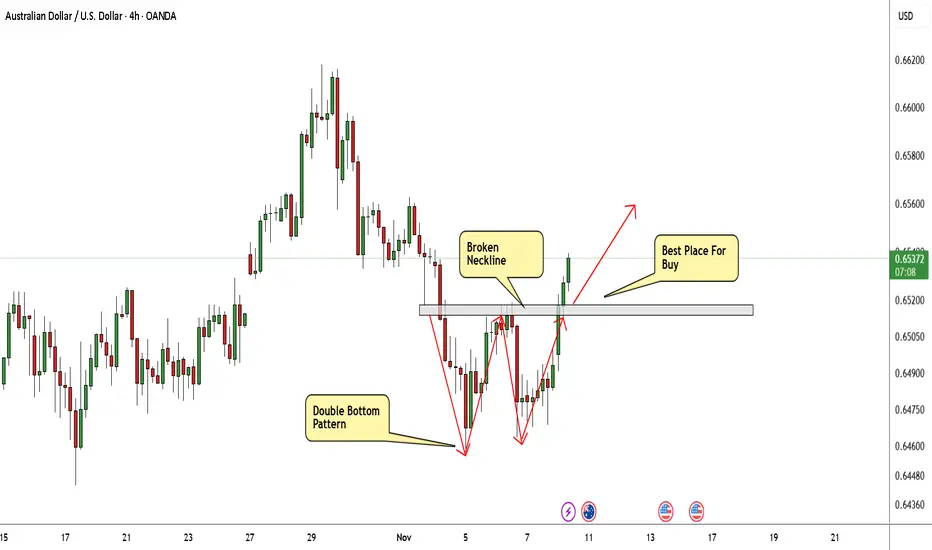
AUD/USD Made Clear Reversal Pattern,Long Setup To Get 150 Pips !Here is my 4H Chart On AUD/USD , The price creating a very clear reversal pattern ( Double Bottom Reversal Pattern ) and the price made a very good bullish price action now And the price confirmed the pattern by closing above the neckline. so we can enter a buy trade when the price go back to retest the broken neckline to can use a small stop loss , or we can enter now if you are aggressive trader but the stop loss will be bigger , and we can targeting from 50 to 100 pips with a decent stop loss .
Reasons To Enter :
1- Perfect Touch For The Area .
2- Clear Bullish Price Action .
3- Bigger T.F Giving Good Bullish P.A .
4- Clear Reversal Pattern .
5- Pattern Confirmed .
AUDUSD: Neutral View First Buy and Then Sell! Hey everyone!
Our first buy swing entry is going swimmingly! We’ve got over 500 pips running positively, and we reckon price can keep going up and then when it hits our selling zone, you can swing sell too. This is a fantastic opportunity where we can wait for price to do its thing and then when it reaches the sell zone, we can execute our order. But if you’re feeling adventurous and want to take a bit of a risk, you can take a buy entry at the given point and keep it up until it reaches our sell area.
With just one shot, we can make two entries!
Good luck and trade safely!
Thanks a bunch for your unwavering support! 😊
If you’d like to lend a hand, here are a few ways you can contribute:
- Like our ideas
- Comment on our ideas
- Share our ideas
Cheers,
Team Setupsfx_
❤️🚀

AUDUSD FRGNT Daily Forecast 3% BREAKDOWN ! -Q4 | W46 | D10 | Y25📅 Q4 | W46 | D10 | Y25 |
📊 AUDUSD FRGNT Daily Forecast 3% BREAKDOWN !
🔍 Analysis Approach:
I’m applying Smart Money Concepts, focusing on:
Identifying Points of Interest on the Higher Time Frames (HTFs) 🕰️
Using those POIs to define a clear trading range 📐
Refining those zones on Lower Time Frames (LTFs) 🔎
Waiting for a Break of Structure (BoS) for confirmation ✅
This method allows me to stay precise, disciplined, and aligned with the market narrative, rather than chasing price.
💡 My Motto:
"Capital management, discipline, and consistency in your trading edge."
A positive risk-to-reward ratio, paired with a high win rate, is the backbone of any solid trading plan 📈🔐
⚠️ Losses?
They’re part of the mathematical game of trading 🎲
They don’t define you — they’re necessary, they happen, and we move forward 📊➡️
🙏 I appreciate you taking the time to review my Daily Forecast.
Stay sharp, stay consistent, and protect your capital
— FRNGT 🚀
OANDA:AUDUSD

AUD/USD) Bearish trend analysis Read The captionSMC Trading point update
Technical analysis of AUD/USD (Australian Dollar / U.S. Dollar) – Bearish Continuation Setup
Timeframe: 1H (IC Markets)
Concepts: Smart Money Concepts (SMC), Market Structure, Fair Value Gap (FVG), EMA Confluence
---
Market Structure Overview
The overall structure remains bearish, forming lower highs and lower lows.
Price is trading within a descending channel, respecting both upper and lower trendlines.
The recent impulsive bearish leg suggests continuation after a corrective retracement.
---
Key Technical Zones
Retracement Zone (Sell Area):
0.5 – 0.79 Fibonacci levels mark the premium short zone.
Overlaps with a Fair Value Gap (FVG) and supply area, making it a strong potential sell zone.
Zone: 0.6520 – 0.6540
EMA Confluence:
EMA-50 ≈ 0.6528
EMA-200 ≈ 0.6540
Both EMAs are positioned near the FVG zone, confirming dynamic resistance.
---
Scenario Plan
1. Expect a short-term retracement toward the 0.652–0.654 region.
2. Look for bearish rejection or lower-timeframe BOS confirmation within the zone.
3. Anticipate continuation to the lower channel boundary, aligning with target point 0.6458.
---
Targets
Next Reaction Zone: 0.6500 (intermediate liquidity area)
Final Bearish Target: 0.6458 – marked on chart as the target point
Mr SMC Trading point
---
Bias:
> Bearish – Structure, EMAs, and FVG confluence all favor a downside continuation after a corrective pullback.
---
please support boost 🚀 this analysis

AUDUSD FRGNT Daily Forecast - Q4 | W44 | D31| Y25 |📅 Q4 | W44 | D31| Y25 |
📊 AUDUSD FRGNT Daily Forecast
🔍 Analysis Approach:
I’m applying Smart Money Concepts, focusing on:
Identifying Points of Interest on the Higher Time Frames (HTFs) 🕰️
Using those POIs to define a clear trading range 📐
Refining those zones on Lower Time Frames (LTFs) 🔎
Waiting for a Break of Structure (BoS) for confirmation ✅
This method allows me to stay precise, disciplined, and aligned with the market narrative, rather than chasing price.
💡 My Motto:
"Capital management, discipline, and consistency in your trading edge."
A positive risk-to-reward ratio, paired with a high win rate, is the backbone of any solid trading plan 📈🔐
⚠️ Losses?
They’re part of the mathematical game of trading 🎲
They don’t define you — they’re necessary, they happen, and we move forward 📊➡️
🙏 I appreciate you taking the time to review my Daily Forecast.
Stay sharp, stay consistent, and protect your capital
— FRNGT 🚀
OANDA:AUDUSD

AUDUSD potential move in short term Had test of OB and trend shift on LTF, ptentially move to take buyside liqudity

AUDUSD Trade Plan - Waiting for a Pullback & Structure Break.The AUDUSD has officially broken structure to the upside, signaling bullish momentum ✅.
I’m currently waiting for price to retrace back into equilibrium within the previous swing range before considering any long positions—price is overextended at current levels and chasing here wouldn’t be smart ⚖️📉.
Patience is key as I wait for premium liquidity zones to be tapped for a high-probability entry setup 🎯.
⚠️ Disclaimer: This is market analysis and not financial advice.
AUDUSD Trade Plan - Waiting for a Pullback & Structure Break.

AUDUSD FRGNT Daily Forecast -Q4 | W43 | D24| Y25 |📅 Q4 | W43 | D24| Y25 |
📊 AUDUSD FRGNT Daily Forecast
🔍 Analysis Approach:
I’m applying Smart Money Concepts, focusing on:
Identifying Points of Interest on the Higher Time Frames (HTFs) 🕰️
Using those POIs to define a clear trading range 📐
Refining those zones on Lower Time Frames (LTFs) 🔎
Waiting for a Break of Structure (BoS) for confirmation ✅
This method allows me to stay precise, disciplined, and aligned with the market narrative, rather than chasing price.
💡 My Motto:
"Capital management, discipline, and consistency in your trading edge."
A positive risk-to-reward ratio, paired with a high win rate, is the backbone of any solid trading plan 📈🔐
⚠️ Losses?
They’re part of the mathematical game of trading 🎲
They don’t define you — they’re necessary, they happen, and we move forward 📊➡️
🙏 I appreciate you taking the time to review my Daily Forecast.
Stay sharp, stay consistent, and protect your capital
— FRNGT 🚀
OANDA:AUDUSD
