AUDUSD | Demand from previous resistance area. Uptrend?When it comes to the technical analysis of AUDUSD , based on the current market structure, market clearly shows the signs of uptrend. I have marked previous resistance areas and used trend line to find the appropriate support area, where we seen as strong rejection and demand. And I’m not seeing enough resistance till target T1.That means there is a good chance we might get a good impulse to the upside. If you are going in, make sure to place the stop just below the demand zone. If any chance the price breaks the R1, which is also Target T1, you can keep the long position while placing the stop loss below the R1 line.
What do you think is more likely to happen? Please share your thoughts in comment section. And also give a thumbs up if you find this idea helpful. Any feedback & suggestions would help in further improving the analysis.
If you find this technical analysis useful, please like & share our ideas with the community.
Good Luck!
Disclaimer!
This post does not provide financial advice. It is for educational purposes only! You can use the information from the post to make your own trading plan for the market. But you must do your own research and use it as the priority. Trading is risky, and it is not suitable for everyone. Only you can be responsible for your trading.
Audusdlongsetup

AUDUSD - Daily - Bullish reversal is here - targeting 0.68Audusd - Daily - Bullish reversal is here.. expecting a strong rally upto 0.68 which is a major monthly supply zone

AUDUSD RE-ENTRY R:R 1:18This is for Long Term
And this is risky too.
Enter form the Marked Area.
Please DYOR before entering the trade.

AUDUSD Will it Raise?This is for short term
And this is risky too.
Please DYOR before entering the trade.

audusd ready to bullish audusd break the trend line with impulse we expect market start reversal...high curve supply is our target

AUDUSD Potential Long!AUD-USD was trading below a falling resistance
But now we are seeing a bullish breakout
And a retest of the broken line
Which is now a support AT 0.68610
From where price growth is to be expected

AUDUSD - CURRENT SITUATION AND FUNDA & TECHNICAL BIAS#AUDUSD
- According to the analysis we gave the previous day, the AUDUSD UP SIDE WAVE has been UP about 140++ PIPS. We hope you get it anyway. It is still moving UP SIDE as we provided.
- Currently the MARKET SENTIMENT for AUD is on the UP SIDE. But because RISK is ON for AUDUSD, there is currently an UPSIDE BIAS for it. The main reason for that is that STOCKS and COMMODITIES MARKETS are slightly UP due to MARKET RISK being ON. It is heavily influenced by the Australian dollar.
- It is definitely possible to break the AUDUSD STRUCTURE and go up to the higher RESISTANCE LEVEL. The reason for that is because there is a good UP SIDE BIAS in the MARKET for USD. Accordingly, AUDUSD can rise up to the level of 0.7042. And after that, AUDUSD can SELL to the 0.6670 LEVEL if the MARKET SENTIMENT changes and STOCKS and COMMODITIES start going UP. audusd

AUDUSD LONGOANDA:AUDUSD
AUDUSD broke bearish structure, made a retest at a support
level. Anticipating a bullish move on AUDUSD for the entire
week.

AUDUSD Long Trade SetupA bullish opportunity recently presented itself on the aussie-dollar trading chart. This follows from the bullish engulfing candlestick pattern which printed just above the 0.66800 psychological level. A stop loss below the same psychological level and a profit target anywhere between your entry and the swing high of 0.71403 could give you a reward-to-risk ratio as high as 5 or even higher. Be sure to size your position based on your trading account balance and apply other risk management measures before placing trades.
Rooting for you!
Your FX Plug
FX:AUDUSD


AUD/USD Potential Buy Opportunity - London SessionI will be looking for AUD/USD Buys if price can come into this area in the london session with bullish confirmation.
I will not be going over the technical reasons for the trade.


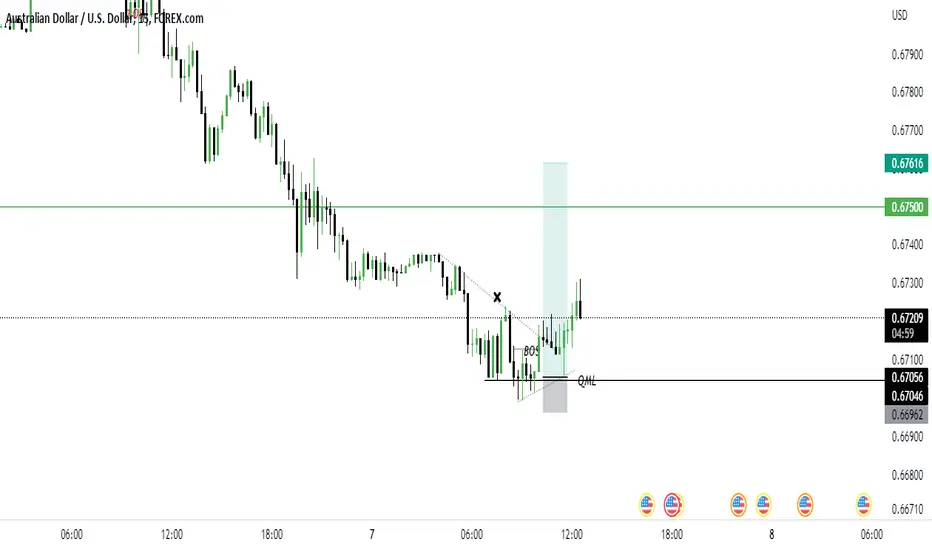
AUDUSD Chart H1Here is my view for AUDUSD on H1. The price could go up, you can put a pending order on the Order block or find an entry on LTF within OB Zone. Trade Safe!

AUDUSD on the Fast Track to UP Side LiquidityFrom this view AUDUSD should buy up all week into her ADR.
The DXY is falling which will cause AUDUSD to rise.
Long set ups should be plenty this week on this pair if the DXY continues to drop.
As always never over leverage.
Trust your trade set up.
Be patient.
Have Fun!

AUDUSD Bullish for 0.7305 & 0.7430#audusd, 13th May Inside bar confined range within the range of the previous bar. 16th May Insurance bar closed off the high dictated strength ahead. Long with half risk CMP, use remaining half dip down 0.7070 area with stop loss 0.6980. Initial target 0.7305 (partially may close). Next target: 0.7430

AUD/USD Bullishwe can continue buying in case price pullback near to support until we have a good entry

AUDUSD D TF OVERVIEWwatch all my related ideas
.
.
.
.
.
.
🧅Disclaimer :There are risks associated with investing in securities. Investing in stocks, bonds, exchange traded funds, mutual funds, and money market funds involve risk of loss. Loss of principal is possible. Some high risk investments may use leverage, which will accentuate gains & losses. Foreign investing involves special risks, including a greater volatility and political, economic and currency risks and differences in accounting methods. This is Not Financial Advice
🧅JUST AN OPINION OF THE ONION.🧅

AUD/USD full analysisshort term
the price will fall 120 pips, then it will meet the current strong support at level 0.69600. When this level is respected and the rejection is seen, we will take a buy postion to take 150 pips until reaching the horizontal resistance and the dynamic monthly resistance at the level 0.70900
long-term
when the level 0.69600 is reached, in event of a break below it with closing daily candle, will seel more fall, and we will update the targets in another analysis in the case with rise and reaching the other level 0.70900 When rejected, it will be the beginning to sell, if its break and stability above it by closing a daily candle , this will be our opportunity to buy. We have nothing but to take small targets now and monitor the mentioned pivotal prices

AUD/USD BuysThe higher timeframes indicate a bullish nature on this particular pair
The most recent support regions on the smaller timeframes have successfully held with some consolidation becoming apparent prior to Asian open
Price attempted to break support again and failed. This justified a buy position in the form of a buy stop in order to confirm momentum before entering.
To gauge an early entry (due to the large candle sizes), I used the 15min timeframe.
Targets are set at the previous highs where we have seen low traffic movement
If history is to repeat itself, these previous resistance levels should be achieved again.

AUDUSD SHORT IDEA Hello Traders,
Hope you are having a profitable week.
AUDUSD is overall bearish according to our analysis. I will be taking a short at current price
However, the USD has a lot of fundamentals coming up over New York session today which might result in increased trading volume.
Risking less on this trade.
Wishing you all a profitable week ahead.
Best wishes,
ETGL TEAM 💛

AUDUSD - Daily Trade Idea - 1-Feb-22AUDUSD (LONG)- If all the support holds in place.
If we see the Support broken out then we could see the shift in the trend.
I marked the TP 1, TP 2 , TP 3 and EXIT (SL) on the chart.
(THIS IDEAS VALID NEXT 24 HOURS)
