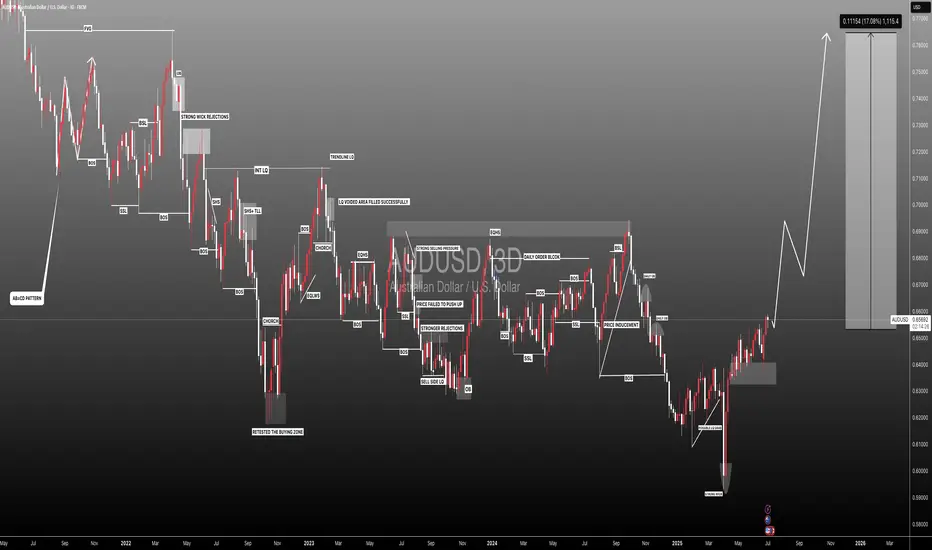
AUDUSD | FRGNT WEEKLY FORECAST | Q1 | W5 | Y26📅 Q1 | W5 | Y26
📊 AUDUSD— FRGNT WEEKLY FORECAST
🔍 Analysis Approach
I’m applying a developed version of Smart Money Concepts, with a structured focus on:
• Identifying Key Points of Interest (POIs) on Higher Time Frames (HTFs) 🕰️
• Using those POIs to define a clear and controlled trading range 📐
• Refining those zones on Lower Time Frames (LTFs) 🔎
• Waiting for a Break of Structure (BoS) as confirmation ✅
This process keeps me precise, disciplined, and aligned with market narrative, rather than reacting emotionally or chasing price.
💡 My Motto
“Capital management, discipline, and consistency in your trading edge.”
A positive risk-to-reward ratio, combined with a high-probability execution model, is the backbone of any sustainable trading plan 📈🔐
⚠️ On Losses
Losses are part of the mathematical reality of trading 🎲
They don’t define you — they are necessary, expected, and managed.
We acknowledge them, learn, and move forward 📊➡️
🙏 I appreciate you taking the time to review my Daily Forecast.
Further context and supporting material can be found in the Links section.
Stay sharp 🧠
Stay consistent 🎯
Protect your capital 🔐
— FRGNT 🚀📈
FX:AUDUSD
Audusdsignal

AUD/USD - A QUICK SELL SET UP - 30-01-2026AUDUSD - G-Money's short version analysis based purely on technical analysis only, no nonsense or "BS". I do totally ignore any fundamental analysis, technical analysis only
AUDUSD - still kinda on the "move" and continue DOWN...
Who did enter this trade earlier congratulations! Who missed it... See you next time! ;)
Chart is itself explaining. Kept a "KISS" approach all the way ( "Keep It Simple, Stupid") & beginners friendly... ;)
I do hope that nobody ignoring SL ( Stop Loss) ! Without it, It is a fastest way to loose hard earned money...
;)
Trade safe & don't do "gambling". In the end it never pays, not worth it to risk loose all your $...
PS: above technical analysis is done for the community & educational purpose only! It is not a financial advice. Just share my very own insight to it.

#AUDUSD:We are yet to see weaken USD! AUDUSD to make yearly highAUDUSD hasn’t seen strong bullish volume yet, but tomorrow’s NFP will be crucial for determining the future trend of the AUDUSD. Based on your analysis, you can set multiple targets.
If you like our work and want to support us, you can do so by following us:
-Liking our ideas
-Commenting on our ideas
-Sharing
Team Setupsfx_
❤️🚀

#AUDUSD: Three Swing Target Accumulating Total of 1400+ Pips! Analysing the AUDUSD currency pair on a broader timeframe of three days reveals a bearish trend. This suggests a potential final decline in prices before a significant bullish surge in the market.
Two golden lines are drawn around the entry area, indicating potential entry points at the first, second, or intersection of these lines. Alternatively, the first and second lines can serve as entry and stop loss points, tailored to your trading strategy.
Additionally, important economic indicators are set to impact the market. For instance, the Non-Farm Payrolls (NFP) report scheduled for this coming Friday will significantly influence the direction of the DXY monthly price.
If you find our analysis valuable, please consider liking and commenting on our ideas. Your feedback will be instrumental in our efforts to provide more detailed and insightful analysis.
Much Love and Gratitude for your support in advance, happy to help.❤️🚀
Team Setupsfx_

#AUDUSD: +1100 Pips Possible Swing Bullish Move! AUDUSD a strong sign of bullish behaviour has appeared alongside bullish momentum. As we have NFP tomorrow, we expect market to remain volatile; what we think now is to have market settled down before we can have any confirmation. We recommend to remain extra cautious tomorrow, once market get settled we can then enter with accurate risk management.
Like, comment and Share for more!
Team Setupsfx_
AUDUSD: Neutral View First Buy and Then Sell! Hey everyone!
Our first buy swing entry is going swimmingly! We’ve got over 500 pips running positively, and we reckon price can keep going up and then when it hits our selling zone, you can swing sell too. This is a fantastic opportunity where we can wait for price to do its thing and then when it reaches the sell zone, we can execute our order. But if you’re feeling adventurous and want to take a bit of a risk, you can take a buy entry at the given point and keep it up until it reaches our sell area.
With just one shot, we can make two entries!
Good luck and trade safely!
Thanks a bunch for your unwavering support! 😊
If you’d like to lend a hand, here are a few ways you can contribute:
- Like our ideas
- Comment on our ideas
- Share our ideas
Cheers,
Team Setupsfx_
❤️🚀

#AUD/USD Sell Trade Scenario.Here’s an up-to-date AUD/USD Sell trade outlook (technical + fundamental) to help you assess whether positioning for a Downside makes sense right now.
Thank You......

#AUDUSD: Accumulated Completed Now Time For DistributionThe AUD/USD currency pair has been quite active lately. It has moved from a period of buying to an early selling phase. This analysis looks at the market, how prices are moving, technical tools and what might happen when trading, keeping an eye on how to manage risk.
1. Market Overview
The Australian Dollar (AUD) has become stronger against the US Dollar (USD). After a long period of little change, the price action seems to be changing. The bulls are still in charge, with a target swing at 0.7050, which could be a 400-pip move from where they were accumulating.
In terms of the economy, AUD’s strength is supported by stable commodity prices and a positive outlook for Australia. The USD is feeling a bit uncertain because people are speculating about what the Federal Reserve will do next and how much risk people are willing to take around the world.
Price Action Structure:
Accumulation Phase:
The pair stayed around the 0.6650 – 0.6750 range, which showed that big investors were buying. This usually happens before a big move, which we saw on both daily and H4 charts.
Breakout and Shift to Distribution:
Recently, the price broke above the main resistance near 0.6800, which means it is going up. This confirms that the accumulation phase was right and that the market is set up for buyers. The next step is to move into the distribution phase, where prices are aiming for higher targets and testing the upper resistance zones before any possible reversal.
Swing Targets:
The main focus is on 0.7050, a spot where the price has reacted quite strongly before. For smaller gains, we have intermediate targets at 0.6920 and 0.6990. This move could be worth about 400 pips, which is a good chance for traders who are careful.
Fibonacci Retracement Levels:
A Fibonacci projection hints at possible targets around 0.6990 (which is a 1.618 extension) and 0.7050 (which is a 2.0 extension), which helps us stick to our price targets.
- First target: 0.6920 (this is where resistance is)
- Second target: 0.6990 (this is where Fibonacci levels meet)
- Final swing target: 0.7050 (this is a big supply zone)
The way people feel about the market can help us decide when to buy or sell. Smart money got in during the time when prices were building up, but they weren’t sure what to do. When the price broke out, it showed that more people were feeling bullish, and retail traders were joining in. The last part of the move towards 0.7050 will probably get more momentum traders before the price goes into a new pattern and might reverse.
Things like how well commodities are doing and what people expect the US interest rate to be will affect the pair. If people suddenly change their minds about risk, the price could get really volatile, so it’s important to keep an eye on news.
The AUD/USD pair has moved from a time when prices were building up to a bullish breakout, which means we might see a 400-pip move with a main target at 0.7050. The intermediate targets at 0.6920 and 0.6990 are good places to think about taking some profits. Looking at things like moving averages, RSI and Fibonacci levels, we can see that this is a good time to be bullish.
Traders should be careful with their risk, avoid using too much leverage and stay alert to important economic events that could change the price. By sticking to a plan and being disciplined, they can make the most of this good situation in the forex market.
Team Setupsfx_

Buy AUDUSD nowAUDUSD was in a recent downtrend for the last few weeks and struggled to stay bullish, but recently it has just broken a strong resistance trend line which it tested several times and failed to break through. AUDUSD is very likely to hit the next major resistance zone which is market as the "TAKE PROFIT" LEVEL. There are many clear signs of new bullish movements. BUY AUDUSD now

AUDUSD — FRGNT DAILY CHART FORECAST. Q1 | W4 | D26| Y26📅 Q1 | W4 | D26| Y26
📊 AUDUSD — FRGNT DAILY CHART FORECAST
🔍 Analysis Approach
I’m applying a developed version of Smart Money Concepts, with a structured focus on:
• Identifying Key Points of Interest (POIs) on Higher Time Frames (HTFs) 🕰️
• Using those POIs to define a clear and controlled trading range 📐
• Refining those zones on Lower Time Frames (LTFs) 🔎
• Waiting for a Break of Structure (BoS) as confirmation ✅
This process keeps me precise, disciplined, and aligned with market narrative, rather than reacting emotionally or chasing price.
💡 My Motto
“Capital management, discipline, and consistency in your trading edge.”
A positive risk-to-reward ratio, combined with a high-probability execution model, is the backbone of any sustainable trading plan 📈🔐
⚠️ On Losses
Losses are part of the mathematical reality of trading 🎲
They don’t define you — they are necessary, expected, and managed.
We acknowledge them, learn, and move forward 📊➡️
🙏 I appreciate you taking the time to review my Daily Forecast.
Further context and supporting material can be found in the Links section.
Stay sharp 🧠
Stay consistent 🎯
Protect your capital 🔐
— FRGNT 🚀📈
FX:AUDUSD

AUDUSD Technical Analysis and Trade IdeaHi all. My bias remains bullish on the AUDUSD 🐂, but patience is the name of the game today. Fundamentally, the Aussie is ripping on the back of that monster jobs print (unemployment down to 4.1%!), which has traders aggressively pricing in an RBA hike for February. Combine that with the "Tariff Truce" relief rally crushing the USD, and we have a perfect storm for upside 🌪️. Technically, the 4H structure is flagging beautifully at the highs, but we need to be smart about our entry.
I am not chasing price at the highs 🚫 — I want to see the market flush the weak hands down to our discount zone. We are looking for an optimal entry around 0.6765 – 0.6785 to catch the next leg up. This trade is invalidated if we lose the 0.6715 structural pivot 🛑.
If the trade sets up, aim for a 5R return to start 🎯. Look to close partial profits (50%) at 1R 💰, then let the rest run using our indicator alerts for dynamic exits if the trend resumes. Patience pays on this one, let the setup come to us. ⏳

AUD/USD Demand Zone Holding as Bulls Regain Control📈 AUD/USD “THE AUSSIE” Signal — Swing & Day Trade Guide 🇦🇺💵
Bullish Bias — Multi-Layered Entry Thief Strategy 🎯📊
🔔 Current live rate: ~0.6680–0.6700 (major FX session volatility)
📌 Trade Plan — Bullish Thief Layers
We’re positioning for Aussie strength vs USD as risk sentiment improves and macro data evolves.
💡 Layered Buy Entries (Thief Method):
➡️ 0.66800
➡️ 0.66900
➡️ 0.67000
➡️ 0.67200
(Add more buy limit layers based on your risk tolerance & market structure)
📊 Thief Strategy = Multiple limit buys to build position slowly, reducing average entry.
🎯 Targets & Structure
📍 Primary Target: 🎯 0.68300 — Strong resistance zone + possible overbought trap exit.
📍 Let price validate upside momentum & lock profits if premium levels reject.
⚠️ Stop Loss (Thief SL): 🛑 0.66600
(Close below key support = invalidation zone)
📌 Take Profit & Stop Loss decisions remain your responsibility. Manage risk per your risk profile.
🌐 Fundamentals & Macro Drivers 📊
Bullish drivers for AUD/USD:
✔️ AUD/USD has rallied ~5% since late 2025 due to improving China data & commodity support.
✔️ RBA vs Fed rate dynamics — RBA possibly more hawkish/sticky while Fed easing slows.
✔️ Aussie behaves like a risk-linked & commodity currency — iron ore, coal & gold flows matter.
✔️ IMF warns prolonged above-target inflation for Australia (affects interest expectations).
🗓️ Key Real-Time Economic Events to Watch (London time basis):
• RBA Rate Decision & statement
• Australian CPI / employment figures
• US Nonfarm Payrolls & Unemployment claims
• US CPI & Retail Sales
Use global Economic Calendar for live impacts.
🔁 Correlated Pairs to Watch 🧠
These help confirm bias and manage risk:
📌 GBP/USD & EUR/USD — Often move with USD strength/weakness
📌 USD/JPY — Inverse USD risk signal
📌 Gold (XAU/USD) — Positive correlation with AUD/USD on risk sentiment / commodity flows
📌 AUD/JPY & NZD/USD — Commodity/carry-linked peers
💡 When USD weakens broad-based, AUD/USD tends to benefit.
🛠 Technical Structure & Indicators
Indicators adding conviction:
📌 Price above key moving averages
📌 RSI approaching bullish momentum
📌 Higher lows structure forming
A break above intermediate resistance ~0.6760 would accelerate bullish odds.
💬 Trade Notes & Community Buzz
👍 This setup blends technical precision + fundamental context, crafted for engagement & clarity.
👥 Traders tracking commodities, risk appetite and central bank tilts will find this useful.

Time To Buy AUDUSD nowAUDUSD was in a recent downtrend for the last few weeks and struggled to stay bullish, but recently it has just broken a strong resistance trend line which it tested several times and failed to break through. AUDUSD is very likely to hit the next major resistance zone which is market as the "TAKE PROFIT" LEVEL. There are many clear signs of new bullish movements. TIME TO BUY AUDUSD now

AUDUSD — FRGNT DAILY CHART FORECAST Q1 | D20 | W3 | Y26📅 Q1 | D20 | W3 | Y26
📊AUDUSD — FRGNT DAILY CHART FORECAST
🔍 Analysis Approach
I’m applying a developed version of Smart Money Concepts, with a structured focus on:
• Identifying Key Points of Interest (POIs) on Higher Time Frames (HTFs) 🕰️
• Using those POIs to define a clear and controlled trading range 📐
• Refining those zones on Lower Time Frames (LTFs) 🔎
• Waiting for a Break of Structure (BoS) as confirmation ✅
This process keeps me precise, disciplined, and aligned with market narrative, rather than reacting emotionally or chasing price.
💡 My Motto
“Capital management, discipline, and consistency in your trading edge.”
A positive risk-to-reward ratio, combined with a high-probability execution model, is the backbone of any sustainable trading plan 📈🔐
⚠️ On Losses
Losses are part of the mathematical reality of trading 🎲
They don’t define you — they are necessary, expected, and managed.
We acknowledge them, learn, and move forward 📊➡️
🙏 I appreciate you taking the time to review my Daily Forecast.
Further context and supporting material can be found in the Links section.
Stay sharp 🧠
Stay consistent 🎯
Protect your capital 🔐
— FRGNT 🚀📈
FX:AUDUSD

AUDUSD - H4 - SHORTS - BEARISH REVERSAL PLAYIts time aussie.. its time to dip.. Nice clean bearish reversal setup on Audusd on the back on a strong dollar, weak equities and weak metals.. Risk off is coming

AUDUSD(20260119)Today's AnalysisMarket News:
President Trump vowed last Saturday to impose a series of escalating tariffs on EU member states Denmark, Sweden, France, Germany, the Netherlands, and Finland, as well as the UK and Norway, until the US is authorized to purchase Greenland. On March 17th, Trump announced on social media that a 10% tariff would be imposed on goods imported from Denmark, Norway, Sweden, France, Germany, the UK, the Netherlands, and Finland starting February 1st, and declared that the tariff rate would increase to 25% from June 1st, until the parties reach an agreement on the US's "full and complete purchase of Greenland."
Technical Analysis:
Today's Buy/Sell Threshold:
0.6687
Support and Resistance Levels:
0.6725
0.6711
0.6702
0.6672
0.6663
0.6649
Trading Strategy:
If the price breaks above 0.6687, consider buying with a first target price of 0.6711.
If the price breaks below 0.6663, consider selling with a first target price of 0.6649.

AUDUSD — FRGNT WEEKLY CHART FORECAST Q1 | W3 | Y26📅 Q1 | W3 | Y26
📊 AUDUSD — FRGNT WEEKLY CHART FORECAST
🔍 Analysis Approach
I’m applying a developed version of Smart Money Concepts, with a structured focus on:
• Identifying Key Points of Interest (POIs) on Higher Time Frames (HTFs) 🕰️
• Using those POIs to define a clear and controlled trading range 📐
• Refining those zones on Lower Time Frames (LTFs) 🔎
• Waiting for a Break of Structure (BoS) as confirmation ✅
This process keeps me precise, disciplined, and aligned with market narrative, rather than reacting emotionally or chasing price.
💡 My Motto
“Capital management, discipline, and consistency in your trading edge.”
A positive risk-to-reward ratio, combined with a high-probability execution model, is the backbone of any sustainable trading plan 📈🔐
⚠️ On Losses
Losses are part of the mathematical reality of trading 🎲
They don’t define you — they are necessary, expected, and managed.
We acknowledge them, learn, and move forward 📊➡️
🙏 I appreciate you taking the time to review my Daily Forecast.
Further context and supporting material can be found in the Links section.
Stay sharp 🧠
Stay consistent 🎯
Protect your capital 🔐
— FRGNT 🚀📈
FX:AUDUSD

AUDUSD(20260115)Today's AnalysisMarket News:
Daniel Casali, investment strategy partner at UK wealth management firm Evelyn Partners, said on Tuesday that his team is optimistic about both gold and silver. He pointed out that the uncertainty caused by events such as the outbreak of the Russia-Ukraine conflict in 2022 and US President Trump's announcement of so-called "Liberation Day" tariffs last April continues to support gold prices. As major world powers continue to diversify their trade war tactics, Casali stated that an atmosphere of "resource nationalism" is forming, continuously driving the precious metals market higher. In the first week of 2026, the US forcibly took control of Venezuelan strongman Maduro, while the White House hinted at possible military action to control Greenland. These actions exacerbated political risks and further strengthened the uncertainty supporting rising precious metal prices. Casali stated, "The current geopolitical game is complex, but the core conclusion is that resource nationalism will drive up gold and silver prices."
Technical Analysis:
Today's Buy/Sell Threshold:
0.6684
Support and Resistance Levels:
0.6713
0.6702
0.6695
0.6673
0.6666
0.6655
Trading Strategy:
If the price breaks above 0.6684, consider buying, with a first target price of 0.6702.
If the price breaks below 0.6673, consider selling, with a first target price of 0.6655.

AUDUSD — FRGNT DAILY CHART FORECAST Q1 | D13 | W2 | Y26📅 Q1 | D13 | W2 | Y26
📊 AUDUSD — FRGNT DAILY CHART FORECAST
🔍 Analysis Approach
I’m applying a developed version of Smart Money Concepts, with a structured focus on:
• Identifying Key Points of Interest (POIs) on Higher Time Frames (HTFs) 🕰️
• Using those POIs to define a clear and controlled trading range 📐
• Refining those zones on Lower Time Frames (LTFs) 🔎
• Waiting for a Break of Structure (BoS) as confirmation ✅
This process keeps me precise, disciplined, and aligned with market narrative, rather than reacting emotionally or chasing price.
💡 My Motto
“Capital management, discipline, and consistency in your trading edge.”
A positive risk-to-reward ratio, combined with a high-probability execution model, is the backbone of any sustainable trading plan 📈🔐
⚠️ On Losses
Losses are part of the mathematical reality of trading 🎲
They don’t define you — they are necessary, expected, and managed.
We acknowledge them, learn, and move forward 📊➡️
🙏 I appreciate you taking the time to review my Daily Forecast.
Further context and supporting material can be found in the Links section.
Stay sharp 🧠
Stay consistent 🎯
Protect your capital 🔐
— FRGNT 🚀📈
FX:AUDUSD

Buy AUDUSD nowAUDUSD was in a recent downtrend for the last few weeks and struggled to stay bullish, but recently it has just broken a strong resistance trend line which it tested several times and failed to break through. AUDUSD is very likely to hit the next major resistance zone which is market as the "TAKE PROFIT" LEVEL. There are many clear signs of new bullish movements. BUY AUDUSD now

AUDUSD(20260108)Today's AnalysisMarket News:
U.S. Energy Secretary Chris Wright stated that the Trump administration plans to take over Venezuela's future oil sales and use the proceeds to rebuild the country's economy.
"If we control where the oil flows and the cash flow generated from those sales, we will have tremendous leverage," Wright said Wednesday at the Goldman Sachs Energy, Clean Technology, and Utilities conference in Miami. "We need that leverage and control over oil sales to drive the necessary changes in Venezuela." Wright anticipates that Venezuela's daily crude oil production could increase by hundreds of thousands of barrels in the short to medium term. The U.S. government plans to deposit the proceeds into government accounts to benefit the Venezuelan people.
Technical Analysis:
Today's Buy/Sell Threshold:
0.6733
Support and Resistance Levels:
0.6783
0.6764
0.6752
0.6714
0.6703
0.6684
Trading Strategy:
If the price breaks above 0.6733, consider buying with a first target price of 0.6752.
If the price breaks below 0.6714, consider selling with a first target price of 0.6703.

AUDUSD📊 OANDA:AUDUSD Technical Analysis (4H Timeframe)
The overall trend for AUD/USD is strongly bullish, as evidenced by the consistent formation of higher highs and higher lows 📈. The price is currently trading comfortably above the EMA 200 (black line), which shows a clear upward slope, confirming long-term buyer control. The EMA 50 (red line) is also trending upwards and providing immediate dynamic support, highlighting robust bullish momentum. Looking at the candle bodies, we see significant strength in the recent impulsive moves. Currently, the price is testing a major resistance zone near 0.67550 USD. A clean break and hold above this grey box would confirm the continuation of the trend toward the next structural targets 🚀.
🔑 Key Levels to Watch:
Primary Resistance Target: 0.68190 USD (Top Grey Box) 🚩
Immediate Resistance: 0.67550 USD (Current Grey Box) 💡
Dynamic Support 1: 0.66850 USD (EMA 50 / Broken Resistance) 🎯
Dynamic Support 2: 0.66330 USD (EMA 200 / Grey Box) ⚡
Structural Support: 0.66000 USD & 0.65700 USD (Dashed Lines) 🛡️
Major Demand Zone: 0.64270 USD (Origin Grey Box) 🏗️

AUDUSD Potential Long!
HI,Traders !
#AUDUSD is trading in a
Local uptrend and the pair
Will soon hit a horizontal
Support level of 0.66126
From where we will be
Expecting a local
Bullish rebound !
Comment and subscribe to help us grow !
