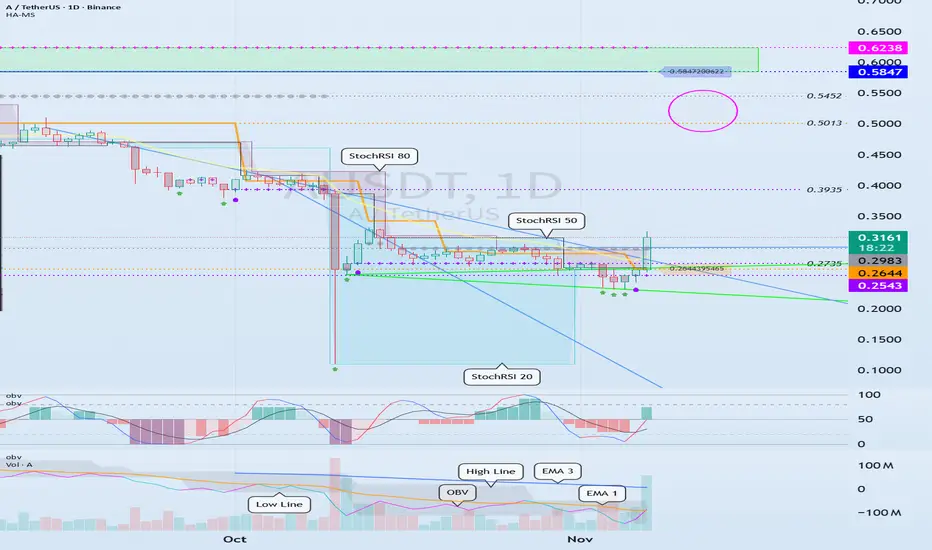
See if it finds support near 0.2983 and can rally
Hello, fellow traders!
Follow us to get the latest information quickly.
Have a great day!
-------------------------------------
(AUSDT 1D chart)
The StochRSI indicator was added shortly after the chart was created.
The key is whether it can find support around 0.2644-0.2983 and rise to around 0.5847.
-
To sustain the uptrend, the price must remain above the StochRSI 80 level.
Therefore, whether support is found around 0.2983 is crucial.
The basic trading strategy is to buy in the DOM(-60) ~ HA-Low range and sell in the HA-High ~ DOM(60) range.
However, if the price rises in the HA-High ~ DOM(60) range, a stepwise upward trend is likely, while a decline in the DOM(-60) ~ HA-Low range is likely to lead to a stepwise downward trend.
Therefore, a split trading strategy is recommended.
The end of a stepwise downward trend is an uptrend, and the end of a stepwise upward trend is a downtrend.
Therefore, when the price is near the HA-Low or HA-High indicators, it's time to focus on finding a trading opportunity.
-
To sustain an uptrend after breaking above a key point or range,
1. The StochRSI indicator must be trending upward. If possible, it should not be overbought.
2. The TC (Trend Check) indicator must be trending upward. If possible, it should remain above the zero level.
3. The On-By-Value (OBV) indicator must be trending upward. If possible, it should remain above the High Line.
If the above conditions are met, the uptrend is more likely to continue.
-
Thank you for reading to the end.
I wish you successful trading.
--------------------------------------------------
Ausdtperp
Check if it can rise to around 0.5452
Hello, traders. Nice to meet you.
If you "Follow" us, you'll always get the latest information quickly.
Have a great day.
-------------------------------------
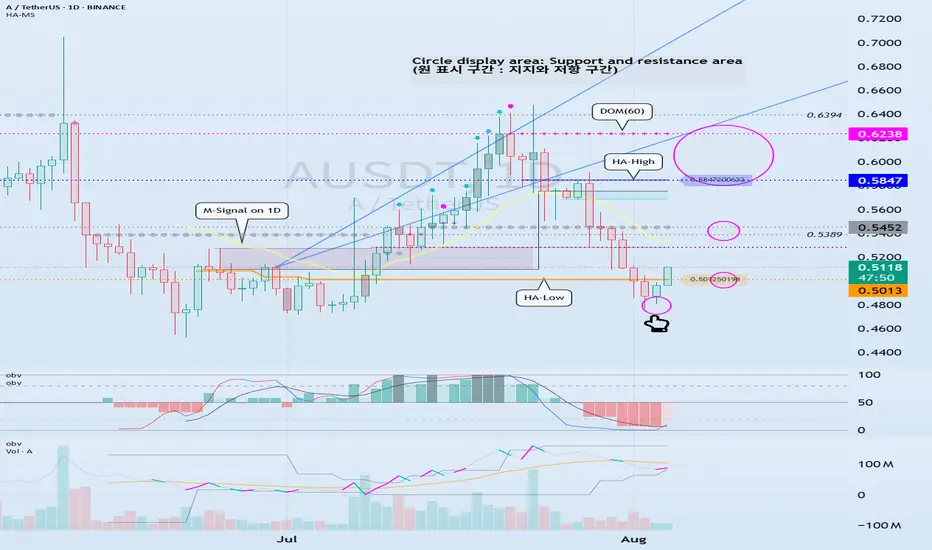
(AUSDT 1D chart)
It hasn't been long since EOS changed to A.
Nevertheless, the formation of the HA-Low and HA-High indicators suggests that a wave has begun to form.
However, since the DOM (-60) indicator hasn't yet formed, if it fails to find support from the HA-Low indicator, further declines could occur, so we need to consider countermeasures.
With the HA-Low and HA-High indicators in place, we can now trade in line with our basic trading strategy.
In other words, this refers to a trade where you buy in the DOM(-60) ~ HA-Low range and sell in the HA-High ~ DOM(60) range.
This ultimately refers to a trading strategy within a box range.
Trend trading strategies proceed by either rising in the HA-High ~ DOM(60) range or falling in the DOM(-60) ~ HA-Low range.
In other words, a rise in the HA-High ~ DOM(60) range is likely to lead to a stepwise uptrend, while a decline in the DOM(-60) ~ HA-Low range is likely to lead to a stepwise downtrend.
In this sense, key support and resistance levels are the 0.5013 point and the 0.5847-0.6238 range.
Currently, the price is rising above 0.5013, so if support is found around 0.5013, it would be a good time to buy.
The first sell zone is around 0.5452, where a volume profile zone has formed.
If the price rises above this level and maintains, it is expected to continue upward, likely reaching the 0.5847-0.6238 range.
-
The low trendline has not yet been formed.
The low of the candlestick indicated by the finger is the first selection point for drawing the low trendline.
Since a high trendline has been formed, we should also examine whether the price can rise along the high trendline.
-
Thank you for reading to the end.
I wish you successful trading.
--------------------------------------------------
- This is an explanation of the big picture.
(3-year bull market, 1-year bear market pattern)
I will explain in more detail when the bear market begins.
------------------------------------------------------