Stellantis | STLA | Long at $9.59Stellantis NYSE:STLA is the maker of the auto brands Fiat, Peugeot, Jeep, Citroën, Opel/Vauxhall, Ram Trucks, Dodge, Chrysler, Alfa Romeo, Maserati, DS Automobiles, Lancia, Abarth, and Vauxhall. The stock has fallen sharply due to a 70% profit drop in 2024, weak U.S. sales, high inventory, and tariff uncertainties. The turnaround for NYSE:STLA beyond 2025 hinges on new CEO Antonio Filosa’s focus on U.S. market recovery, new product launches (e.g., Ram 1500 Ramcharger, Jeep hybrids), pricing adjustments, aggressive marketing, $5B U.S. manufacturing investment, and mending dealer relations. The stock is trading at a P/E of 5.1x, debt-to-equity of 0.8x (not bad), a book value of $29 (undervalued), a tangible book value of $9.82, and earnings and revenue are forecasted to grow into 2028. Economic weakening and tariffs may hamper these predictions, but the new CEO and future interest rate drops may get this stock rolling again.
However, if NYSE:STLA shows zero sign of near-term recovery or other fundamental issues arise, I truly think this stock could enter the high $5-$6 range before a true reversal begins.
From a technical analysis perspective, the stock price is currently with my selected "crash" simple moving average. This area often signifies a near-term bottom, but like mentioned above, watchout out for the "major crash" simple moving average area currently between $5.83 and $7.09.
Regardless of bottom predictions, NYSE:STLA is in a personal buy zone at $9.59 with a greater position likely if it enters my "major crash" zone, as mentioned above.
Targets into 2027:
$12 (+25.1%)
$14 (+46.0%)
Autostocks

$F: Ford Motor Company – Driving Profits or Stalling Out?(1/9)
Good afternoon, everyone! ☀️ NYSE:F : Ford Motor Company – Driving Profits or Stalling Out?
With F at $10.18, is this auto giant revving up with EVs or sputtering in the market? Let’s shift gears and find out! 🔍
(2/9) – PRICE PERFORMANCE 📊
• Current Price: $ 10.18 as of Mar 18, 2025 💰
• Recent Move: Slight uptick in March, per data 📏
• Sector Trend: Auto sector mixed, EV demand growing 🌟
It’s a road with twists—let’s see where it leads! ⚙️
(3/9) – MARKET POSITION 📈
• Market Cap: Approx $45B (4.4B shares) 🏆
• Operations: Global auto manufacturer, focusing on EVs ⏰
• Trend: EV push with F-150 Lightning, per data 🎯
Firm in its lane, with electric acceleration! 🚗
(4/9) – KEY DEVELOPMENTS 🔑
• Q1 2025 Earnings: Expected soon, EV sales in focus 🌍
• EV Sales: F-150 Lightning gaining traction, per data 📋
• Market Reaction: Stock reflects cautious optimism 💡
Shifting to electric, eyes on the horizon! ⚡
(5/9) – RISKS IN FOCUS ⚡
• Economic Slowdown: Impact on auto sales 📉
• Competition: Tesla, GM, VW in EV race ❄️
• Supply Chain: Geopolitical tensions affecting parts 🛑
It’s a competitive race—buckle up! 🚦
(6/9) – SWOT: STRENGTHS 💪
• Brand Power: Iconic auto brand 🥇
• EV Strategy: F-150 Lightning leading the charge 📊
• Undervalued: Low P/E ratio, strong cash flow 🔧
Got the engine to roar! 🏁
(7/9) – SWOT: WEAKNESSES & OPPORTUNITIES ⚖️
• Weaknesses: Traditional auto sales vulnerable to economic shifts 📉
• Opportunities: Growing EV market, new models 📈
Can it charge ahead or run out of juice? 🤔
(8/9) – POLL TIME! 📢
F at $10.18—your take? 🗳️
• Bullish: $12+ soon, EV boom drives growth 🐂
• Neutral: Steady, risks balance out ⚖️
• Bearish: $9 looms, market stalls 🐻
Chime in below! 👇
(9/9) – FINAL TAKEAWAY 🎯
F’s $10.18 price tags potential value 📈, but volatility’s in the air 🌿. Dips are our DCA fuel 💰—buy low, ride high! Gem or bust?

$BAJAJAUTO: Bajaj Auto – Wheeling to Wealth or Spinning Out?(1/9)
Good afternoon, everyone! ☀️ $BAJAJAUTO: Bajaj Auto – Wheeling to Wealth or Spinning Out?
With BAJAJAUTO at ₹7,711.25 post-CEO nod and ₹1,500 crore boost, is this two-wheeler titan revving up or stalling? Let’s ride into it! 🔍
(2/9) – PRICE PERFORMANCE 📊
• Current Price: $ 7,711.25 as of Mar 19, 2025 💰
• Recent Move: Up 1.64% on news, below $12,774 high, per data 📏
• Sector Trend: Auto sector steady, with two-wheeler demand in focus 🌟
It’s a smooth ride—value might be in gear! ⚙️
(3/9) – MARKET POSITION 📈
• Market Cap: Approx ₹2.12 lakh crore (web ID: 6) 🏆
• Operations: Two-wheelers, financing via subsidiary ⏰
• Trend: Leadership stability, credit growth, per data 🎯
Firm in its lane, with expansion in sight! 🚴♂️
(4/9) – KEY DEVELOPMENTS 🔑
• CEO Re-appointment: Rajiv Bajaj for 5 yrs from Apr 1, per data 🌍
• Investment: ₹1,500 crore into Bajaj Auto Credit Ltd., per data 📋
• Market Reaction: Stock up, signaling confidence 💡
Revving up leadership and capital! 🛵
(5/9) – RISKS IN FOCUS ⚡
• Market Volatility: Trade tensions, economic shifts 🔍
• Competition: Hero MotoCorp, TVS pressure sales 📉
• Rates: Rising costs could hit demand ❄️
It’s a twisty road—watch the turns! 🛑
(6/9) – SWOT: STRENGTHS 💪
• Brand Power: Two-wheeler leader in India 🥇
• Subsidiary Growth: Credit arm expansion, per data 📊
• Dividend: Steady payouts attract income fans 🔧
Got horsepower to spare! 🏍️
(7/9) – SWOT: WEAKNESSES & OPPORTUNITIES ⚖️
• Weaknesses: Below peak, macro risks 📉
• Opportunities: Two-wheeler demand, financing growth 📈
Can it accelerate or hit a bump? 🤔
(8/9) – POLL TIME! 📢
BAJAJAUTO at ₹7,711.25—your take? 🗳️
• Bullish: ₹9,000+ soon, growth kicks in 🐂
• Neutral: Steady, risks balance out ⚖️
• Bearish: ₹7,000 looms, market stalls 🐻
Chime in below! 👇
(9/9) – FINAL TAKEAWAY 🎯
BAJAJAUTO’s ₹7,711.25 price reflects confidence 📈, but volatility’s in the air 🌿. Dips are our DCA fuel 💰—buy low, ride high! Gem or bust?

RIVN rises with LCID while FSR fails LONGRIVN popped today while FSR got halted and will be delisted. The 4H chart with BB and a
predictive algo added suggest it has room to 13.25. The indicators are supportive of that
forecast. I will take a long position here with a stop loss under the lower BB line. As to
my FSR put options I will watch them rise until expiration time. No hurry. No worry there.
RIVN's new models and FSR's demise should help for some bullish momentum until RIVN
catches a bit of FSR''s issues.

GM may be pivoting down SHORTGM on the weekly chart has ascended to the top of the high volume area of the long term
volume profile. The predictive algorithm forecasts a bounce down from that level. The
MACD indicator shows lines crossing over the histogram while the RSI lines are in the 60s
about the same level as the market pivot in 2022. The Supply / Demand indicator has the lines
with zero slopes ( flat) and ready for a reversal. Fundamentally, GM is challenged by the
dynamic between EVs and hybrids moving foward and federal mandates on fleet production
efficiency quota. I will take a short trade here along with Ford.

F Bearish Bias Again SHORTFORD ( F) on a weekly chart is in a falling wedge pattern. Fundamentally, it is challenged
by the EV vs hybrid dynamic, weak EV sales and the federal slowly ramping up MPG
requirements as potentially rising gasoline prices affecting consumer decisions away from the
gas consuming F-150 where the profits are the highest. Unless F can breakout of the falling
wedge, price could compress further in the wedge with a move down as far as 9.
At present F is testing the upper resistance descending trendline. The predictive algorithm
suggests it will be rejected and fall. I am entering a short trade here for a long term swing.

RIVN guides itself lower- but is it a dip buy? SHORTRIVN spends more to produce of its nice truck than it sells them for. This is a recipe for a
disaster which is now baking in the oven Earnings have plummeted. If guidance was better
than realities forecast there might be a dip buy here. i have a variety of positions shorting
RIVN when it runs a countertrend correction I will take a hedging long position until the
correction is over. I use these shorts to balance my portfolio against risk from an overall
falling market. Balanced in short vs long positions dollar for dollar and in the options
balanced in expiration times spread across the next almost two years. I find this keeps
the portfolio safe. I also look to LCID for a similar scenario while having a bullish bias on
WKHS. NKLA is a whole 'nother story. SHORT RIVN do not dip buy .
The chart is what you might expect. The disaster is what it is. This is basically a falling wedge
and no where near impending a breakout upside.

TSLA to FORD Ratios of share price and market cap over time On the weekly chart, the TSLA /F ratio is plotted versus time. An ascending ratio suggests, TSLA
market cap is dominating FORD while a falling ratio is the opposite. If a trader is trading both
of them this charge helps guide relative momentum and so also trading decisions related to
the shift in the EV trend and other related long-view concepts. FORD just did a big earnings
beat. While TSLA is sideways at best, FORD popped 8-10% which will reflect itself in the overall
weekly candle being red and somewhat engulfing. I am hopeful those trading both Ford and
Tesla find this helpful. Zooming into daily or 2-5H time frames may reveal more dynamic
price ratio action.

PRITIKA AUTO INDUS - GOOD VOLUMECan Enter at CMP 41.30 or Enter at 37 level
If again falls then you need to average at 26 level
BEST STOCK TO INVEST
Disclaimer - All information on this page is for educational purposes only,
we are not SEBI Registered, Please consult a SEBI registered financial advisor for your financial matters before investing And taking any decision. We are not responsible for any profit/loss you made.
Request your support and engagement by liking and commenting & follow to provide encouragement
HAPPY TRADING 👍

Eicher Motor Trend AnalysisEicher Motor is making flag pattern at 1H time frame you can trade Eicher Motor with small stop loss.
Entry : 3349
StopLoss : 3331
Target : 3390,3400,3430

ASHOK LEYLAND BULLISH CUP & HANDLE BREAKOUT | 1:2.5 RR | SWINGAs Nifty is trading above its resistance area, it looks like the growth is being pushed by AUTO and FMCG Sector.
AUTO Sector has recently broken out of its resistance area and it seems it will continue to go higher in upcoming weeks.
Checking out AUTO STOCKS, Ashok Leyland looks a good pick.
The price has broken out of its resistance area and is trading above Daily 200 EMA.
Also, the price has broken out a Cup and Handle Pattern, which is a bullish pattern.
Entry- 147.5
TARGETS
1- 154
2-160
STOP LOSS
For aggressive traders- 144
For conservative traders- 142
This is a SWING TRADE
Let me know in the comments section if you want me to analyse any other financial instrument.
WARNING:-
ALWAYS FOLLOW RISK MANAGEMENT AND POSITION SIZING WHILE TAKING ANY TRADE.

TVS MOTORSHello and welcome to this analysis
A bullish harmonic bat has been activated in daily time frame suggesting a bounce/reversal till 1075/1100 as long as it does not break below 990.
Accumulation zone 1010-1040 for a good risk reward set up
Happy Investing

Greves Cotton Levels & Strategy for next few daysDear traders, I have identified chart levels based on my analysis, major support & resistance levels. Please note that I am not a SEBI registered member. Information shared by me here for educational purpose only. Please don’t trust me or anyone for trading/investment purpose as it may lead to financial losses. Focus on learning, how to fish, trust on your own trading skills and please do consult your financial advisor before trading.
Company is focusing on accelerating adoption of electric vehicles and transforming last mile mobility with clean transport solutions has strengthened their leadership position in this fast-growing electric auto market. Company posted net profit of 32.3 crore & net loss of Rs 23.3 crore. Stock has beaten 3 year revenue CAGR. Electric mobility segment posted highest ever quarterly profit.

Tata MotorsHello and welcome to this analysis
TATA MOTORS gave a sharp dip from its slanting trendline and now at 390 has formed a Bullish Harmonic Reciprocal AB=CD
It could do pullbacks till 430-440 as long as it does not break below 390
Good Risk Reward set up at this level.
Happy Investing

TATA MOTORSHello and welcome to this analysis based on Harmonic Trading Patterns
In the daily time frame it has made a Bearish Harmonic ABCD pattern with perfect balance symmetry.
It could retrace down to 440 - 430 as long as it does not trade above 461
As per Option Data also July Series 460CE is seeing fresh shorts being added and 440PE is seeing short covering. While August Series 460CE has already formed a very strong OI resistance with more being added currently.

MARUTIHello & Welcome to this analysis
Maruti has activated a Bullish Harmonic 5-0 Pattern suggesting upside till 8500-8600 with strong support now at 7800.
Harmonic 5-0 Patterns are not found so frequently and their success ratio is quite high.
Happy Investing

ASHOK LEYLANDIt has given a breakout after a sideways corrective. In the short term it could rally till 155-160 while in the medium term stock looks good for a possible 225. Short term stop loss for this breakout is at 141

M_M might move towards 800 levelsDaily Chart - Stock is mostly sideways on the daily chart.
Hourly - Stock had lower low, lower high structure, though recently the length of downswings are getting smaller and stock also went above previous high, and it looks like it is started to create a higher high structure.
Hence sustaining 748- 745 levels, it can move towards 800 in the coming week.

GM UptrendSince the beginning of the year General Motors has started doing healthy bullish things on its chart.
We have another uptrend that is in play, and if the trend holds we can look for a retest of the $60.30 resistance level. A break and hold above that level could send us 15% to the upside to the top of the channel.
***Also, please be aware that the current market is fueled with uncertainty at the moment, so a breaking of this uptrend is very much possible. Until then, however, we assume GM remains in the trend until it doesn't.
If the trend breaks, we have our stop losses at $57.43 and the final line in the sand at $55.82.

BAJAJ AUTOAs per ICHIMOKU technical studies in multi time frame. the consolidation appears to be complete in this hourly triangle. It could now test 4350/4500 as long as it sustains above 4170

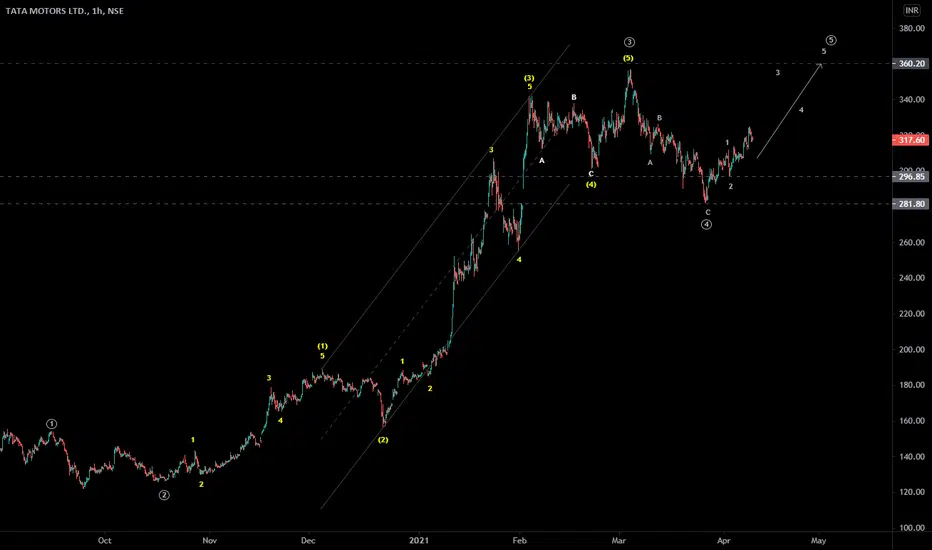
TATAMOTORS - Elliott wave analysis - 5th wave up It is in 3rd of 5th wave up of larger degree cycle. The stop loss level is 296.85 and target level will be above 360.
General Motors Pulls BackGeneral Motors has been in the fast lane since the fourth quarter began. It’s now having its steepest pullback of the rally, offering momentum investors a potential opportunity.
The first feature on GM’s chart is yesterday’s hammer candlestick. Sellers tried to push the shares below $41 but weren’t able to keep it there.
Second, that $41 level is potentially important because it’s near the daily closing highs in July 2019.
Next, GM’s stochastic oscillator recently fell to its lowest level since August 2019. That may suggest a deeply oversold condition.
The automaker’s fundamentals have also improved – in both the near term and longer term. In the near-term, GM has gotten a huge margin boost from SUVs and pickups. Last quarter, for instance, revenue barely beat estimates but profits were almost double consensus.
Over the longer term, CEO Mary Barra is pushing GM toward electric vehicles with the development of its Ultium drivetrain. That could lift valuations because GM trades for less than 1 times revenue. In comparison, Tesla trades for more than 20 times revenue.
TradeStation is a pioneer in the trading industry, providing access to stocks, options, futures and cryptocurrencies. See our Overview for more.

May have found a base and turn upAfter reaching an ATH just above 75, the price has since fallen back and consolidated after failing to reclaim the upward trend line. Long entry above 51.49 is a confluence above the.236 fib as well as the VPOC, more conservative entry is at reclaim of the trend line. This may also have a possible earnings run-up approaching late November.
