AVAUSDT| Let's try to buy back a coin in the channel!Hello trader! Today I have a new idea for you. Like and subscribe to the channel, there is a lot of useful information there.✅
the coin is in a local downward channel, the price may soon break out of the upper boundary and reach the 0.618 zone. We enter carefully with a small percentage of the deposit.
Plan for the deal
Entry - 0.444/0.440$
Stop - $0.419
Take - $465
AVA

$AVA Triple Bottom Know Thy Targets The technical analysis of stock NYSE:AVA showcases a noteworthy Triple Bottom pattern in the monthly chart signifying a potential reversal in its price trend. This pattern, characterized by three successive troughs at approximately the same level, suggests a strengthening support level. Observing such a configuration often indicates that selling pressure has waned, potentially opening the door for a bullish reversal. Traders and investors may closely monitor this development, seeking confirmation of upward momentum that could prompt a positive shift in the stock's direction. Know Thy Targets

Ava Looking Ready For Solid Recovery Seems Like Ava Has already Bottomed Out And Getting ready for Massive recovery Falling Wedge Breakout Has already confirmed In Weekly Tf Retesting In Process In Case Of Successful Retest Expecting 340 to 360% bullish Rally In Midterm
Ava crashing structure almost completed Hi all!
1 this is not financial advise! Do your own research ;) I am just having fun…
On the 1 hour chart I find out that the crashing structure is almost done,
The price should go now to nr 6 that should not go higher than nr 4 in wave 5, after that we should revisit one more time the low (7) what should be around wave 5 or slightly under before we make are way up again.
Greetings,
Please leave a comment…

AVA - Channel UpContinuation of the up channel i am looking for.
Added the curve for extra emphasis on the move upwards.
Looking for another test of the upper band of the channel.
Bullish channel.

AVAUSDAVAUSD
Thoughts
After a long fall, buyers were able to buy back the main supply of the coin and pull the price into a sideways trend.
Over time, volatility began to fall, thereby finally making it clear that the Descending Triangle pattern is forming.
At the moment, the price was able to adjust with the global resistance of the triangle.
For altcoins, breaking through global trends often occurs on the second attempt, while for BTC on the first.
AVA already had one attempt to break through, after which the price was rolled back with a long squeeze. After local accumulation, we again see an impulse, which, with a high degree of probability, will break through the resistance.
☑️ Global breakout targets are indicated on the chart by blue lines: $1.047 - $1.361 - $1.788
But remember that everything can change at any time, you need to be flexible and monitor the market. Happy trading.
If you like the idea, don't forget to subscribe and rate like👍

AVA/USDT - Travala.com: Resistance_Breakout_Confirmation◳◱ A Resistance Breakout and Confirmation has been detected on the $AVA / $USDT chart. The price has broken above a key resistance level and has been confirmed by a strong candle, indicating a potential bullish trend. The next resistance key levels are located at 0.627 | 0.657 | 0.716, and the major support zones can be found at 0.568 | 0.539 | 0.48. Consider entering a trade at the current price zone of 0.613 and targeting higher levels.
◰◲ General info :
▣ Name: Travala.com
▣ Rank: 457
▣ Exchanges: Binance, Kucoin, Gateio, Poloniex, Mexc
▣ Category/Sector: Payments - Payment Platforms
▣ Overview: None
◰◲ Technical Metrics :
▣ Mrkt Price: 0.613 ₮
▣ 24HVol: 615,191.251 ₮
▣ 24H Chng: 1.322%
▣ 7-Days Chng: -0.76%
▣ 1-Month Chng: -8.88%
▣ 3-Months Chng: 13.61%
◲◰ Pivot Points - Levels :
◥ Resistance: 0.627 | 0.657 | 0.716
◢ Support: 0.568 | 0.539 | 0.48
◱◳ Indicators recommendation :
▣ Oscillators: BUY
▣ Moving Averages: STRONG_BUY
◰◲ Technical Indicators Summary : STRONG_BUY
◲◰ Sharpe Ratios :
▣ Last 30D: -1.32
▣ Last 90D: 1.02
▣ Last 1-Y: -0.41
▣ Last 3-Y: 0.95
◲◰ Volatility :
▣ Last 30D: 0.66
▣ Last 90D: 0.79
▣ Last 1-Y: 1.14
▣ Last 3-Y: 1.35
◳◰ Market Sentiment Index :
▣ News sentiment score is N/A
▣ Twitter sentiment score is 0.75 - Bullish
▣ Reddit sentiment score is 0.76 - V. Bullish
▣ In-depth AVAUSDT technical analysis on Tradingview TA page
▣ What do you think of this analysis? Share your insights and let's discuss in the comments below. Your like, follow and support would be greatly appreciated!
◲ Disclaimer
Please note that the information and publications provided are for informational purposes only and should not be construed as financial, investment, trading, or any other type of advice or recommendation. We encourage you to conduct your own research and consult with a qualified professional before making any financial decisions. The use of the information provided is solely at your own risk.
▣ Welcome to the home of charting big: TradingView
Benefit from a ton of financial analysis features, instruments and data. Have a look around, and if you do choose to go with an upgraded plan, you'll get up to $30.
Discover it here - affiliate link -

✴️ Travala Long-Term High Lows ($1.4 Next Target or 125%)Travala (AVAUSDT) has been printing higher lows since June 2022 which is long-term (more than 6 months).
This is accompanied by bullish indicators and a strong bullish market all across.
The market has been bullish for a while but people are only starting to notice now because the action is becoming strong.
This is good... More people join the market, the stronger the pairs get which leads to better results.
While we will experience massive growth, this is not the climax, we are only halfway through and some time is left for fireworks.
Easy target 70% to 125%... There can be more.
Namaste.

AVATLY: $0.0017 | an Experience to Remember with REPLAY VALUEfinally a niche cornered market focus on fashion style
to unleash every persons vanity
Facebook could envy this technology
as the team is able to put a great package easy to appreciate and want it
a BUY AND HOLD.. where float is reserved for BiG FUNDS and exchanges to take over
for now only few are on board in the defi space

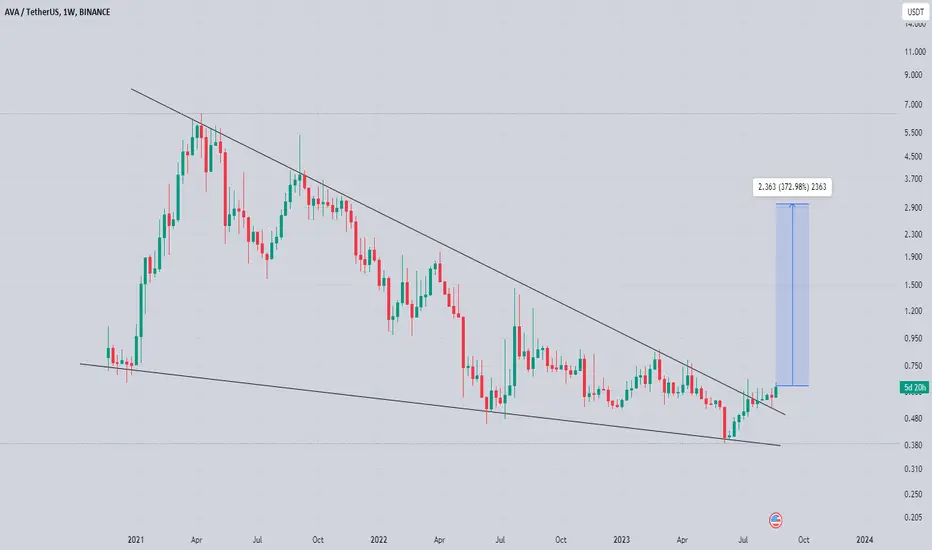
Ava On Verge Of Massive Breakout Seems Like getting ready for Massive breakout
Forming Symmetrical Triangle
Approaching Towards Major trendline Incase Of Ava Cleared Both resistance Then Expecting Massive Recovery In coming Weeks
Incase Of Successful Breakout expecting 2.70$

$AVA/#BTC [#Travala.com]: Resistance_Breakout◳◱ A Resistance Breakout has been identified on the $AVA / $BTC chart. The price has broken above a key resistance level, indicating a potential bullish trend. The next resistance key levels are located at 0.00003164 | 0.00003322 | 0.00003696, and the major support zones can be found at 0.0000279 | 0.00002574 | 0.000022. Consider entering at the current price zone of 0.00003314 and targeting higher levels.
◰◲ General info :
▣ Name: Travala.com
▣ Rank: 433
▣ Category/Sector: Payments - Payment Platforms
▣ Overview: I'm wokring to include a short Background details for this project.
◰◲ Technical Metrics :
▣ Mrkt Price: 0.00003314 ₿
▣ 24HVol: 5.334 ₿
▣ 24H Chng: 2.347%
▣ 7-Days Chng: 5.39%
▣ 1-Month Chng: 16.45%
▣ 3-Months Chng: 33.25%
◲◰ Pivot Points - Levels :
◥ Resistance: 0.00003164 | 0.00003322 | 0.00003696
◢ Support: 0.0000279 | 0.00002574 | 0.000022
◱◳ Indicators recommendation :
▣ Oscillators: SELL
▣ Moving Averages: STRONG_BUY
◰◲ Technical Indicators Summary : BUY
◲◰ Sharpe Ratios :
▣ Last 30D: 4.07
▣ Last 90D: 2.09
▣ Last 1-Y: 0.34
▣ Last 3-Y: 1.05
◲◰ Volatility :
▣ Last 30D: 0.86
▣ Last 90D: 0.69
▣ Last 1-Y: 1.17
▣ Last 3-Y: 1.37
◳◰ Market Sentiment Index :
▣ News sentiment score is N/A
▣ Twitter sentiment score is 0.75 - Bullish
▣ Reddit sentiment score is 0.76 - Very Bullish
▣ In-depth AVABTC technical analysis on Tradingview TA page
▣ What do you think of this analysis? Share your insights and let's discuss in the comments below. Your like, follow and support would be greatly appreciated!
◲ Disclaimer
Please note that the information and publications provided are for informational purposes only and should not be construed as financial, investment, trading, or any other type of advice or recommendation. We encourage you to conduct your own research and consult with a qualified professional before making any financial decisions. The use of the information provided is solely at your own risk.
▣ Welcome to the home of charting big: TradingView
Benefit from a ton of financial analysis features, instruments and data. Have a look around, and if you do choose to go with an upgraded plan, you'll get up to $30.
Discover it here - affiliate link -

$AVA/#BTC [#Travala com]: Resistance_Breakout◳◱ Hey traders, we've identified a Resistance Breakout on the $AVA / $BTC chart. The price has broken above a key resistance level, which can indicate a potential bullish trend. Taking in consideration the next resistance key levels are at 0.00003164 | 0.00003322 | 0.00003696 and the major support zones are respectively at 0.0000279 | 0.00002574 | 0.000022. It is a bullish indication and we may consider entering at the current price zone at 0.0000332 and targetting higher levels.
◰◲ Technical Metrics :
▣ Mrkt Price: 0.0000332 ₿
▣ 24HVol: 9.446 ₿
▣ 24hChng: 7.097%
◲◰ Pivot Points - Levels :
◥ Resistance: 0.00003164 | 0.00003322 | 0.00003696
◢ Support: 0.0000279 | 0.00002574 | 0.000022
◱◳ Indicators recommendation :
▣ Oscillators: SELL
▣ Moving Averages: STRONG_BUY
◰◲ Technical Indicators Summary : BUY
◳◰ Market Sentiment Index :
▣ News sentiment score is N/A
▣ Twitter sentiment score is 0.75 - Bullish
▣ Reddit sentiment score is 0.76 - Very Bullish
▣ In-depth AVABTC technical analysis on Tradingview TA page
▣ What do you think of this analysis? Share your insights and let's discuss in the comments below. Your like, follow and support would be greatly appreciated!
◲ Disclaimer
Please note that the information and publications provided are for informational purposes only and should not be construed as financial, investment, trading, or any other type of advice or recommendation. We encourage you to conduct your own research and consult with a qualified professional before making any financial decisions. The use of the information provided is solely at your own risk.
▣ Welcome to the home of charting big: TradingView
Benefit from a ton of financial analysis features, instruments and data. Have a look around, and if you do choose to go with an upgraded plan, you'll get up to $30.
Discover it here - affiliate link -

AVA/USDT | Pretty Solid Consolidation..!!
#AVA Forming Descending Channel in the Weekly timeframe Chart.
Looks Bullish here & Seems like Ready for Massive Breakout..
Bulls need to Close the Weekly Candle Above 0.6$ to Confirm the Breakout.
In Case of Upside Breakout, Expecting 3-4x Bullish Rally in the Midterm..
Please like the idea for Support & Subscribe for More ideas like this and share your ideas and charts in Comments Section..!!
Thanks for Your Love & Support..!!

long avaCheck this currency yourself. Maybe it will be pumped, the purchase range is characteristic. The sales range is also characteristic.

Travala.com (AVA) formed bullish Gartley for upto 102% pumpHi dear friends, hope you are well, and welcome to the new update on Travala.com (AVA) token with US Dollar pair.
Recently, we had a nice trade of AVA:
Now on On a 4-hr time frame, AVA has formed a bullish Gartley pattern:
Note: Above idea is for educational purpose only. It is advised to diversify and strictly follow the stop loss, and don't get stuck with trade

AVAUSDT(Travala) Daily tf Range Updated till 31-07-22AVAUSDT(Travala) Daily timeframe range. this alt packed with decent volume which is cool and the chart offers lots of data. the more data a price action offers the more options for trading setups. recently for btc price action many alt got their breathing room. even through volatile days of btc it held its lows by a very longer period which clear about its quality. i can see reasonable swing and scalp setups on its range space from both sides.

Travala.com (AVA) formed bullish BAT for upto 74% moveHi dear friends, hope you are well and welcome to the new update on Travala.com (AVA) token with BTC pair.
Previously we had a nice trade of AVA:
On a 2-hr time frame, AVA has formed bullish BAT pattern.
Note: Above idea is for educational purpose only. It is advised to diversify and strictly follow the stop loss, and don't get stuck with trade

AVAUSDT 6H TA: Can Pump Again?Due to the chart, after reaching the support range, pump 80% avausdt, candle has reached the resistance area again, if the range is broken, it will be pumped again and otherwise it will be corrected, suggesting that Enter if the resistance is successfully broken.
Its not Buy or Sell SIGNAL
DYOR
BY : Mohamad Teriz - @AtonicShark

Travala Trade Signal (100% Potential Profits)Here I am sharing with you our trade signal for Travala.
As usual, wait patiently for the trade to develop.
It can go up just as it can go down.
We have LOW RISK, with HIGH POTENTIAL for REWARDS.
----
AVABTC
ENTRY: 0.00002150 - 0.00002400
TP1: 0.00002630
TP2: 0.00003050
TP3: 0.00003350
TP4: 0.00003750
TP5: 0.00004250
TP6: 0.00004800
STOP: Close Daily (D) candle below 0.00002000.
----
This is not financial advice.
I am wishing you great profits.
Lots of health, wealth and success.
Now & always!
Namaste.

AVAUSDT - SETUPAVAUSDT price did well in previous session and now price is trying to break higher hih again if succeed then we may see a strong upside surge.

$AVA - rsi div & bullish if we reclaim the 0.382 for #travalathe price has retraced since the last swing high around 2$ of the last days
AVA now needs to fix above the 0.32 fibonacci level around 1.46 with some good 4h candle closures and we can consider some good long positions
the price is currently rallying because of the rsi divergence which formed at the end of the last downtrend, and we now need some confirmation of the start of another uptrend
let me know what you think about this idea in the comments!


AVA/USDTesting/tracking elliot wave theory. Please do not trade off idea without S/L. Not financial advice.
