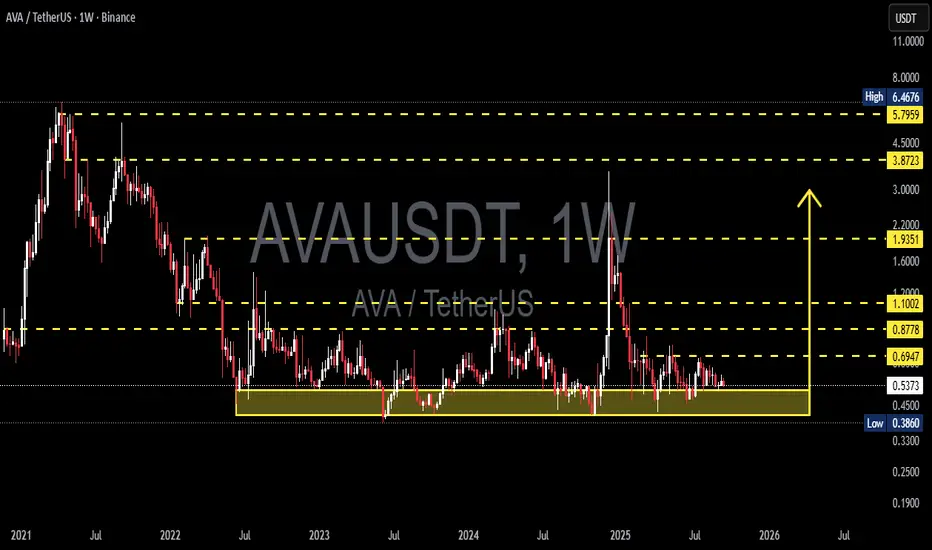
AVA/USDT —Demand Zone: Accumulation or Deeper Breakdown?📌 Overview
The AVA/USDT weekly chart shows a dramatic journey:
From the 2021 peak ($6–7), price has been in a prolonged downtrend followed by sideways consolidation since 2022.
For nearly 3 years, the yellow zone ($0.38 – $0.45) has acted as a battlefield between buyers and sellers.
Each test of this area has resulted in strong rebounds, marking it as a major demand zone.
Now, AVA is once again hovering near this critical support. The big question: Is this the ultimate long-term accumulation zone or the start of a deeper breakdown?
---
🔍 Pattern & Structure Analysis
Macro trend: Bearish since 2021 → long consolidation from 2022–2025.
Dominant pattern: Wide sideways range with a solid base at 0.38–0.45 and tiered resistances at 0.69, 0.87, 1.10, 1.93.
Price character:
Multiple lower wicks into demand zone → sign of liquidity grabs and potential accumulation by bigger players.
Prolonged sideways near lows suggests a possible bottoming formation.
However, compression against support can also lead to a breakdown if bulls lose control.
---
🟢 Bullish Scenario
If buyers defend 0.38–0.45 and push higher:
1. First confirmation: Weekly close above 0.6947.
2. Upside targets:
0.8778 → first mid-term resistance.
1.1002 → psychological & structural breakout zone.
1.9351 → major resistance, early trend reversal confirmation.
3. With strong momentum, a revisit of 3.87 – 5.79 (the 2021 supply zone) remains possible in the next bull cycle.
(Potential gains: +63% to 0.87 / +105% to 1.10 from current price ~0.53).
---
🔴 Bearish Scenario
If a strong weekly close below 0.386 occurs:
1. The 3-year demand zone will fail → showing buyers have lost control.
2. Downside target: 0.25 – 0.19 as the next realistic demand area.
3. Extreme measured-move projection even points to 0.07 (though unlikely, it must be considered).
(Downside risk: −53% to 0.25 from current price).
---
📊 Key Takeaways
$0.38–0.45 = pivotal demand zone for AVA’s next cycle.
Breakout above 0.69 = early bullish signal.
Breakdown below 0.38 = opens risk of new all-time lows.
This zone will decide whether AVA enters a new accumulation phase or faces final capitulation.
---
Critical demand zone = 0.38–0.45.
Watch 0.6947 breakout for bullish bias.
Watch 0.386 breakdown for bearish continuation.
Momentum will reveal if this is smart money accumulation or a last leg down.
---
#AVA #AVAUSDT #CryptoAnalysis #WeeklyChart #Altcoins #TechnicalAnalysis #SupportResistance #CryptoTrading #ChartPatterns
Avaanalysis
AVA/USDT Ready to Explode from Multi-Year Accumulation Zone! 📊 Technical Breakdown:
Major Accumulation Zone (Strong Support):
Price is currently trading within a long-term accumulation zone between $0.3860 - $0.5095 (highlighted in yellow). This zone has been tested multiple times since 2022 and has proven to be strong support.
Reversal Potential:
A projected upward movement from this support zone suggests a potential bullish reversal. Historically, AVA has shown strong rebounds from this area. A breakout with bullish weekly candles will likely confirm the uptrend.
🎯 Key Resistance Targets (Upon Successful Breakout):
1. $0.6947 – First major resistance, crucial for trend confirmation.
2. $0.7504 - $0.8778 – Short-term profit-taking zones.
3. $1.1002 - $1.9351 – Medium-term targets with historical consolidation.
4. $3.8723 - $5.7959 – Long-term targets if a full bull cycle resumes.
📉 Risk Management:
A breakdown below the accumulation zone (below $0.3860) will invalidate the bullish setup.
Beware of fakeouts — wait for weekly candle confirmation before entering.
📌 Conclusion:
AVA is at a critical juncture, sitting on a historically strong accumulation base. A breakout could ignite a significant bullish rally toward key resistance levels. Ideal entry lies near the current support with a tight stop-loss strategy.
#AVA #AVAUSDT #CryptoAnalysis #AltcoinSetup #TechnicalBreakout #BullishReversal #SupportZone #SwingTrade #Binance #CryptoSignals

AVAUSDT 1WAVA ~ 1W Analysis
#AVA Buy back gradually from here with a short -term target of at least 20%+. This is a very good support for now.

AVAUSDT 1WAVA ~ 1W Analysis
#AVA Buy gradually from here if you still have a Conviction on this coin with a short -term target of at least 20%+.

AVAUSDT 1WAVA Update ~ 1W
#AVA So far it still maintains its bullish structure. If you still have Conviction on this coin,. Buy from here, target minimum 20%+

AVA USDT Big Move ComingHello
AVA USDT
Best buy area Green Level
Sell targets on chart (Red Lines).
DCA & DYOR Plz.

AVAUSDT 1WAVA ~ 1W
#AVA this is a very good support block to start buying back. If you have Conviction on this coin. Buy gradually on this support block with a minimum target of 20%+

AVA is still sleepinghey traders, there is AVA, we need a close above the blue line for 1D bar to get the green line (short term's targets)
the yellow lines (long term's targets) and the stop loss is a close under the red line for 1D bar
DON'T ENTER BEFORE THE CLOSING!!
.
trade carefully guys and don't forget the risk management.
.
.
.
.
.
.
.

AVA Analysis 04/03/2021as we can see the token has done its accumulation Phase and started an up run Renege in a parallels Channel where it has showed some Volatility and there are chances that it retraces down and correct its Bullish Impulse wave
if not retraced and continued its rally then we can target the -61.8% expansion level of the Fibonacci Retracement 2TP
if retraced we can target -27% of the same wave which is our 1 TP
there are total of 2 TP where we can target them consequently...

AVAUSDTBINANCE:AVAUSDT Analysis ( A B C ).
( A ) Starting point movement .
( B ) Entry point.
( C ) Target.
Target 1: 5.5
Target 2: 7.2
Target 3: 8.7
Target 4: 10.2
Target 5: 12.5

