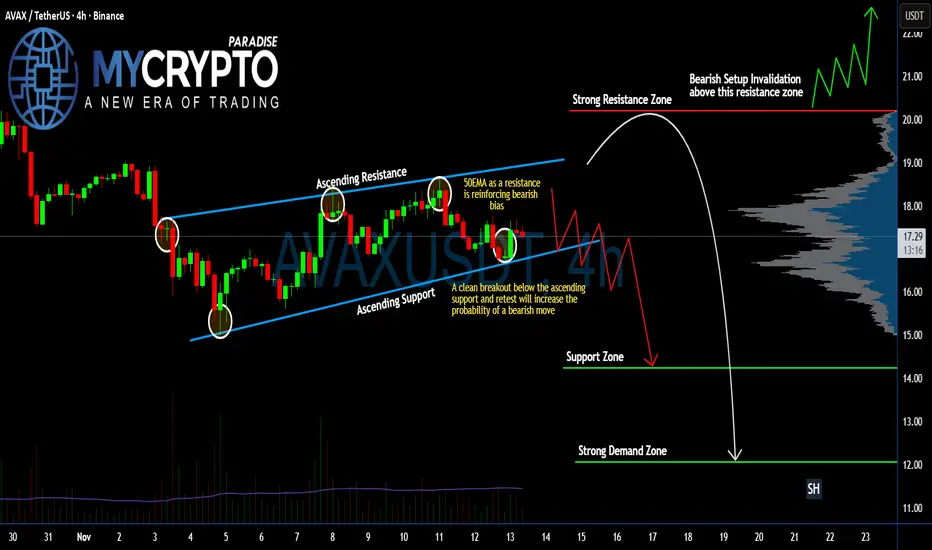
Is #AVAX Ready For a Massive Bearish Move or Not? Must Watch Yello Paradisers! Have you been keeping an eye on what’s happening with #AVAXUSDT? If not, you might be walking straight into a bearish trap. Let's break down the #Avalanche setup:
💎#AVAX has been trading inside an ascending channel, clearly respecting both the ascending support and resistance. We’ve now seen multiple strong rejections from the upper boundary, and most importantly, the 50 EMA is now acting as resistance, reinforcing a growing bearish bias across the board.
💎Current price of #AVAXUSD is $17.26, and we’re hovering just above the key ascending support. A clean breakdown below this support, followed by a bearish retest, would flip the structure and significantly increase the probability of a sharp bearish continuation.
💎If this bearish scenario plays out, we’re targeting the next Support Zone around $14.24. But that’s not where the real pain ends. The real liquidity is parked in the Strong Demand Zone around $12.07, where we could see aggressive buyer activity re-enter—if the market doesn’t capitulate first.
💎This entire bearish setup becomes invalid only if #AVAX manages to reclaim the $20.19 resistance zone. A breakout above that would invalidate the breakdown scenario and likely open the gates for a fast rally into the $22+ region.
Trade smart, Paradisers. This setup will reward only the disciplined.
MyCryptoParadise
iFeel the success🌴
Avalanche
AVAX make it or break it. AVAX remains in a broader downtrend, but price is now sitting at a well-defined demand zone where selling pressure has clearly slowed. The aggressive move down has transitioned into tight, compressed candles, often seen when sellers begin to lose control.
Market structure is still technically bearish, but momentum is no longer expanding lower. Instead, price is stabilizing, suggesting the move may be shifting from continuation into a potential pause or base.
If this area holds, a relief move back into prior resistance and high-volume territory becomes likely. If it fails, AVAX risks another leg lower with little support below.
This is a high-importance zone where the next trend leg forms.
Bounce or breakdown?


AVAX - LONG - SQUEEZE TRAIN LOADING Traders,
I believe CRYPTOCAP:AVAX is getting ready to load a squeeze train upwards. This move might be quick, fast and harsh, the kind of reversal that catches traders off guard and leaves late shorts wondering what just happened.
Price has returned to a deep support zone where two separate Fibonacci retracements align. The 0.786 level from the A to B leg sits exactly at the current price. The 0.886 level from the C to D leg lands in the same place. When two independent fib legs converge like this, it often marks a high interest area where stronger hands quietly position and wait.
Before reaching this zone the market swept the Sunday wick. Sunday wicks are created during thin weekend volume without meaningful institutional presence. Because they form on weak liquidity, the market tends to revisit and clear them once real volume returns. Sweeping this wick removed weak weekend longs, cleaned the structure and collected liquidity needed for a sustained move.
Order Flow is lining up. Spot buyers are absorbing selling while perp traders are shorting into the lows. Spot CVD is rising which shows genuine demand. Both coin margined and stablecoin margined CVD are falling which shows leveraged shorts pressing down. Net Shorts are increasing at the bottom. Open Interest is rising at the same time. This confirms new short positions are opening rather than closing. When spot accumulation meets leveraged short pressure at deep fib support, the stage is set for a squeeze.
The first target above is the 1.618 extension of the A to B leg. This is the expected continuation level after a deep 0.786 retracement. It also aligns with a higher time frame 0.786 level not shown here to keep the chart clean. Confluence at the target strengthens its gravitational pull.
AVAX has swept liquidity, tapped strong fib confluence and attracted late shorts into the structure. All the ingredients for a fast upside squeeze are present.
Summary
• Two fib retracements meet at the current level
• Sunday wick swept which removes weak weekend positions
• Spot CVD rising which shows real buying
• Perp CVD falling which shows leveraged short pressure
• Net Shorts rising at the lows
• Open Interest rising which confirms new shorts opening
• Squeeze conditions forming
• First target is the 1.618 extension of A to B
• This target aligns with a higher time frame 0.786
Final Thought
The market does not shout its intentions. It whispers through structure, flow and confluence. Deep retracements, cleared liquidity and patient accumulation often appear right before sudden expansion. CRYPTOCAP:AVAX feels ready to shift tone and when it does, the shorts gathered at the lows may find themselves riding the squeeze train the wrong way.
Targets and Invalidation
My first target is 17.115, which aligns with the 1.618 extension of the A to B leg and fits the structure of a classic deep retracement continuation.
My second target is 22.5, a level that connects beautifully with mid-range liquidity left behind on the way down and acts as a natural expansion point once the first target is cleared.
For the more mid to long term, I am watching 31.25, which sits directly inside a higher time frame inefficiency zone and marks the beginning of true trend continuation rather than a simple corrective squeeze.
Invalidation sits cleanly at 12.275, the low of point A. If price breaks below that level, the structure of the current idea collapses and the setup no longer fits the narrative of a squeeze. Until that level is violated, the bullish structure remains intact and the path of least resistance stays upward.
----------------
If you like this analysis, feel free to leave a like or a comment. I am not asking for money and I am not trying to sell anything. I simply enjoy helping people look through the noise and understand the structure beneath the chaos.

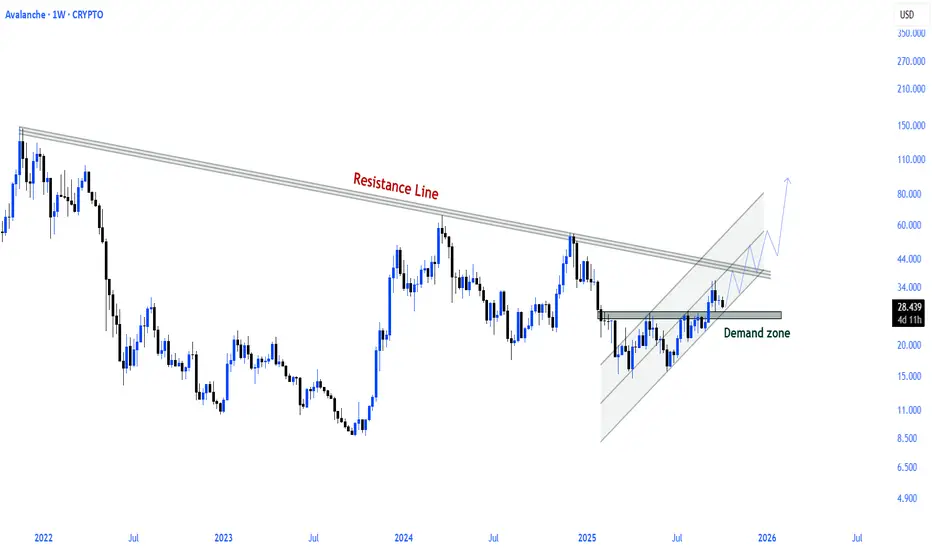
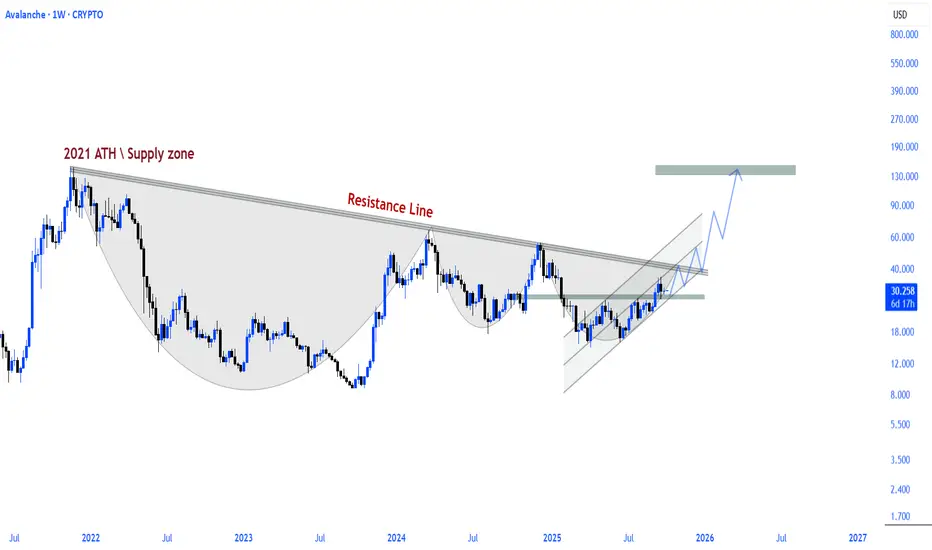
Avalanche AVAX price analysisCRYPTOCAP:AVAX right on the bottom of the 2-year channel!
The price of CRYPTOCAP:AVAX is once again touching the lower boundary of a massive channel that has been forming for more than 24 months.
And what’s interesting — #Avalanche has strong fundamentals, active development, and a “starting” market cap of $5.5B 💰
📈 So… is it finally time for OKX:AVAXUSDT to move up?
🔹 Conservative target: +100% → $26
🔹 Ambitious but realistic: upper channel → $41–42 (+225%)
Looks juicy, right? 🤔
Do you think CRYPTOCAP:AVAX is gearing up for a breakout — or are we in for another round of accumulation?
______________
◆ Follow us ❤️ for daily crypto insights & updates!
🚀 Don’t miss out on important market moves
🧠 DYOR | This is not financial advice, just thinking out loud

AVAX/USDT : LIVE TRADEHello friends
Considering the decline I had, you can see that the price has been supported in our support area and the price has grown well.
Now, given the good growth we had, we have a high and low, which is a sign of the entry of sellers, and this means that the price will correct to the specified areas, and from there we can again expect the price to grow to the specified targets.
This analysis is technically reviewed and is not a buy or sell recommendation, so please follow risk and capital management.
*Trade safely with us*

AVAXUSD 2-year Channel Down starting a rally to $20?Avalanche (AVAXUSD) has been trading within a 2-year Channel Down which made a Lower Low bottom 3 weeks ago. The price has since then traded sideways, potentially in an attempt to price a technical Support base.
If the market doesn't break below this, there are high probabilities to see this pattern initiating a new Bullish Leg. The previous two Bullish Legs showed a declining rate on their rallies with the first hitting the 0.786 Fibonacci level but the second being only able to hit the 0.618 Fib.
If this decreasing rate continues, we shouldn't go much further than the 0.5 Fib this time. With the 1W MA50 (blue trend-line) and the 1M MA50 (red trend-line) posing as the two main Resistance levels of this Bear Cycle, we place our Target below at $20.000.
---
** Please LIKE 👍, FOLLOW ✅, SHARE 🙌 and COMMENT ✍ if you enjoy this idea! Also share your ideas and charts in the comments section below! This is best way to keep it relevant, support us, keep the content here free and allow the idea to reach as many people as possible. **
---
💸💸💸💸💸💸
👇 👇 👇 👇 👇 👇

Algotrading AVAX longPress "Grab this chart", run strategy tester since 2020 and make sure that is good time for a long to yellow line

AVALANCHE is on the verge of a major bullish move! (3D)Based on the structure we previously shared for AVAX in this post (), it seems the same structure is being followed.
The price appears to be in a large ABC, where wave B is a major diametric, and wave G of this diametric is still remaining.
Wave G could complete within the green zone
After this diametric finishes, we expect the price to enter the large wave C
Touching the invalidating level would negate this view.
For risk management, please don't forget stop loss and capital management
When we reach the first target, save some profit and then change the stop to entry
Comment if you have any questions
Thank You

FireHoseReel | AVAX: Building Energy Below Resistance🔥 Welcome To FireHoseReel !
Let’s dive into the analysis of AVAX (Avalanche).
👀 AVAX – 4H Market Structure Overview
On the 4-hour timeframe, after breaking its descending trendline, AVAX showed very strong bullish bias.
Even the pullback after the breakout was very shallow. Price then compressed like a spring and pushed away from the breakout zone with large whale-sized candles.
AVAX is now ranging just below a major resistance.
If this resistance breaks and price holds above it, we can say AVAX is likely to continue its bullish trend.
📊 Volume Analysis
Pay close attention to volume:
• The first volume spike came right after the bearish trendline breakout.
• The second volume increase appeared during the pullback completion at the $13.94 support.
• Now we are seeing the third wave of rising buy volume below resistance. This structure suggests that AVAX may be preparing for another multi-timeframe bullish rally, potentially transferring this momentum into higher timeframes.
✔️ AVAX/BTC – Additional Confirmation Looking at AVAX/BTC gives us a different perspective.
This pair is strongly bullish, confirming that AVAX deserves to stay on our watchlist for potential positions.
AVAX/BTC completed its correction while staying above a bullish curve structure and, just like AVAX/USDT, it is now sitting below resistance.
This resistance creates a trigger at 0.0001654, which is a key breakout level for confirmation.
📌 Trading Scenarios for AVAX, Below are the scenarios you can use alongside your own trading strategy. 👇🏻
🟢 Long Scenario
A breakout above the current AVAX resistance at $13.94, supported by rising buy volume, could start another bullish rally.
However, keep in mind:
• This is still the first direct test of resistance
• Any immediate entry here would be considered high risk
The safer approach is to:
• Wait for a pullback and consolidation
• Then enter after buy volume increases and the pullback structure completes
🔴 Short Scenario
A strong rejection from resistance, followed by:
• A lower high compared to the previous top
• A break of the new local low
• And the appearance of bearish patterns such as Failure Swing or Non-Failure Swing
can offer a valid short entry.
Even if we see equal highs, a confirmed break of the local low can still provide a short opportunity.
🛞 Risk Management & Disclaimer
Please remember to always use proper risk management and position sizing. Nothing in this analysis is financial advice. The market can change quickly, so always trade based on your own strategy, research, and risk tolerance. You are fully responsible for your own trades.

AVAX AVALANCHE 1D - 1W TF Right now I see two possible scenarios:
Bullish scenario:
We hold the current zone and start reversing toward the purple zone (the resistance of the descending channel).
From there we will see how the price reacts — if it breaks above this level, the next targets will begin to play out.
Bearish scenario:
If the current zone does not hold, the price may retest the green channel and possibly even the blue zone.
In any case these are global targets and for now the price action is expected to develop within this broader range.

AVAX on Track — Ready for a ComebackFor me, AVAXUSDT is starting to show clear signs of growth 🚀
The chart structure looks encouraging — I like the way bulls are slowly stepping in and building momentum for a potential move to the upside.
🎯 Target: 18,400
❌ Invalidation zone (stop): 16,789
Let’s see how the market plays it out — the setup looks promising!
⚠️ Disclaimer:
This is not a financial signal. Trade according to your own risk management and never trade without stop-losses.
💬 Drop your reactions and comments below — and hit follow if you’d like me to post regular updates and forecasts on AVAX!

AVAX Rally Keeps Bullish Outlook Intact Avalanche (AVAX) has recently posted significant gains, leaving our outlook unchanged. We continue to believe price is currently in a five-wave magenta upward move, which should soon push it above the resistance level at $36.19. Our alternative scenario also remains valid, in which AVAX could target new absolute lows below support at $8.64 (probability: 33%).

AVAX/USDT – Watching for a Major Support Retest Before ReversalAVAX has been pulling back from recent highs, and we’re now eyeing the $15.00 – $16.50 zone as a critical support area. This level has acted as a strong demand zone historically, and a clean retest here could signal a potential reversal on higher time frames. We are waiting for confirmation before considering any long positions.
📍 Trade Setup (Spot)
Entry Zone: $15.00 – $16.50 (only after support confirmation)
Take Profit Targets:
TP1: $27.00 – $31.50
TP2: $36.00 – $41.00
Stop Loss: Below $13.80

AVAX : Under the priceHello friends
well, technically, this currency has hit its resistance and formed a double top pattern, and here we have found good and strong support, which can be purchased in stages with capital and risk management, and moved with it to the specified target.
From this perspective, you should note that this currency is currently trading below its intrinsic value, and given that it is a good project, there is a good opportunity to buy it with this decline.
*Trade safely with us*

TradeCityPro | AVAXUSDT Further Decline or Time to Rise?👋 Welcome to TradeCityPro Channel!
✨ Let’s move on to Avalanche (AVAX) one of the older coins in the market, mostly active in the DeFi ecosystem with its own network and solid utility. It’s often considered a bull-run project due to its long-term relevance and use cases.
🌐 Overview of Bitcoin
Before we begin, let me remind you that we’ve moved the Bitcoin analysis section to a separate daily report at your request,
so we can go into more detail about Bitcoin’s condition, price action, and dominance:
🕧 In the 4-hour timeframe, after the recent market crash, AVAX is trying to build a new structure and stabilize its price action.
🟢 Long Setup:
It’s still too early to go long, but AVAX has shown a partial recovery compared to other coins, and its drop hasn’t been as deep.
For a long position, we should either range here for a while and enter after a confirmed breakout above 23.04,
Or wait for a higher high and higher low formation to confirm a bullish structure before entering.
🔴 Short Setup:
The short scenario is clear if 20.57 breaks with volume, it would signal bearish continuation, and opening a short position would be reasonable.
📝 Final Thoughts
Stay calm, trade wisely, and let's capture the market's best opportunities!
This analysis reflects our opinions and is not financial advice.
Share your thoughts in the comments, and don’t forget to share this analysis with your friends! ❤️
$AVAX \ AVALANCHE AVAX is trading below the long-term descending resistance line on the weekly chart.
The price is moving within an ascending channel, rebounding upward from a strong demand zone.
This structure signals a potential trend reversal.
If the critical downward trend breakout occurs, a new upward wave will begin in the market structure. The area to watch: weekly close above the resistance line.
Expectations are high, confirmation is required.
$AVAX \ Avalanche Support was found in the demand zone within the rising channel.
It will start running with the break of the major downtrend that began at the 2021 Ath level.
AVAX: Wave Count Adjusted for AVAX After 20% Drop Avalanche (AVAX) has pulled back about 20% from its recent peak since our last update, prompting us to adjust our wave count. At present, we see the coin in green wave , which is subdivided into a beige (a)-(b)-(c) three-part move, with wave (c) currently in progress. Once it bottoms out, wave should also be complete. From there, we expect wave to push AVAX above the newly established resistance at $36.19.

AVAX is Back: Subnets, Upgrades, and Institutional Momentum🚀🧠 AVAX: Subnets, Upgrades, and Institutional Momentum 🔧🏛️
Avalanche (AVAX ) is starting to shape up again — not just on the chart, but at the infrastructure and institutional level too.
As part of the Altcoin Series, I continue to trade these setups while preparing for a time when I’ll divorce alts emotionally and treat them for what they are — assets to be traded, not worshipped.
But right now? This one looks strong.
📊 Chart Breakdown
Left side: Macro chart (8H)
✅ We've just completed a successful third touch of structural support — you can see the 1–2–3 test boxed below the $18.64 level
📍 That’s usually where conviction builds, and reversals are born
🚀 A massive breakout confirmation comes if we close above $22.97 — the level to watch
🧱 Above that, the path opens toward higher fib levels: $27.65 → $35.13 → $43.63 and beyond
Right side: Micro structure (30-min chart)
🔍 A descending wedge or coil forming — typical of consolidation before breakout
This price action is tightening into a decision point, right around $20.80–$21
I expect a breakout soon, with a push toward the macro trigger at $22.97
🧩 What’s New with AVAX?
Avalanche 9000 Upgrade is Live
Major performance overhaul: cheaper subnets, faster deployment
Subnets now act more like sovereign L1s, enhancing utility across the board
Developer cost dropped by over 99%, inviting serious builders
DeFi, Real-World Assets & Ecosystem Growth
TVL > $5B
VanEck’s $100M Treasury Fund now tokenized on Avalanche
Over 515M transactions per month
Real-world integrations with Alipay, California DMV, and more
Enterprise Expansion
FIFA subnet launch (NFTs, tickets, collectibles)
Institutional panels at Avalanche Summit London
Avalanche’s vision: a custom chain for every institution
Retro9000 Grant Program
$40M set aside to fuel L1 growth via subnets
Analysts expect 300% subnet growth by Q4 2025
🧠 The Mindset: Trade, Not Worship
AVAX is a great example of why I'm preparing to divorce altcoins at the cycle top.
It’s gone from hype to silence... and now to real infrastructure momentum.
So yes — I’m bullish.
But I’m not here for belief — I’m here for the structure.
✅ Buy over support
✅ Breakout over $22.97
🛑 Stop-loss if structure fails
🎯 Targets: $27.65 → $35.13 → $43.63+
🏁 Final Word
Avalanche is rebuilding — on-chain, in the real world, and on the chart.
It has subnets, speed, and now institutional backing.
Let’s trade it smart.
Let’s trade it without emotions, do your risk management and don't listen to me.
One Love,
The FXPROFESSOR 💙
Disclosure: I am happy to be part of the Trade Nation's Influencer program and receive a monthly fee for using their TradingView charts in my analysis. Awesome broker, where the trader really comes first! 🌟🤝📈

AVAX | Up 56% — Watching Pullback for Long Setup Near $26AVAX has rallied over 56% since our previous idea and is now trading into major resistance. This zone may trigger a short-term rejection, presenting a solid swing trade setup on a pullback.
We’re watching for a retrace toward the $26 support zone, where limit orders are planned. If price reacts positively, this offers a favorable risk/reward entry into the next bullish leg.
📉 Trade Plan:
• Entry Zone: $26.00
• Targets: $29.00–$33.00, $38.00–$42.00
• Stop Loss: Below $23.00
#AVAX #Avalanche #CryptoTrading #Altcoins #SwingTrade #TechnicalAnalysis #CryptoSetup #AVAXUSDT #CryptoStrategy #CryptoCharts #Resistance #SupportZone #PriceAction #RiskReward
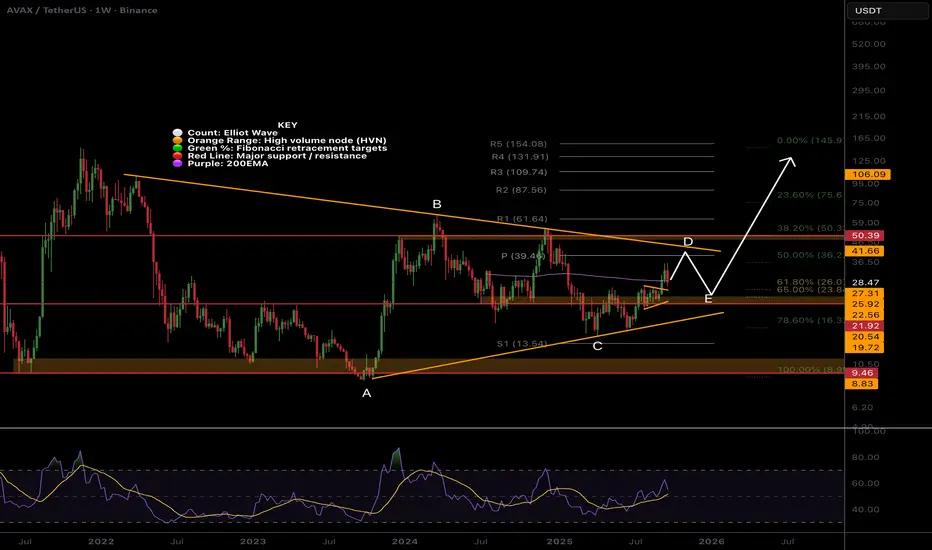
AVAX Local interior triangle completeMouthful ahead:
AVAX appears to have completed a triangle as interior wave (b) of (c) of the macro triangle wave D... sorry
(c) ended perfectly at the 1:1 ration of the (a) - (b) which is expected.
Wave E is underway with the triple support target of the daily 200EMA, pivot and High Volume Node.
Safe trading
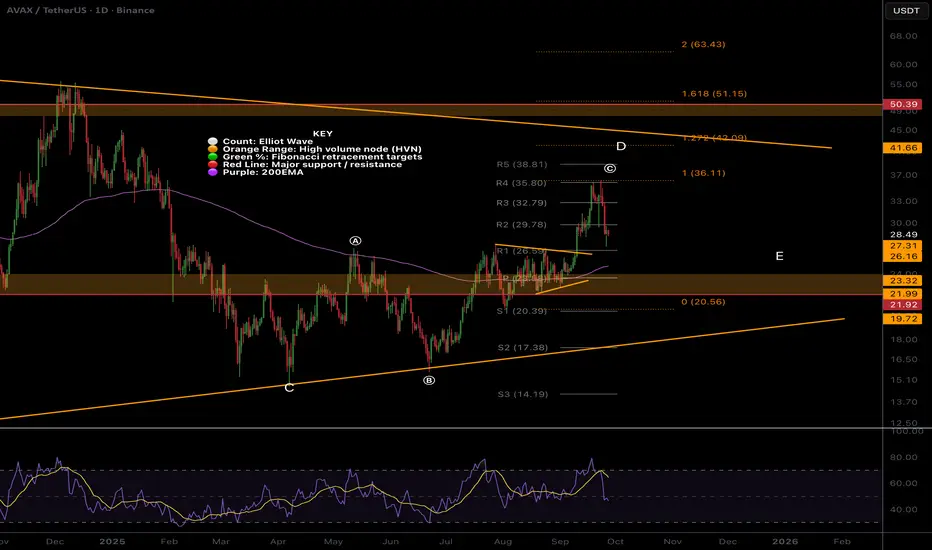
AVAX Macro Triangle?CRYPTOCAP:AVAX is printing a macro triangle similar to CRYPTOCAP:XRP did before it moved x10 in late 2024. The series of ABCs and Fibonacci depths gives this away.
Wave D could be complete but has not reached the resistance line and weekly pivot so I may have one more push up to go.
Wave E is expected to end at the weekly 200EMA to the High Volume Node as it doesn't test the support diagonal line by its characteristics.
This would also have triangle correction complete at the golden pocket adding confluence to the area.
Triangle pattern target is high and we could see a move to the R5 weekly pivot at $150 to test the all time high one more time.
Weekly RSI has bullish divergence from wave C.
Safe trading