Cryptolean Avalanche AVAX Update After a fast bearish dip to the key daily support at $37 and 100-Day Moving Average, Avalanche recovered strongly and now is trading in the bullish territory, holding the current daily support at $41.65.
A bullish move from $41.65 towards the previous local high and the key daily resistance zone of $47-$49 is very likely.
The AVAX price action with this zone will be very important.
A bearish dip to below $41.65 will result in AVAX price declining to re-test $37 and an interaction with the minor support at $39.5.
The AVAXUSDT 4-Hour chart is trying to re-claim $42.87.
A bullish move from its current price location is likely and will push #Avalanche to the key intraday resistance zone of $46.76-$48.26.
A bearish dip to below$42.87 towards $41.21 or, even better, to $39.57 and a bullish rejection of one of these levels could offer a long trade towards $46.76-$48.26 and higher.
AVAX will follow $BTC. A strong bearish rejection of $69,654-$73,422 in the BTCUSD daily chart will lead to the weakness of the whole #crypto market and AVAX won't be an exception.
Like once read.
Thank you!
Avalancheusdt

Long AVAX to $46+I suspect AVAX will form a double-top before more pullback. Cup and handle pattern is now in play and takes us just shy of our $48 price. I plan to some (maybe half) of around 42. I will then move my SL to break even and let the rest ride, trailing stops as we go.

AVAX: Channel Down BreakoutTrade setup : Bullish breakout from a Channel Down pattern, which was confirmed by a break above $35 resistance as well. Price could swing up to $40-$43 range near term for a +20% gain. Stop Loss at $32 (just below the last swing low).
Pattern : Price was trading in a Channel Down pattern. With emerging patterns, traders who believe the price is likely to remain within its channel can initiate trades when the price fluctuates within its channel trendlines. With complete patterns (i.e. a breakout) – initiate a trade when the price breaks through the channel’s trendlines, either on the upper or lower side. When this happens, the price can move rapidly in the direction of that breakout.
Trend : Neutral on Short-Term basis and Uptrend on Medium- and Long-Term basis.
Momentum is Mixed as MACD Line is above MACD Signal Line (Bullish) but RSI ~ 50 (Neutral). MACD Histogram bars are declining, which suggests that momentum is weakening.
Support and Resistance : Nearest Support Zone is $25, then $19. The nearest Resistance Zone is $35, then $50.

AVAX: Channel Down BreakoutTrade setup : Bullish breakout from a Channel Down pattern, which was confirmed by a break above $35 resistance as well. Price could swing up to $40-$43 range near term for a +20% gain. Stop Loss at $32 (just below the last swing low).
Pattern : Price was trading in a Channel Down pattern. With emerging patterns, traders who believe the price is likely to remain within its channel can initiate trades when the price fluctuates within its channel trendlines. With complete patterns (i.e. a breakout) – initiate a trade when the price breaks through the channel’s trendlines, either on the upper or lower side. When this happens, the price can move rapidly in the direction of that breakout.
Trend : Neutral on Medium-Term basis and Uptrend on Short- and Long-Term basis.
Momentum is Mixed as MACD Line is above MACD Signal Line (Bullish) but RSI ~ 50 (Neutral).
Support and Resistance : Nearest Support Zone is $25, then $19. The nearest Resistance Zone is $35, which it broke, then $50.

Avalanche AvaxWhat is Avalanche?
Avalanche is the fastest smart contracts platform in the blockchain industry, as measured by time-to-finality. Avalanche is blazingly fast, low cost, and eco-friendly. Any smart contract-enabled application can outperform its competition by deploying on Avalanche.
Avalanche launched on mainnet, September 21, 2020. Since then, the platform has grown to secure over 400+ individual projects, $64M+ of AVAX burned (reducing supply), 1,200+ individual block-producing validators, and over 1.3M+ community members around the globe.
- Strong Project, " TP Numbers " are very simple.
- i didnt include Fibo calculations to keep the chart clean but i've done it
-----------------------------------------------
Trading Plan
-----------------------------------------------
Buy : Now
Rebuy : 50$ Zone is a gift
-----------------------------------------------
TP1 : 150$ (ATH Security TP)
TP2 : 200$
TP3 : 300$
SL : 40$ if you want to set it
-----------------------------------------------
Happy Tr4Ding!

AVAX: Channel DownTrade setup : After getting rejected at $50 resistance, price has been pulling back, forming a Channel Down pattern. It appears on the brink of a breakout but it’s too early to tell. We wait for confirmation, if price can break above $35 key level.
Pattern : Price is trading in a Channel Down pattern. With emerging patterns, traders who believe the price is likely to remain within its channel can initiate trades when the price fluctuates within its channel trendlines. With complete patterns (i.e. a breakout) – initiate a trade when the price breaks through the channel’s trendlines, either on the upper or lower side. When this happens, the price can move rapidly in the direction of that breakout.
Trend : Neutral on Short- and Medium-Term basis and Uptrend on Long-Term basis.
Momentum is Mixed as MACD Line is below MACD Signal Line (Bearish) but RSI ~ 50 (Neutral). MACD Histogram bars are rising, which suggests that momentum could be nearing another upswing.
Support and Resistance : Nearest Support Zone is $25, then $19. The nearest Resistance Zone is $35 (previous support), then $50.

AVAX: Channel DownTrade setup : After getting rejected at $50 resistance, price has been pulling back, forming a Channel Down pattern. Notice that the price is also nearing oversold levels (RSI ~ 30) just as it approaches $25 support. That’s also 78.60% Fibonacci Retracement level (potential support) of $25.70. Hence, near term, we could see price bounce up to $30.
Pattern : Price is trading in a Channel Down pattern. With emerging patterns, traders who believe the price is likely to remain within its channel can initiate trades when the price fluctuates within its channel trendlines. With complete patterns (i.e. a breakout) – initiate a trade when the price breaks through the channel’s trendlines, either on the upper or lower side. When this happens, the price can move rapidly in the direction of that breakout.
Trend : Downtrend on Short-Term basis, Neutral on Medium-Term basis and Uptrend on Long-Term basis.
Momentum is Bearish (MACD Line is below MACD Signal Line, and RSI is below 45).
Support and Resistance : Nearest Support Zone is $25, then $19. The nearest Resistance Zone is $35 (previous support), then $50.

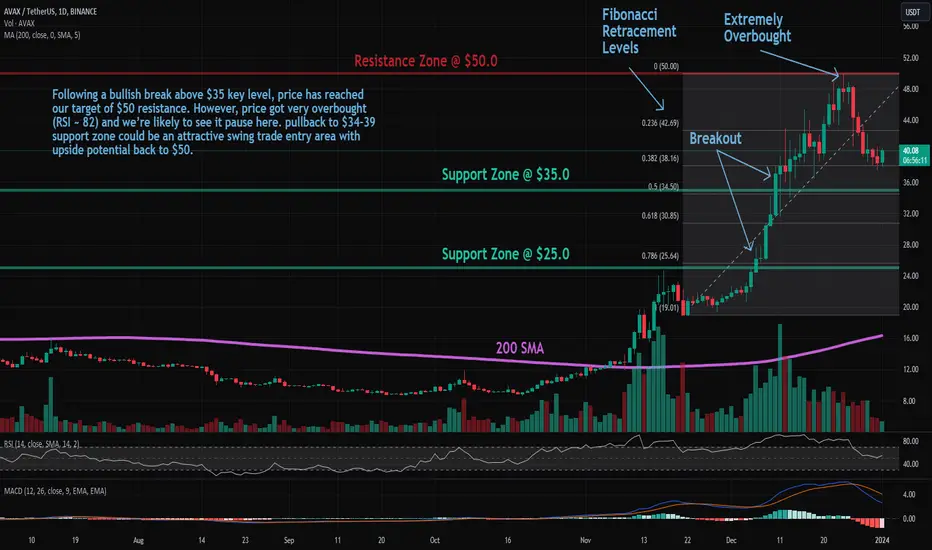
AVAX: Pullback in UptrendTrade setup : Following a bullish break above $35 key level, price reached our target of $50 resistance. However, price got very overbought (RSI ~ 82) and price has pulled back on some profit taking. The nearest horizontal support is $35 while the nearest Fibonacci Retracement levels (possible support) are $38 (38.20%), $34 (50%), and $31 (61.80%). Hence, pullback to $34-39 support zone could be an attractive swing trade entry area with upside potential back to $50. Stop Loss (SL) at $32 (just below prior swing low).
Trend : Downtrend on Short-Term basis and Uptrend on Medium- and Long-Term basis.
Momentum is Mixed as MACD Line is below MACD Signal Line (Bearish) but RSI ~ 50 (Neutral). MACD Histogram bars are rising, which suggests that momentum could be nearing another upswing.
Support and Resistance : Nearest Support Zone is $35, then $25. The nearest Resistance Zone is $50.

AVAX: Pullback in UptrendTrade setup : Following a bullish break above $35 key level, price reached our target of $50 resistance. However, price got very overbought (RSI ~ 82) and price has pulled back on some profit taking. The nearest horizontal support is $35 while the nearest Fibonacci Retracement levels (possible support) are $38 (38.20%), $34 (50%), and $31 (61.80%). Hence, pullback to $34-39 support zone could be an attractive swing trade entry area with upside potential back to $50. Stop Loss (SL) at $32 (just below prior swing low).
Trend : Uptrend across all time horizons (Short- Medium- and Long-Term).
Momentum is Mixed as MACD Line is below MACD Signal Line (Bearish) but RSI ~ 50 (Neutral). MACD Histogram bars are rising, which suggests that momentum could be nearing another upswing.
Support and Resistance : Nearest Support Zone is $35, then $25. The nearest Resistance Zone is $50.

AVAX: Pullback in UptrendTrade setup : Following a bullish break above $35 key level, price reached our target of $50 resistance. However, price got very overbought (RSI ~ 82) and price has pulled back on some profit taking. The nearest horizontal support is $35 while the nearest Fibonacci Retracement levels (possible support) are $38 (38.20%), $34 (50%), and $31 (61.80%). Hence, pullback to $34-39 support zone could be an attractive swing trade entry area with upside potential back to $50. Stop Loss (SL) at $32 (just below prior swing low).
Trend : Neutral on Short-Term basis and Uptrend on Medium- and Long-Term basis.
Momentum is Bearish (MACD Line is below MACD Signal Line, and RSI is below 45).
Support and Resistance : Nearest Support Zone is $35, which it broke, then $25. The nearest Resistance Zone is $50.

In trend-bear (AVAX)📊Analysis by AhmadArz:
Next break renge
🔍Entry: 33.416
🛑Stop Loss: 34.504
🎯Take Profit: 32.346
🔗"Uncover new opportunities in the world of cryptocurrencies with AhmadArz.
💡Join us on TradingView and expand your investment knowledge with our five years of experience in financial markets."
🚀Please boost and💬 comment to share your thoughts with us!

AVAX: Pullback in UptrendTrade setup : Following a bullish break above $35 key level, price reached our target of $50 resistance. However, price got very overbought (RSI ~ 82) and price has pulled back on some profit taking. The nearest horizontal support is $35 while the nearest Fibonacci Retracement levels (possible support) are $38 (38.20%), $34 (50%), and $31 (61.80%). Hence, pullback to $34-39 support zone could be an attractive swing trade entry area with upside potential back to $50. Stop Loss (SL) at $32 (just below prior swing low).
Trend : Neutral on Short-Term basis and Uptrend on Medium- and Long-Term basis.
Momentum is Mixed as MACD Line is below MACD Signal Line (Bearish) but RSI ~ 50 (Neutral).
Support and Resistance : Nearest Support Zone is $35 (previous resistance), then $25. The nearest Resistance Zone is $50.

AVAX: Pullback in UptrendTrade setup : Following a bullish break above $35 key level, price has reached our target of $50 resistance. However, price got very overbought (RSI ~ 82) and we’re seeing some profit taking. Now we wait for the right entry area (support). How far could it pull back? The nearest horizontal support is $35 and the nearest Fibonacci Retracement levels (possible support) are $38 (38.20%), $34 (50%), and $31 (61.80%). Hence, pullback to $34-39 support zone could be an attractive swing trade entry area with upside potential back to $50.
Trend : Uptrend across all time horizons (Short- Medium- and Long-Term).
Momentum is Mixed as MACD Line is below MACD Signal Line (Bearish) but RSI ~ 50 (Neutral).
Support and Resistance : Nearest Support Zone is $35 (previous resistance), then $25. The nearest Resistance Zone is $50.
AVAX: Pullback in UptrendTrade setup : Following a bullish break above $35 key level, price has reached our target of $50 resistance. However, price got very overbought (RSI ~ 82) and we’re seeing some profit taking. Now we wait for the right entry area (support). How far could it pull back? The nearest horizontal support is $35 and the nearest Fibonacci Retracement levels (possible support) are $38 (38.20%), $34 (50%), and $31 (61.80%). Hence, pullback to $34-38 support zone could be an attractive swing trade entry area with upside potential back to $50.
Trend : Uptrend across all time horizons (Short- Medium- and Long-Term).
Momentum is Mixed as MACD Line is below MACD Signal Line (Bearish) but RSI > 55 (Bullish).
Support and Resistance : Nearest Support Zone is $35 (previous resistance), then $25. The nearest Resistance Zone is $50.

AVAX: Overbought at ResistanceTrade setup : Following a bullish break above $35 key level, price has reached out target of $50 resistance. However, price got very overbought (RSI ~ 82) and we’re likely to see it pause here on some profit taking.
Trend : Uptrend across all time horizons (Short- Medium- and Long-Term).
Momentum is Bullish but extremely overbought. (MACD Line is above MACD Signal Line). RSI is bullish (> 55) but extremely overbought (> 80) which could imply that price could briefly pause or pull back if it reaches Resistance.
Support and Resistance : Nearest Support Zone is $35 (previous resistance), then $25. The nearest Resistance Zone is $50.

AVAX: Resistance BreakoutTrade setup : Bullish break above $35 key level signaled continuation of uptrend. However, price got very overbought (RSI ~ 90) and we’re likely to see it pause here on some profit taking. Nearest horizontal support zone is at $35 while the nearest Fibonacci Retracement levels (possible support) are $39 (23.60%) and $35 (38.20%). Hence, it appears that $35-$36 could be an attractive swing trade entry area in Uptrend, with upside potential to $50 thereafter.
Trend : Uptrend across all time horizons (Short- Medium- and Long-Term).
Momentum is Bullish but inflecting. MACD Line is above MACD Signal Line and RSI is above 55 but momentum may have peaked since MACD Histogram bars are declining, which suggests that momentum is weakening.
Support and Resistance : Nearest Support Zone is $35 (previous resistance), then $25. The nearest Resistance Zone is $50.

AVAX: Resistance BreakoutTrade setup : Bullish break above $35 signaled continuation of uptrend. However, price is now very overbought (RSI ~ 90) and we’re likely to see it pause here on some profit taking.
Trend : Uptrend across all time horizons (Short- Medium- and Long-Term).
Momentum is Bullish but extremely overbought. ( MACD Line is above MACD Signal Line). RSI is bullish (> 55) but extremely overbought (> 80) which could imply that price could briefly pause or pull back if it reaches Resistance.
Support and Resistance : Nearest Support Zone is $35 (previous resistance), then $25. The nearest Resistance Zone is $50.

AVAX Continued its Upward TrajectoryAvalanche (AVAX)
Despite Bitcoin's recent decline to the $40,000 mark, AVAX has continued its upward trajectory this December. In the last fortnight, the asset has surged by 66%, hitting a new annual high at $42.96.
Currently, AVAX is undergoing a correction, with its price hovering around the support zone of $32.7-$34.7. The key resistance level to watch is $38.4. If breached, the coin might retest the higher resistance zone of $40.7-$43.0.
The future course of AVAX will heavily depend on Bitcoin's trend. A continued downtrend in BTC could potentially drag AVAX down to new lows, possibly to $30.5 or the $26.2-$28.4 level.

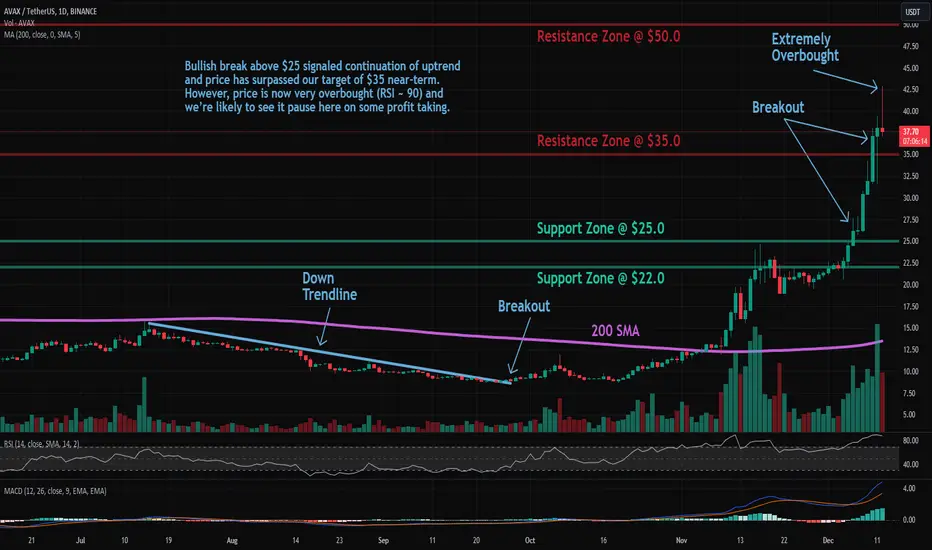
AVAX: Resistance BreakoutAvalanche (AVAX) technical analysis:
Trade setup : Bullish break above $25 signaled continuation of uptrend and price has surpassed our target of $35 near-term. However, price is now very overbought (RSI ~ 90) and we’re likely to see it pause here on some profit taking.
Trend : Uptrend across all time horizons (Short- Medium- and Long-Term).
Momentum is Bullish but extremely overbought. ( MACD Line is above MACD Signal Line). RSI is bullish (> 55) but extremely overbought (> 80) which could imply that price could briefly pause or pull back if it reaches Resistance.
Support and Resistance : Nearest Support Zone is $25 (previous resistance), then $20. The nearest Resistance Zone is $35, which it broke, then $50.
Celebrate the Avalanche's Unstoppable Rise!
It brings me immense pleasure to inform you that Avalanche continues to dominate the crypto space, with its price soaring higher than ever before, effortlessly surpassing the moving average. This remarkable achievement is a testament to the incredible potential and resilience of the Avalanche ecosystem.
Are you ready to ride the wave of success with Avalanche? If so, then consider this idea your invitation to join the Long Avalanche Movement today
Here's why I believe Avalanche is a golden opportunity worth exploring:
1. Unparalleled Performance: Avalanche has consistently outperformed market expectations, demonstrating its strength and stability amidst turbulent times. Its upward trajectory has been extraordinary, instilling confidence and excitement among traders worldwide.
2. Innovative Technology: Powered by Avalanche's groundbreaking consensus protocol, the platform offers lightning-fast transactions and low fees, making it an attractive choice for both institutional and retail investors. The ecosystem's commitment to innovation and scalability sets it apart from the competition.
3. Growing Adoption: Avalanche's popularity is on the rise, with an increasing number of projects and developers choosing to build on its robust infrastructure. The expanding ecosystem clearly shows the platform's widespread acceptance and potential for long-term growth.
So, how can you get involved and seize this opportunity? Here's your call to action:
1. Research and Educate Yourself: Dive into the world of Avalanche and familiarize yourself with its unique features, use cases, and potential. Understanding the technology and its implications will empower you to make informed investment decisions.
2. Stay Updated: Keep a close eye on Avalanche's latest news, project updates, and market trends. Follow reputable sources, join the community forums, and engage in discussions to gain valuable insights and stay ahead of the curve.
3. Take Action: When you feel confident and ready, consider adding Avalanche to your investment portfolio. Whether you're a seasoned trader or a beginner, there are various avenues available to participate in the Avalanche ecosystem, including spot trading, staking, and yield farming.
So, what are you waiting for? Join the Long Avalanche Movement.

AVAX: Overbought at ResistanceTrade setup : Bullish break above $25 signaled continuation of uptrend and price has surpassed our target of $30 near-term. However, price is now very overbought (RSI ~ 75) just as it reached that $35 resistance. Hence, near-term, we’re likely to see it pause here on some profit taking. Previously, price broke above 200-day moving average, which confirmed a bullish trend reversal to an Uptrend.
Trend : Uptrend across all time horizons (Short- Medium- and Long-Term).
Momentum is Bullish but extremely overbought. ( MACD Line is above MACD Signal Line). RSI is bullish (> 55) but extremely overbought (> 80) which could imply that price could briefly pause or pull back if it reaches Resistance.
Support and Resistance : Nearest Support Zone is $25.0 (previous resistance), then $22.0. The nearest Resistance Zone is $30.0, which it broke, then $35.0.

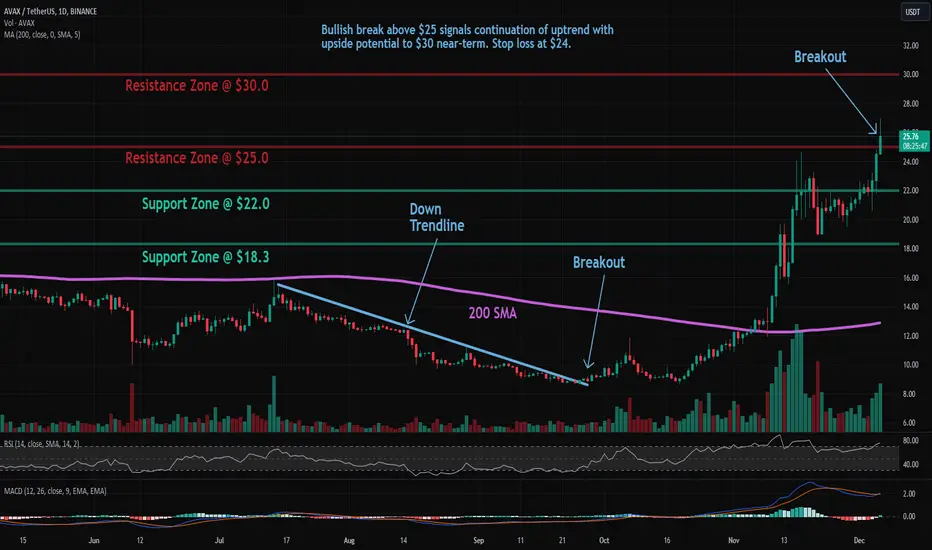
AVAX: Resistance BreakoutAvalanche (AVAX) technical analysis:
Trade setup : Bullish break above $25 signals continuation of uptrend with upside potential to $30 near-term. Stop loss at $24. Previously, price broke above 200-day moving average, which confirmed a bullish trend reversal to an Uptrend.
Trend : Uptrend across all time horizons (Short- Medium- and Long-Term).
Momentum is Bullish (MACD Line is above MACD Signal Line and RSI is above 55).
Support and Resistance : Nearest Support Zone is $22.0 (previous resistance), then $18.3. The nearest Resistance Zone is $25.0, which it broke, then $30.0.
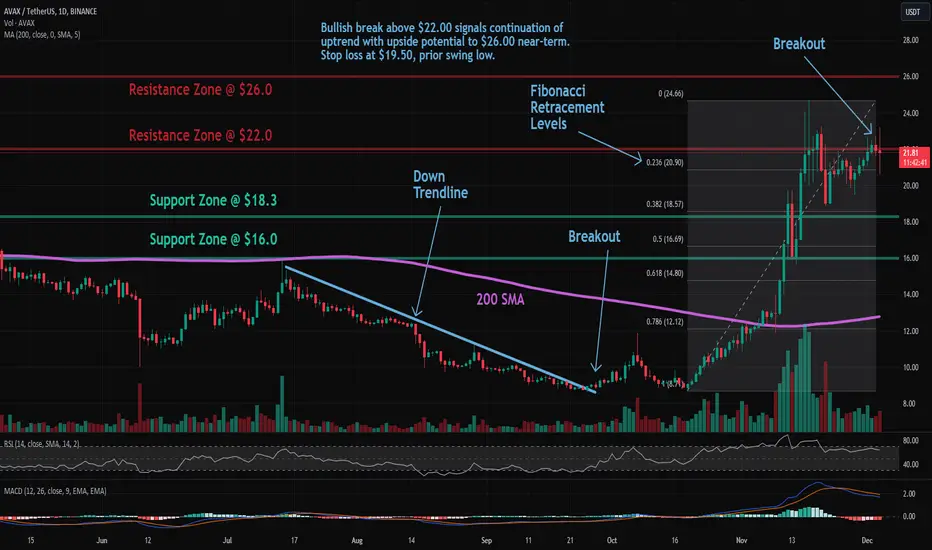
AVAX: Pullback in UptrendAvalanche (AVAX) technical analysis:
Trade setup : Bullish break above $22.00 signals continuation of uptrend with upside potential to $26.00 near-term. Stop loss at $19.50, prior swing low. Previously, price broke above 200-day moving average, which confirmed a bullish trend reversal to an Uptrend. Subsequently, price spiked as high as $24.70 but failed to hold that as traders began to take profits (selling pressure).
Trend : Uptrend across all time horizons (Short- Medium- and Long-Term).
Momentum is Mixed as MACD Line is below MACD Signal Line (Bearish) but RSI > 55 (Bullish). MACD Histogram bars are rising, which suggests that momentum could be nearing another upswing.
Support and Resistance : Nearest Support Zone is $18.3 (previous resistance), then $16.0. The nearest Resistance Zone is $22.0, then $26.0.