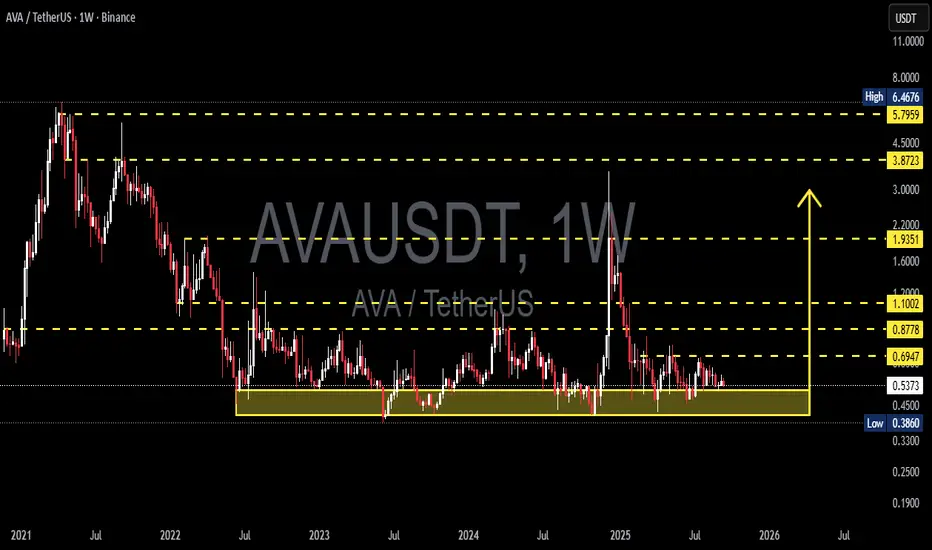
AVA/USDT —Demand Zone: Accumulation or Deeper Breakdown?📌 Overview
The AVA/USDT weekly chart shows a dramatic journey:
From the 2021 peak ($6–7), price has been in a prolonged downtrend followed by sideways consolidation since 2022.
For nearly 3 years, the yellow zone ($0.38 – $0.45) has acted as a battlefield between buyers and sellers.
Each test of this area has resulted in strong rebounds, marking it as a major demand zone.
Now, AVA is once again hovering near this critical support. The big question: Is this the ultimate long-term accumulation zone or the start of a deeper breakdown?
---
🔍 Pattern & Structure Analysis
Macro trend: Bearish since 2021 → long consolidation from 2022–2025.
Dominant pattern: Wide sideways range with a solid base at 0.38–0.45 and tiered resistances at 0.69, 0.87, 1.10, 1.93.
Price character:
Multiple lower wicks into demand zone → sign of liquidity grabs and potential accumulation by bigger players.
Prolonged sideways near lows suggests a possible bottoming formation.
However, compression against support can also lead to a breakdown if bulls lose control.
---
🟢 Bullish Scenario
If buyers defend 0.38–0.45 and push higher:
1. First confirmation: Weekly close above 0.6947.
2. Upside targets:
0.8778 → first mid-term resistance.
1.1002 → psychological & structural breakout zone.
1.9351 → major resistance, early trend reversal confirmation.
3. With strong momentum, a revisit of 3.87 – 5.79 (the 2021 supply zone) remains possible in the next bull cycle.
(Potential gains: +63% to 0.87 / +105% to 1.10 from current price ~0.53).
---
🔴 Bearish Scenario
If a strong weekly close below 0.386 occurs:
1. The 3-year demand zone will fail → showing buyers have lost control.
2. Downside target: 0.25 – 0.19 as the next realistic demand area.
3. Extreme measured-move projection even points to 0.07 (though unlikely, it must be considered).
(Downside risk: −53% to 0.25 from current price).
---
📊 Key Takeaways
$0.38–0.45 = pivotal demand zone for AVA’s next cycle.
Breakout above 0.69 = early bullish signal.
Breakdown below 0.38 = opens risk of new all-time lows.
This zone will decide whether AVA enters a new accumulation phase or faces final capitulation.
---
Critical demand zone = 0.38–0.45.
Watch 0.6947 breakout for bullish bias.
Watch 0.386 breakdown for bearish continuation.
Momentum will reveal if this is smart money accumulation or a last leg down.
---
#AVA #AVAUSDT #CryptoAnalysis #WeeklyChart #Altcoins #TechnicalAnalysis #SupportResistance #CryptoTrading #ChartPatterns
Avausdc
AVA/USDT Ready to Explode from Multi-Year Accumulation Zone! 📊 Technical Breakdown:
Major Accumulation Zone (Strong Support):
Price is currently trading within a long-term accumulation zone between $0.3860 - $0.5095 (highlighted in yellow). This zone has been tested multiple times since 2022 and has proven to be strong support.
Reversal Potential:
A projected upward movement from this support zone suggests a potential bullish reversal. Historically, AVA has shown strong rebounds from this area. A breakout with bullish weekly candles will likely confirm the uptrend.
🎯 Key Resistance Targets (Upon Successful Breakout):
1. $0.6947 – First major resistance, crucial for trend confirmation.
2. $0.7504 - $0.8778 – Short-term profit-taking zones.
3. $1.1002 - $1.9351 – Medium-term targets with historical consolidation.
4. $3.8723 - $5.7959 – Long-term targets if a full bull cycle resumes.
📉 Risk Management:
A breakdown below the accumulation zone (below $0.3860) will invalidate the bullish setup.
Beware of fakeouts — wait for weekly candle confirmation before entering.
📌 Conclusion:
AVA is at a critical juncture, sitting on a historically strong accumulation base. A breakout could ignite a significant bullish rally toward key resistance levels. Ideal entry lies near the current support with a tight stop-loss strategy.
#AVA #AVAUSDT #CryptoAnalysis #AltcoinSetup #TechnicalBreakout #BullishReversal #SupportZone #SwingTrade #Binance #CryptoSignals

AVAUSDT 1WAVA ~ 1W Analysis
#AVA Buy back gradually from here with a short -term target of at least 20%+. This is a very good support for now.

AVAUSDT 1WAVA ~ 1W Analysis
#AVA Buy gradually from here if you still have a Conviction on this coin with a short -term target of at least 20%+.

AVAUSDT 1WAVA Update ~ 1W
#AVA So far it still maintains its bullish structure. If you still have Conviction on this coin,. Buy from here, target minimum 20%+

AVA USDT Big Move ComingHello
AVA USDT
Best buy area Green Level
Sell targets on chart (Red Lines).
DCA & DYOR Plz.

AVAUSDT: A High-Potential Opportunity?AVAUSDT has caught attention with a significant increase in trading volume and an evident rise in buyer interest. This combination signals growing momentum that could pave the way for a strong upward move.
Why AVAUSDT Stands Out:
Buyer Surge:
The influx of buyers indicates heightened demand, which, if sustained, could fuel a breakout.
Market Cap vs. Volume:
With a market capitalization of only $4 million but a trade volume surpassing its market size, AVA stands in a unique position. This suggests that it is currently undervalued relative to the activity around it.
Binance Listing:
Being listed on a major exchange like Binance adds credibility and increases accessibility, which can attract more investors.
Risk Reminder:
While the potential upside is compelling, remember that cryptocurrency remains the riskiest market. Market dynamics can shift rapidly, so thorough risk management is essential.
If buyer momentum persists, AVAUSDT could present a remarkable opportunity for those seeking high-risk, high-reward plays. Keep an eye on the volume and price action for further confirmation.
I keep my charts clean and simple because I believe clarity leads to better decisions.
My approach is built on years of experience and a solid track record. I don’t claim to know it all, but I’m confident in my ability to spot high-probability setups.
My Previous Analysis
🐶 DOGEUSDT.P: Next Move
🎨 RENDERUSDT.P: Opportunity of the Month
💎 ETHUSDT.P: Where to Retrace
🟢 BNBUSDT.P: Potential Surge
📊 BTC Dominance: Reaction Zone
🌊 WAVESUSDT.P: Demand Zone Potential
🟣 UNIUSDT.P: Long-Term Trade
🔵 XRPUSDT.P: Entry Zones
🔗 LINKUSDT.P: Follow The River
📈 BTCUSDT.P: Two Key Demand Zones
🟩 POLUSDT: Bullish Momentum
🌟 PENDLEUSDT: Where Opportunity Meets Precision
🔥 BTCUSDT.P: Liquidation of Highly Leveraged Longs
🌊 SOLUSDT.P: SOL's Dip - Your Opportunity
🐸 1000PEPEUSDT.P: Prime Bounce Zone Unlocked
🚀 ETHUSDT.P: Set to Explode - Don't Miss This Game Changer
🤖 IQUSDT: Smart Plan

AVAUSDT Expecting a bull move as ORDER Block availabilityAVAUSDT Expecting a bull move as ORDER Block availability, i am expecting up move avabnb

AVA token price prediction (Crypto)AVA token price prediction , I am expecting a range before getting strength in this token depending on BTC Move avabtc

Travala.com (AVA) formed bullish Gartley for upto 102% pumpHi dear friends, hope you are well, and welcome to the new update on Travala.com (AVA) token with US Dollar pair.
Recently, we had a nice trade of AVA:
Now on On a 4-hr time frame, AVA has formed a bullish Gartley pattern:
Note: Above idea is for educational purpose only. It is advised to diversify and strictly follow the stop loss, and don't get stuck with trade

AVA is still sleepinghey traders, there is AVA, we need a close above the blue line for 1D bar to get the green line (short term's targets)
the yellow lines (long term's targets) and the stop loss is a close under the red line for 1D bar
DON'T ENTER BEFORE THE CLOSING!!
.
trade carefully guys and don't forget the risk management.
.
.
.
.
.
.
.

AVA TRAVALA.COM EXPECTED TGT - AVABTC AVAUSDT AVAUSD AVAUSDCAVA TRAVALA.COM EXPECTED TGT - AVABTC AVAUSDT AVAUSD AVAUSDC
