AVAXUSDTAVAXUSDT have a uptrend and is now this trend because we have higher high and higher low.
Next Target is 45$ and best levels for buy: 31$ - 27$
⚠️Please control risk management.
Avax

AVAX — Next Stop $40?AVAX has been one of the stronger high-cap performers recently, but the yearly open at $36 has proven to be a tough ceiling. Price has rejected this level three times already, each time offering short opportunities. This level also aligns with the 15B market cap, making it a key resistance zone.
Now, AVAX is retracing into a prime area for long setups, retracing part of the recent 5-wave impulse.
🟢 Long Entry Zone
0.618 Fib retracement: $32 → first bounce zone
0.786 Fib retracement: $30.85 → deeper entry opportunity
0.886 Fib retracement: $30 → highest confluence long entry
Invalidation: Below $29.41 (origin of the impulse)
Confluence at $30
The $30 level is the strongest support cluster, backed by multiple technical factors:
POC of this trading range
0.886 Fib retracement of the impulse
21 EMA/SMA (daily timeframe)
Anchored VWAP support
$30 psychological round number
0.618 Fib speed fan support
This makes laddering entries from $32 down to $30 the most optimal approach.
Targets
First Target: $36 yearly open → retest of major resistance (fourth attempt)
Main Target: $40 resistance cluster → 0.618 Fib retracement, negative -0.618 Fib extension
R:R: 1:3 up to 1:6 depending on entry
Educational Insight
When analysing trades, confluence is king. A single indicator may provide a signal, but when multiple tools align at the same level the probability of that zone holding increases significantly.
The $30 zone for AVAX is a great example of confluence stacking. This doesn’t guarantee success, but it gives traders a defined edge with a clear invalidation point. The same logic applies to resistance: at $40, multiple technical layers align, making it a high-probability take-profit zone.
Quick Take
AVAX is pulling back into a stacked support zone. With solid confluence at $30–$32, this zone sets up the fourth attempt at breaking the $36 yearly open resistance.
And as the saying goes in trading: the 4th touch often breaks. If it does, AVAX could quickly rally toward the $40 resistance cluster, where multiple confluences align.
Indicators used
DriftLine — Pivot Open Zones → For identifying key yearly/monthly/weekly/daily opens that act as major S/R reference points
Multi Timeframe 8x MA Support Resistance Zones → to identify support and resistance zones such as the Daily 21 EMA/SMA.
LuxAlgo — Liquidity Sentiment Profile (Auto-Anchored)
➡️ Available for free. You can find it on my profile under “Scripts” and apply it directly to your charts for extra confluence when planning your trades.
_________________________________
💬 If you found this helpful, drop a like and comment!
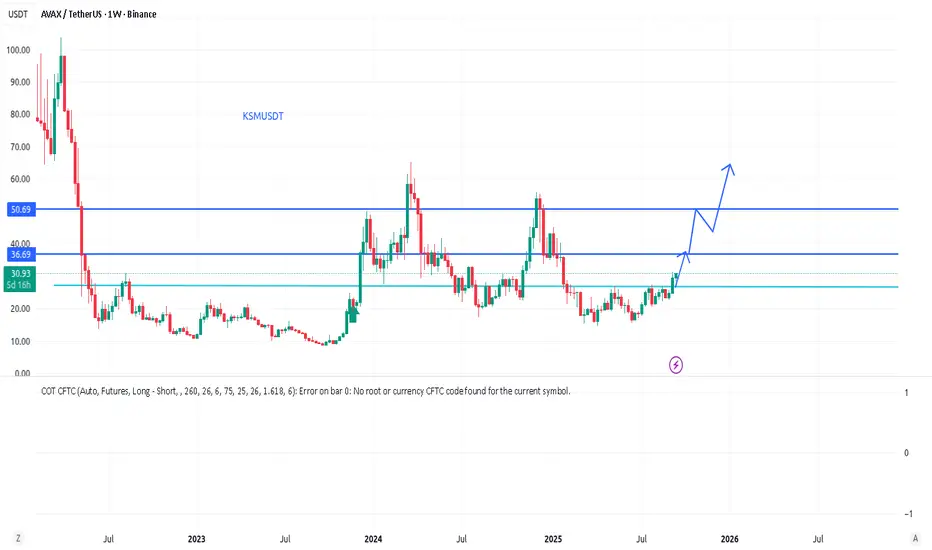
AVAXUSD Channel Up $28 pull-back or break-out to $47??Avalanche (AVAXUSD) has been trading within a 3-month Channel Up and last Friday hit its top (Higher Highs trend-line).
It is no surprise that the price got rejected and turned sideways there as it also completed a +75% rise from the last Higher Low, which is exactly what the previous Bullish Leg did. That structure eventually pulled back to its 1D MA50 (blue trend-line) and the 0.5 Fibonacci retracement level before pricing the Higher Low.
As a result, we expect a decline towards the 1D MA50, targeting $28.00, as long as the Channel Up doesn't break upwards.
If it does however, we expect an aggressive rally towards the 0.9 Fibonacci level from the previous Top, targeting $47.00.
-------------------------------------------------------------------------------
** Please LIKE 👍, FOLLOW ✅, SHARE 🙌 and COMMENT ✍ if you enjoy this idea! Also share your ideas and charts in the comments section below! This is best way to keep it relevant, support us, keep the content here free and allow the idea to reach as many people as possible. **
-------------------------------------------------------------------------------
💸💸💸💸💸💸
👇 👇 👇 👇 👇 👇

AVAX - LONG after range!!AVAX - LONG after range!!
Trned is still up
OI rising
but we need clear range to use it a support zone

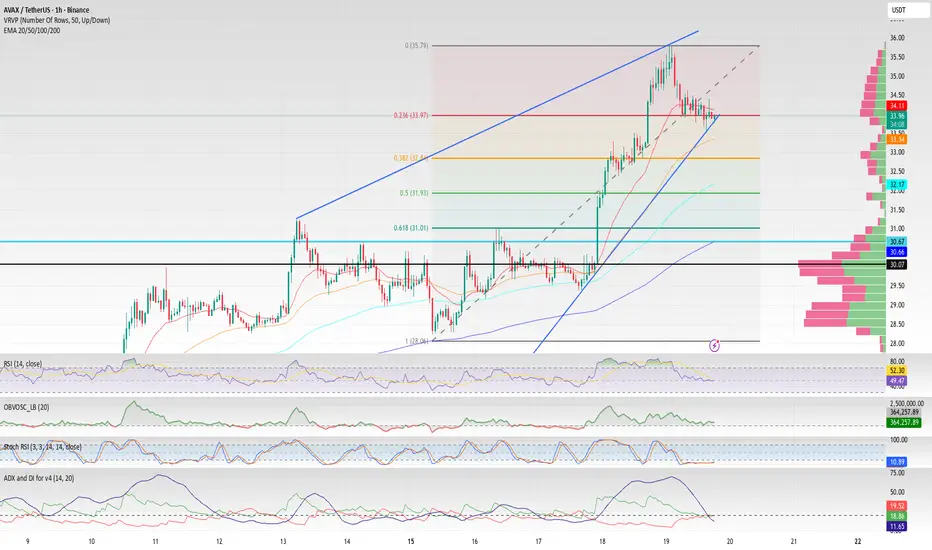
AVAX - DOUBLE TOP DAILY - REVERSAL INCOMINGCRYPTOCAP:AVAX - Daily Double Top in Play? 🐸📉
🔔 Called it live this morning
🧭 Structure: potential double top on the daily; bearish pressure building ⚠️
🔼 Resistance (R): $35.80–$36.00
🔽 Supports (S): $33.00 → $32.00 → $31.30 → $30.50 → $29.50 → $28.20
⏳ Likely path: consolidation chop for a few more weeks unless we see a decisive break

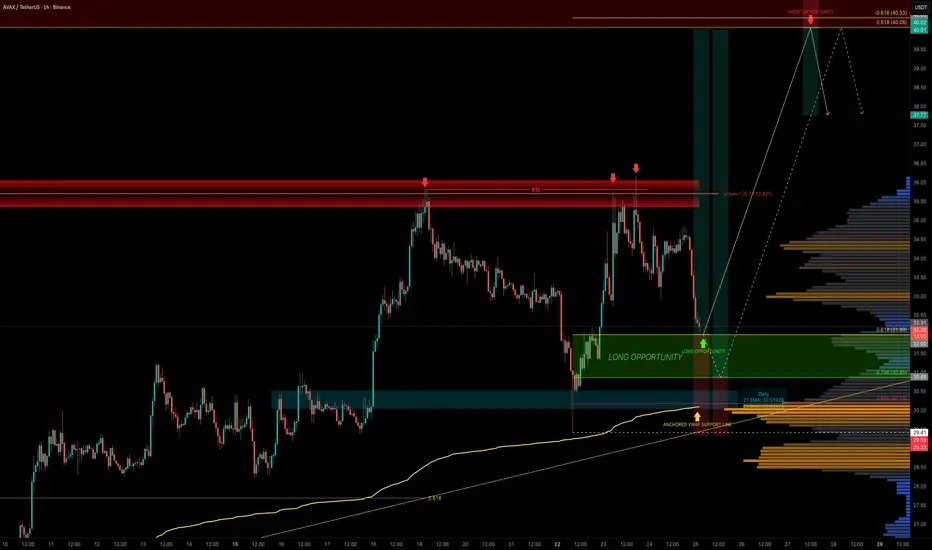
$AVAX – ARBITRAGE DUMP DETECTED – READY TO BALANCE?Traders,
Last time we nailed CRYPTOCAP:AVAX from 22.80 → 30 → 35 almost pixel perfect.
Now the setup may be flipping. Let’s break it down with the THETA method:
🔹 Imbalances
Perps vs Spot: Binance Perps wicked down to $26.83, Spot hasn’t filled it yet → liquidity gap below.
Market Profile: Price swept the 31 Jan weekly high, a “bad high” (too much excess, unstable).
Oscillators: RSI shows bearish divergences on multiple timeframes → momentum fading.
Context: Market is repairing imbalance above to build liquidity, which can later be used to fix the unfinished business below.
🔹 Order Flow & AVWAP
Aggressive buyers stepping in at $34–36 (since CME open).
Price is now trading at the upper band of the HTF AVWAP, a zone that often signals overextension vs volume-weighted positioning.
The unfilled wick imbalance at $26.83 is also the price of the HTF AVWAP itself (blue line) → strong confluence for a revisit.
If downside continues, those aggressive buyers will be trapped, fueling the move lower.
Next key check: At $26.90, we need to watch data + price action to define if AVAX stabilizes there or breaks further.
✅ Conclusion
Price is showing signs of distribution at the HTF AVWAP upper band. Liquidity is being absorbed above, and the confluence of the wick imbalance + HTF AVWAP at $26.83 strengthens the case for a downside move.
👉 Key takeaway: Longs chasing into AVWAP extremes = potentially trapped buyers, with the market likely rotating back to $26.90–26.83 before the next decision point.
AVAXUSDT ; Did the buyers arrive?Hello friends
You see that the price has created a channel and broken it and has had a good growth and has created a channel again that buyers support. Still, and considering the sharp movement that we are seeing, it seems that the price can break this channel.
If it fails to break the channel in the first encounter, it can move to the specified support areas and then grow.
If the channel is broken, the price can move to the specified targets.
*Trade safely with us*

BTC 1H Analysis - Key Triggers Ahead | Day 46👋🏻 Hi, how are you?
❄️ Welcome to the cryptos winter , I hope you’ve started your day well.
Shall we jump into the Bitcoin analysis?
⏰ We’re analyzing BTC on the 1-Hour timeframe.
👀 On the 1-hour timeframe for Bitcoin, we can see that after the recent drop, Bitcoin has formed a trading structure between a resistance and a support zone. A breakout from this structure — either to the upside or downside — could provide a trading opportunity. Currently, Bitcoin is trading near its resistance at $113,146, while holding support around $111,780. A break of either level may trigger the next move.
🧮 Looking at the RSI oscillator, after exiting oversold conditions, it’s now hovering near the 50 zone. Two key RSI levels to watch are 40 and 56; breaking above or below these levels could set the stage for Bitcoin to start moving out of its current structure.
🕯 The candle size and volume have increased when testing the $11,780 support, indicating the presence of buyers. However, the issue is that the number and volume of red candles are still dominant. The key question is whether buyers will step in strongly this time to defend support.
🧠 For positioning, it’s worth keeping a close eye on altcoins such as AVAX, which has shown strong upward momentum and recovered much faster compared to Bitcoin. Recently, Google search trends also indicate stronger interest in altcoins and the broader bull run narrative. That’s why Bitcoin might not be the best option for long-term positions right now. Even if you take a BTC trade, the potential might only extend to reward ratios like 1:2 or 1:3. Instead, focus more on altcoins that are showing bullish trends against Bitcoin.
❤️ Disclaimer : This analysis is purely based on my personal opinion and I only trade if the stated triggers are activated .

AVAX — 220-Day Range Broken, Next Stop $35?After 220 days of consolidation, AVAX has finally broken out of its trading range. The key resistance at $27 was cleared, and price quickly pushed into the $30 psychological level, where it faced rejection. Currently, AVAX is consolidating just below, around $29.
So, what’s next? Now all eyes are on the retest to confirm $27 as the new launchpad.
Support Confluence (Long Entry Zone)
3M/Quarterly level: $27.71 → major support
0.382 Fib retracement: $27.65 (low $23.87 → $30)
0.5 Fib retracement: $26.93 → perfectly aligned with $27 zone
Swing High: $27.38 → could be retested
4H 21 EMA: $27.71
4H 21 SMA: $27.41
Weekly VWAP: $27.41
Fair Value Gap (FVG): imbalances in this zone
📌 With all these layers of confluence, the $27.7–$27.4 zone is the ideal long entry area.
Resistance Confluence (Take Profit Zone)
0.5 Fib retracement of the entire downtrend: $35.22
15B Market Cap resistance: $35.5
Yearly Open: $35.7 → major target
3M/Quarterly level: $35.71
TPO resistance cluster: $35.22–$37.28
📌 Together, these levels form a stacked resistance zone at $35–$37, making it both the ideal take-profit area and a potential short setup.
Zoomed-Out View:
TPO Chart Reference:
🟢 Long Trade Setup
Entry Zone: $28.0 → $27.4 (DCA best approach)
Stop-Loss: Below $26 (to be adjusted after reversal confirmation)
Take Profit: $35
Potential Gain: +25%
R:R: 1:4+
Technical Insight
After 220 days of sideways compression, the breakout above $27 marks a shift in market structure.
A retest of this level would validate it as new support and provide a high-probability swing long setup.
The $35–$37 zone, reinforced by the yearly open at $35.7, stands out as the major resistance cluster, making it both the ideal profit target and a potential reversal area.
Key Levels to Watch
Support Zone: $28–$27
Resistance Zone: $35–$37
🔍 Indicators used
DriftLine — Pivot Open Zones → For identifying key yearly/monthly/weekly/daily opens that act as major S/R reference points
Multi Timeframe 8x MA Support Resistance Zones → to identify support and resistance zones such as the 4H 21 EMA/SMA.
➡️ Available for free. You can find it on my profile under “Scripts” and apply it directly to your charts for extra confluence when planning your trades.
_________________________________
💬 If you found this helpful, drop a like and comment!

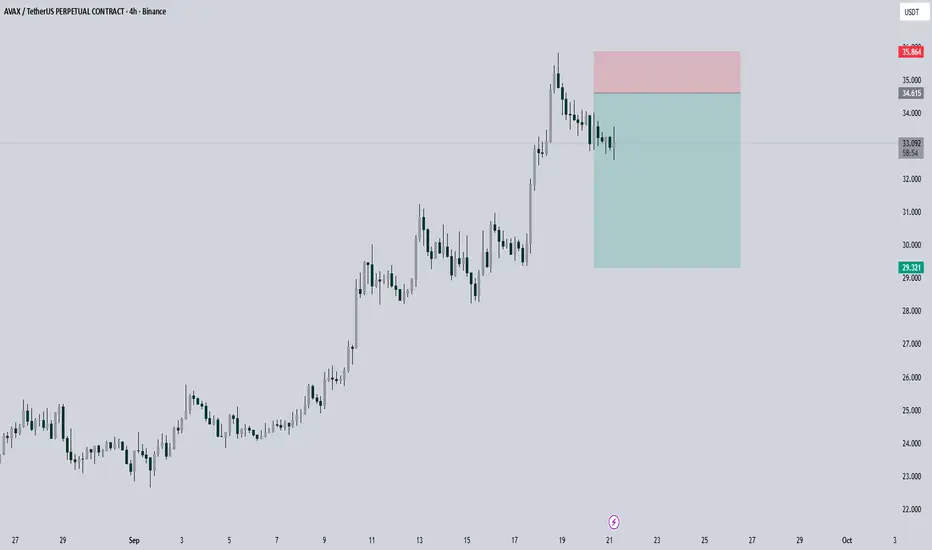
AVAX SHORTI'm taking this short position for BINANCE:AVAXUSDT.P . It's risky because it's near the top, and they can always eliminate the stop-loss with a shadow!
AXS: Coiling Up for a Shakeout?AXS is stuck between floors and ceilings, grinding inside a tight rising wedge. While the macro picture looks juicy with the Fed turning on the liquidity taps, the on-chain data for AXS is telling a different story. We're seeing a classic setup where the chart looks bullish from afar, but the internals are weak.
Our game plan is to watch for a breakdown. The bulls' line of defense is the wedge support around $33.50. A clean break below that level opens the door to our primary target zone, a liquidity magnet around $31.90-$30.50. This area is a major support cluster and a logical place for a healthy reset before the next leg. Heavy resistance sits at the recent high of $35.76.
Patience is key here; we're waiting for the market to show its hand while the crowd gets chopped up. Don't be the exit liquidity for underwater holders looking to break even on this bounce. Smart money waits for confirmation.
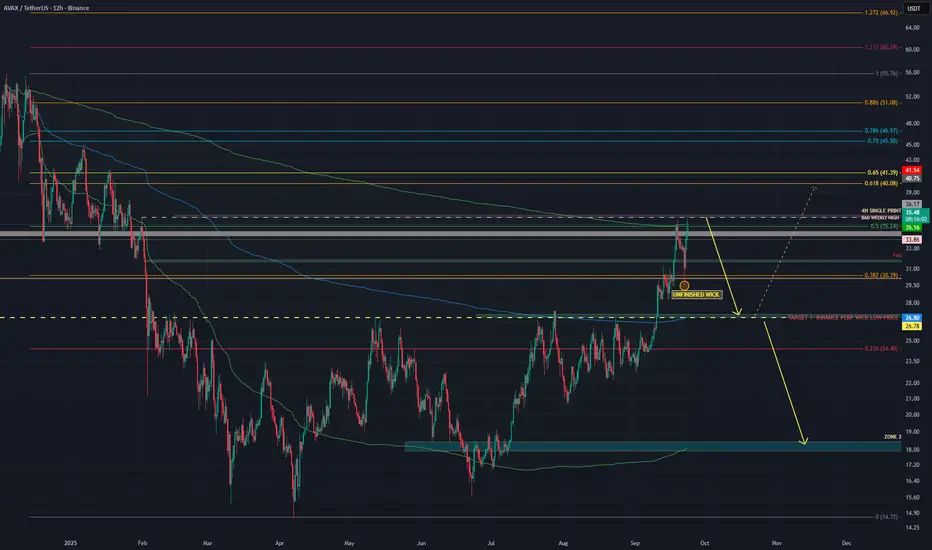
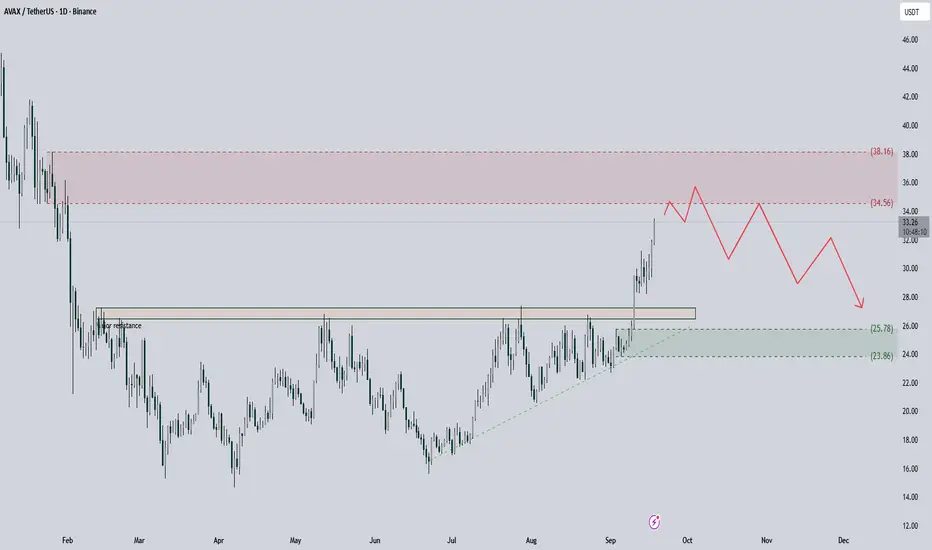
AVAX Nearing Key Resistance ZoneAVAX USDT Daily: Price Nearing Key Resistance Zone
BINANCE:AVAXUSDT has demonstrated a strong upward trend, breaking through a significant, long-term resistance level that has been in place since early in the year. This breakout is a bullish signal, and it's exciting to see the momentum it's carried.
However, the price is now approaching a new, crucial resistance zone between $34.56 and $38.16. This area previously acted as strong support before a significant downtrend. Based on my analysis, I anticipate a potential rejection from this zone, which could lead to a correction toward the previous resistance-turned-support area around $23.06 to $25.78.
The short-term outlook suggests a possible pullback from the current levels, but the overall market structure looks promising as long as the price holds above the recently broken resistance. I'll be watching for a clear reaction in this resistance zone to confirm the potential move.
What do you think? Drop your thoughts and analysis in the comments below!
AVAX - follow the trend!AVAX - follow the trend!
in previus analysis i told you to take long
price broke that range - that's why wait for a 2nd part of that plan - range and new long

AVAXUSDT UPDATE#AVAX
Update
AVAX Technical Setup
Pattern: Falling Wedge Pattern
Current Price: $25.21
Target Price: $55.78
Target % Gain: 120%
Technical Analysis: AVAX has broken out of a falling wedge on the 1D chart, signaling strong bullish momentum. The breakout above resistance with solid structure confirms upside potential, pointing toward the $55.78 target area.
Time Frame: 1D
Risk Management Tip: Always use proper risk management.

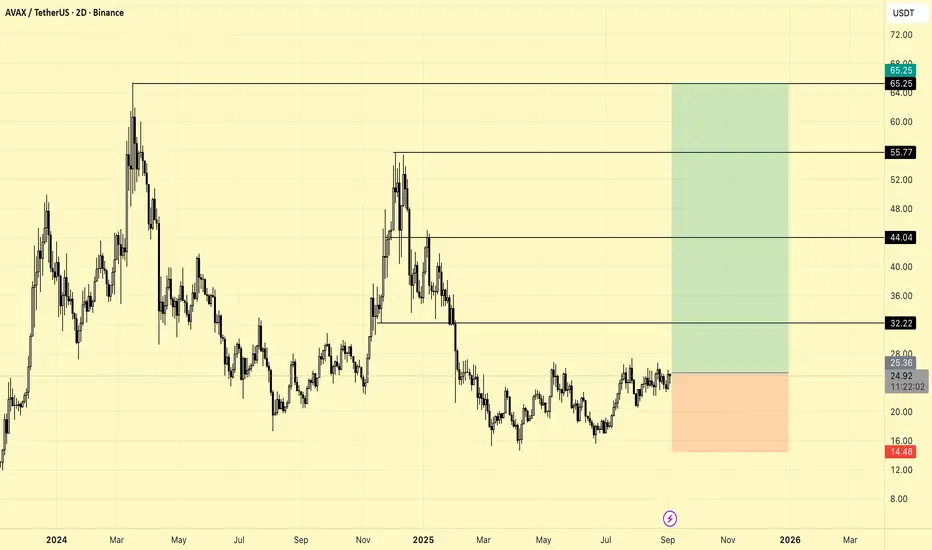
AVAX MID TERM TRADE IDEAKey Features and Explanation
Main support zone is marked at 14.48 USDT, indicating the stop-loss level for the setup.
Major resistance zones are drawn at 32.22, 44.04, 55.77, and 65.25 USDT as potential upside targets.
The green zone shows the reward/risk area for a bullish scenario, while the red zone visualizes the risk if price drops below support.
Current price is around 24.95 USDT, in a sideways consolidation near local resistance.
Trade Setup Summary
The chart captures a medium-term opportunity favoring a move up from the current range, aiming for the outlined resistance targets with managed stop-loss.
Level markings help define clear entries, exits, and targets for risk management.
Overall, this chart offers a structured technical outlook for AVAXUSDT, combining price levels with visual risk/reward parameters for effective trading assessment.
AVAX - NEW Entry for my communityAVAX - NEW Entry for my community
In a previus analysis we recomended to take long around $28 - price did 10% rise from that area twice
New long also better to take at $28 or after range consolidation

#AVAX/USDT : The Calm Before the Squeeze Storm#AVAX
The price is moving within a descending channel on the 1-hour frame, adhering well to it, and is heading for a strong breakout and retest.
We have a bearish trend on the RSI indicator that is about to be broken and retested, which supports the upward move.
There is a major support area in green at 28.30, representing a strong support point.
For inquiries, please leave a comment.
We are in a consolidation trend above the 100 Moving Average.
Entry price: 29.10
First target: 29.41
Second target: 29.90
Third target: 30.50
Don't forget a simple matter: capital management.
When you reach the first target, save some money and then change your stop-loss order to an entry order.
For inquiries, please leave a comment.
Thank you.

AVAX Market Update📊 CRYPTOCAP:AVAX Market Update
CRYPTOCAP:AVAX has formed a bullish Inverted Head & Shoulders pattern 🟢
👉 But it still needs to break out of the red resistance zone 🔴
👉 If the breakout happens, the first target will be the green line level 🎯
⚡ Wait for confirmation before entering.

AVAX – Riding the TrendLet’s ride this trend and see where it takes us! AVAX is showing signs of strength, and there’s a possible move to the upside coming today or tomorrow.
Momentum looks supportive, so if buyers step in, we could catch a nice leg higher. Keeping an eye on key levels — patience and timing will do the rest. 👀🔥

Will the Terror of 27 End for Avax?Avax is once again testing the 27 resistance. This level has been holding since March, rejecting Avax more than ten times. ( ).
Now, with tokenization becoming a hotter topic and upward pressure building across the broader crypto market, the weight on this resistance could start to grow. The consistently higher lows are another sign of rising bullish pressure. All Avax needs is a final push. Whether upcoming PPI and CPI data will help trigger the breakout remains to be seen.

AVAX -follow the riseAVAX -follow the rise
take new long after consolidation
1st target before POC at 36
main target swing high 54

AVAX MOON !!BINANCE:AVAXUSDT showing strong performance. If we can hold the 36 level, it can push higher.
Note: Do your own research before entering. Just sharing my thoughts, thanks
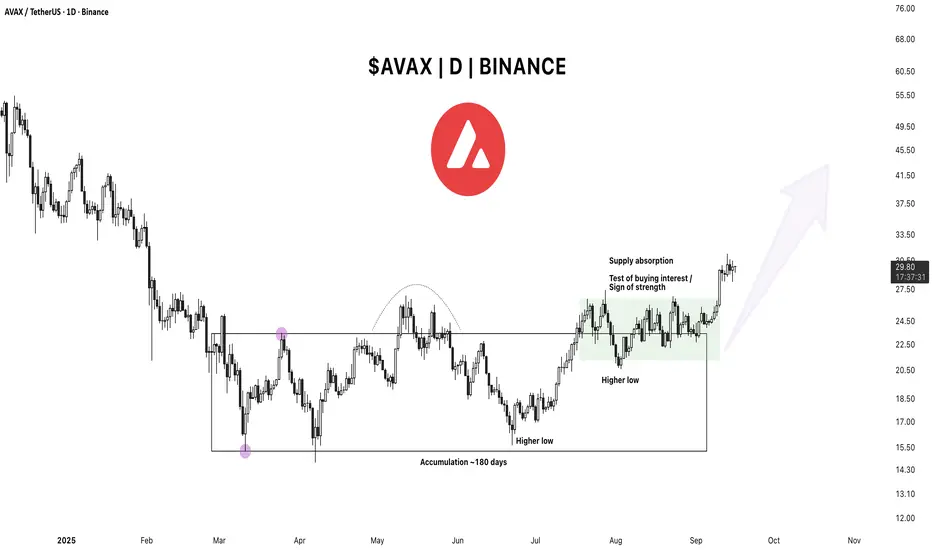
Avalanche ETF Buzz + Breakout Setup — What’s Next?Avalanche has been quietly working on one of the cleanest Wyckoff accumulation structures we’ve seen across majors this year. For more than six months, essentially from late February until mid-August, the price rotated in a broad range, chewing through supply and frustrating impatient longs.
From a Wyckoff perspective, we had an extended accumulation phase of ~180 days , clear higher lows forming into the summer, and a decisive show of strength in early September.
With supply finally cleared at the top of the range, it has given us a clean breakout that suggests it’s ready to reprice higher into Q4 .
🔥 Zooming Into the 4H
On the 4H, the price action since the breakout shows a textbook sequence : an impulsive expansion leg higher, followed by a pause for balance.
The initial leg in early September was initiative buying, pushing CRYPTOCAP:AVAX from ~$25 to $30. Since then, we’ve been consolidating in a relatively tight box between $28–31 , establishing a new base of value.
The point of control ( POC ) for this entire impulse sits right around $28 . That’s the key balance point where both buyers and sellers agreed on fair value during the expansion. As long as AVAX holds above that POC, the path of least resistance remains up .
Acceptance above $28 tells me the market is comfortable repricing higher, and responsive buyers are ready to defend pullbacks into that zone.
The other level to watch is the untested demand zone at $26–27 . This was the origin for the impulsive move, and it hasn’t been revisited yet. If we do pull back, that’s where I expect responsive flows to step in.
In other words, dips into $26–27 are likely to find buyers with conviction. For active traders, that’s a clean area to structure risk: defined demand zone, clear invalidation below $25, and upside targets much higher.
🔥 Catalysts
The technicals aren’t the only thing working in AVAX’s favor. There are also some fundamental tailwinds. This week, news broke of Avalanche’s partnership with Kalshi , a growing prediction markets platform.
More importantly, Bitwise filed an S-1 with the SEC for a Spot Avalanche ETF . It’s still early in the process, but the filing itself is a meaningful step. Even if approval takes time, the headline alone positions AVAX as one of the few assets outside Bitcoin, Ethereum, and Solana that could potentially get mainstream ETF access.
What’s your read on this move? Do you see CRYPTOCAP:AVAX sustaining this breakout, or is it setting up for a deeper pullback?
——————x——————x——————x——————x——————x——————x——————
⚠️ Disclaimer: Crypto products, NFTs, Memecoins are unregulated and can be highly risky. There may be NO regulatory recourse for any losses arising from such transactions.
This content is for educational and informational purposes only and does NOT constitute financial, investment, tax, or legal advice. Cryptocurrencies are highly volatile and speculative — you may lose part or ALL of your investment. I am NOT liable for your losses.
Please do NOT copy my trades. Always consult YOUR financial advisor before making any investment or trading decisions. Or at the very least, consult your cat. 🐱