#AVAX/USDT : The Calm Before the Squeeze Storm#AVAX
The price is moving within a descending channel on the hourly timeframe. It has reached the lower boundary and is heading towards a breakout, with a retest of the upper boundary expected.
The Relative Strength Index (RSI) is showing a downward trend, approaching the lower boundary, and an upward bounce is anticipated.
There is a key support zone in green at 9.61, and the price has bounced from this level several times. Another bounce is expected.
The indicator is showing a trend towards consolidation above the 100-period moving average, which we are approaching, supporting the upward move.
Entry Price: 9.88
First Target: 10.04
Second Target: 10.27
Third Target: 10.62
Stop Loss: Below the green support zone.
Remember this simple thing: Money management.
For any questions, please leave a comment.
Thank you.
AVAXBTC

#AVAX/USDT : The Calm Before the Squeeze Storm#AVAX
The price is moving within a descending channel on the hourly timeframe. It has reached the lower boundary and is heading towards a breakout, with a retest of the upper boundary expected.
The Relative Strength Index (RSI) is showing a downward trend, approaching the lower boundary, and an upward bounce is anticipated.
There is a key support zone in green at 14.00, and the price has bounced from this level several times and is expected to bounce again.
The indicator shows a trend towards consolidation above the 100-period moving average, which we are approaching, supporting the upward move.
Entry Price: 14.35
First Target: 14.67
Second Target: 15.09
Third Target: 15.67
Stop Loss: Below the green support zone.
Don't forget one simple thing: Money Management.
For any questions, please leave a comment.
Thank you.

$AVAX at last and crucial support!CRYPTOCAP:AVAX has dropped back into a major multi-year support zone after a sharp weekly selloff. This level has held the range multiple times since 2021, and the price is now reacting around the same support + long-term trendline.
If AVAX manages to hold this area, a bounce toward the mid-range levels ($21.40 → $33.22) becomes possible. Failure to hold support would expose lower targets.
This zone is critical — CRYPTOCAP:AVAX either stabilizes here or breaks structure for a deeper move.
Fundamental Analysis:
BINANCE:AVAXUSDT stands out as a leading Layer-1 blockchain, known for speed, scalability, and growing real-world asset (RWA) adoption. Subnet activity is rising, DeFi liquidity is improving, and the network’s decentralized finance ecosystem is gaining fresh momentum. Exchange reserves continue to decline, showing healthy on-chain fundamentals and liquid supply trends.
Latest Updates:
- Avalanche recently completed a major network upgrade, temporarily suspending AVAX C-Chain deposits and withdrawals for enhanced security.
- Its DeFi roadmap features the V1 launch on Sepolia testnet (Q4 2025), including new liquidity pools and support for ETH and USDT.
- Recent audits and a $50k bug bounty solidify Avalanche’s reputation for security and reliability.

#AVAX/USDT : The Calm Before the Squeeze Storm#AVAX
The price is moving in a descending channel on the 1-hour timeframe. It has reached the lower boundary and is heading towards breaking above it, with a retest of the upper boundary expected.
We have a downtrend on the RSI indicator, which has reached near the lower boundary, and an upward rebound is expected.
There is a key support zone in green at 12.80. The price has bounced from this zone multiple times and is expected to bounce again.
We have a trend towards stability above the 100-period moving average, as we are moving close to it, which supports the upward movement.
Entry price: 13.22
First target: 13.38
Second target: 13.74
Third target: 14.11
Don't forget a simple principle: money management.
Place your stop-loss below the support zone in green.
For any questions, please leave a comment.
Thank you.

#AVAX/USDT : The Calm Before the Squeeze Storm#AVAX
The price is moving in a descending channel on the 1-hour timeframe. It has reached the lower boundary and is heading towards breaking above it, with a retest of the upper boundary expected.
We have a downtrend on the RSI indicator, which has reached near the lower boundary, and an upward rebound is expected.
There is a key support zone in green at 11.80. The price has bounced from this zone multiple times and is expected to bounce again.
We have a trend towards stability above the 100-period moving average, as we are moving close to it, which supports the upward movement.
Entry price: 12.21
First target: 12.33
Second target: 12.59
Third target: 12.84
Don't forget a simple principle: money management.
Place your stop-loss below the support zone in green.
For any questions, please leave a comment.
Thank you.

AVAX/USDT : LIVE TRADEHello friends
Considering the decline I had, you can see that the price has been supported in our support area and the price has grown well.
Now, given the good growth we had, we have a high and low, which is a sign of the entry of sellers, and this means that the price will correct to the specified areas, and from there we can again expect the price to grow to the specified targets.
This analysis is technically reviewed and is not a buy or sell recommendation, so please follow risk and capital management.
*Trade safely with us*

FireHoseReel | AVAX: Building Energy Below Resistance🔥 Welcome To FireHoseReel !
Let’s dive into the analysis of AVAX (Avalanche).
👀 AVAX – 4H Market Structure Overview
On the 4-hour timeframe, after breaking its descending trendline, AVAX showed very strong bullish bias.
Even the pullback after the breakout was very shallow. Price then compressed like a spring and pushed away from the breakout zone with large whale-sized candles.
AVAX is now ranging just below a major resistance.
If this resistance breaks and price holds above it, we can say AVAX is likely to continue its bullish trend.
📊 Volume Analysis
Pay close attention to volume:
• The first volume spike came right after the bearish trendline breakout.
• The second volume increase appeared during the pullback completion at the $13.94 support.
• Now we are seeing the third wave of rising buy volume below resistance. This structure suggests that AVAX may be preparing for another multi-timeframe bullish rally, potentially transferring this momentum into higher timeframes.
✔️ AVAX/BTC – Additional Confirmation Looking at AVAX/BTC gives us a different perspective.
This pair is strongly bullish, confirming that AVAX deserves to stay on our watchlist for potential positions.
AVAX/BTC completed its correction while staying above a bullish curve structure and, just like AVAX/USDT, it is now sitting below resistance.
This resistance creates a trigger at 0.0001654, which is a key breakout level for confirmation.
📌 Trading Scenarios for AVAX, Below are the scenarios you can use alongside your own trading strategy. 👇🏻
🟢 Long Scenario
A breakout above the current AVAX resistance at $13.94, supported by rising buy volume, could start another bullish rally.
However, keep in mind:
• This is still the first direct test of resistance
• Any immediate entry here would be considered high risk
The safer approach is to:
• Wait for a pullback and consolidation
• Then enter after buy volume increases and the pullback structure completes
🔴 Short Scenario
A strong rejection from resistance, followed by:
• A lower high compared to the previous top
• A break of the new local low
• And the appearance of bearish patterns such as Failure Swing or Non-Failure Swing
can offer a valid short entry.
Even if we see equal highs, a confirmed break of the local low can still provide a short opportunity.
🛞 Risk Management & Disclaimer
Please remember to always use proper risk management and position sizing. Nothing in this analysis is financial advice. The market can change quickly, so always trade based on your own strategy, research, and risk tolerance. You are fully responsible for your own trades.

AVAX : Under the priceHello friends
well, technically, this currency has hit its resistance and formed a double top pattern, and here we have found good and strong support, which can be purchased in stages with capital and risk management, and moved with it to the specified target.
From this perspective, you should note that this currency is currently trading below its intrinsic value, and given that it is a good project, there is a good opportunity to buy it with this decline.
*Trade safely with us*

AVAXUSDTAVAXUSDT have a uptrend and is now this trend because we have higher high and higher low.
Next Target is 45$ and best levels for buy: 31$ - 27$
⚠️Please control risk management.

AVAXUSDT ; Did the buyers arrive?Hello friends
You see that the price has created a channel and broken it and has had a good growth and has created a channel again that buyers support. Still, and considering the sharp movement that we are seeing, it seems that the price can break this channel.
If it fails to break the channel in the first encounter, it can move to the specified support areas and then grow.
If the channel is broken, the price can move to the specified targets.
*Trade safely with us*

Avalanche sale!With how strong the Avax/btc ratio is, we look at this sell off in avalanche as a great buy the dip opportunity. If this level holds at the 0.5% fib level, Avalanche has a high probability target of $37. If you entered with $100,000 at the 0.5% fib level, you have a chance to make $25,000.

AVAXUSDT UPDATE#AVAX
Update
AVAX Technical Setup
Pattern: Falling Wedge Pattern
Current Price: $25.21
Target Price: $55.78
Target % Gain: 120%
Technical Analysis: AVAX has broken out of a falling wedge on the 1D chart, signaling strong bullish momentum. The breakout above resistance with solid structure confirms upside potential, pointing toward the $55.78 target area.
Time Frame: 1D
Risk Management Tip: Always use proper risk management.

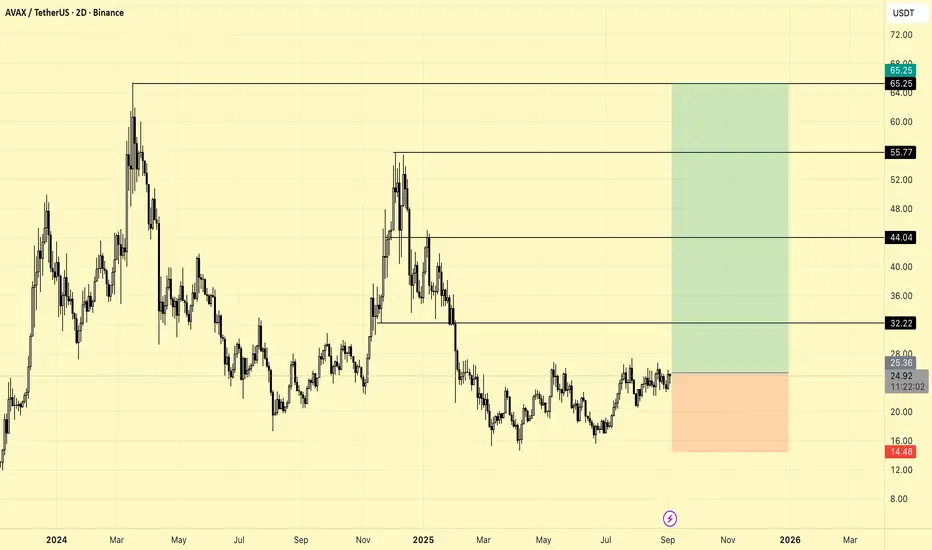
AVAX MID TERM TRADE IDEAKey Features and Explanation
Main support zone is marked at 14.48 USDT, indicating the stop-loss level for the setup.
Major resistance zones are drawn at 32.22, 44.04, 55.77, and 65.25 USDT as potential upside targets.
The green zone shows the reward/risk area for a bullish scenario, while the red zone visualizes the risk if price drops below support.
Current price is around 24.95 USDT, in a sideways consolidation near local resistance.
Trade Setup Summary
The chart captures a medium-term opportunity favoring a move up from the current range, aiming for the outlined resistance targets with managed stop-loss.
Level markings help define clear entries, exits, and targets for risk management.
Overall, this chart offers a structured technical outlook for AVAXUSDT, combining price levels with visual risk/reward parameters for effective trading assessment.
#AVAX/USDT : The Calm Before the Squeeze Storm#AVAX
The price is moving within a descending channel on the 1-hour frame, adhering well to it, and is heading for a strong breakout and retest.
We have a bearish trend on the RSI indicator that is about to be broken and retested, which supports the upward move.
There is a major support area in green at 28.30, representing a strong support point.
For inquiries, please leave a comment.
We are in a consolidation trend above the 100 Moving Average.
Entry price: 29.10
First target: 29.41
Second target: 29.90
Third target: 30.50
Don't forget a simple matter: capital management.
When you reach the first target, save some money and then change your stop-loss order to an entry order.
For inquiries, please leave a comment.
Thank you.

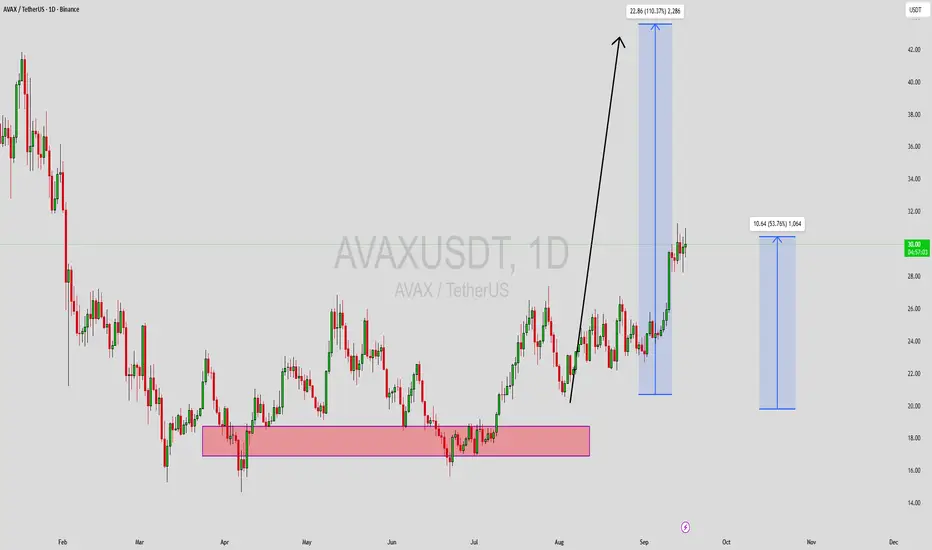
AVAXUSDT Forming Bullish MomentumAVAXUSDT is showing strong signs of bullish momentum as it continues to gather strength around key technical levels. The bullish momentum pattern suggests that buyers are gradually building control, setting the stage for a potential breakout. With solid trading volume backing the current market action, AVAX is well-positioned to push toward higher levels, and momentum traders are watching this closely for confirmation of trend continuation.
The projected expectation of a 90% to 100%+ gain reflects the strong upside potential that this setup presents. Once AVAXUSDT clears its near-term resistance levels, it could unlock rapid price acceleration, driven by increased demand and renewed investor confidence. Patterns of this nature often lead to explosive rallies as bullish sentiment fuels buying pressure.
Investor interest in this project continues to grow, signaling healthy market participation. The combination of strong volume, favorable technical indicators, and increasing community support makes AVAX one of the promising candidates for a major bullish run. If the current momentum sustains, AVAXUSDT could become a standout performer in the upcoming sessions.
✅ Show your support by hitting the like button and
✅ Leaving a comment below! (What is You opinion about this Coin)
Your feedback and engagement keep me inspired to share more insightful market analysis with you!
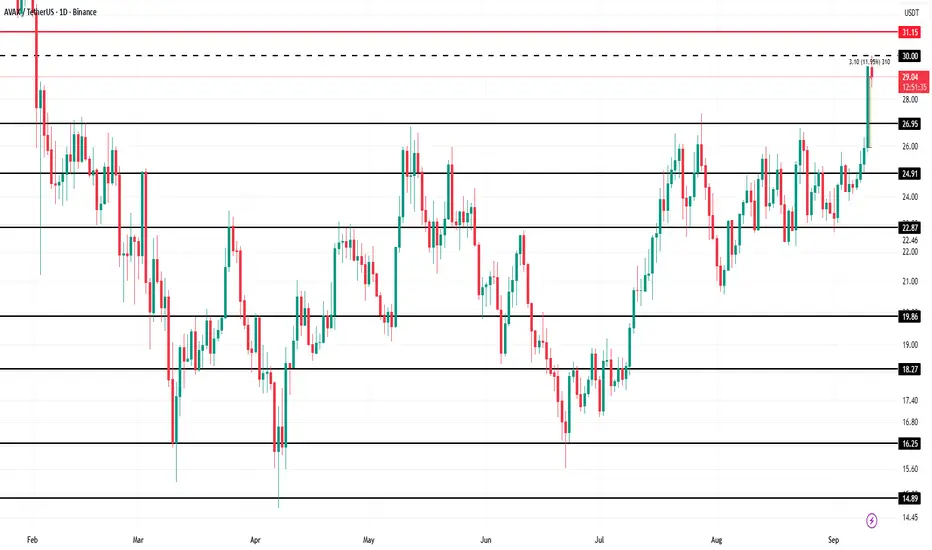
AVAX Price Hits 7-Month High, Seeks $1 Billion for Crypto FirmsAt the time of writing, AVAX is trading at $29.00 after rising 11.3% in a single day. The surge pushed the token to a 7-month high, though it is currently facing resistance at $30.00.
If investor enthusiasm holds, Avalanche could flip the $30.00 resistance into support, enabling a move toward $31.15 or higher. Sustained inflows and stronger correlation with Bitcoin would reinforce this bullish trajectory.
However, risks remain. If investors begin booking profits at current levels, AVAX could lose momentum. A dip to the $27.00 support or even further to $25.86 would erase much of the recent rally and invalidate the bullish thesis in the short term.
AVAXUSDT BINANCE:AVAXUSDT is ranging near 23.50, with support at 23.10 and resistance at 26.53. Momentum leans bearish, and losing 23.10 could target 21.20, while holding it may trigger a bounce.

AVAXUSDT UPDATE#AVAX
Update
AVAX Technical Setup
Pattern: Falling Wedge Pattern
Current Price: $25.21
Target Price: $55.78
Target % Gain: 120%
Technical Analysis: AVAX has broken out of a falling wedge on the 1D chart, signaling strong bullish momentum. The breakout above resistance with solid structure confirms upside potential, pointing toward the $55.78 target area.
Time Frame: 1D
Risk Management Tip: Always use proper risk management.

AVAX Analysis (1D)From the point where we placed the red arrow on the chart, it seems a correction has begun.
This correction appears to be a Diametric pattern, and wave E does not seem to be complete yet. It's expected that wave E will finish within the green zone.
The target could be the red box area.
A daily candle closing below the invalidation level would invalidate this analysis.
invalidation level: 10.90$
For risk management, please don't forget stop loss and capital management
When we reach the first target, save some profit and then change the stop to entry
Comment if you have any questions
Thank You

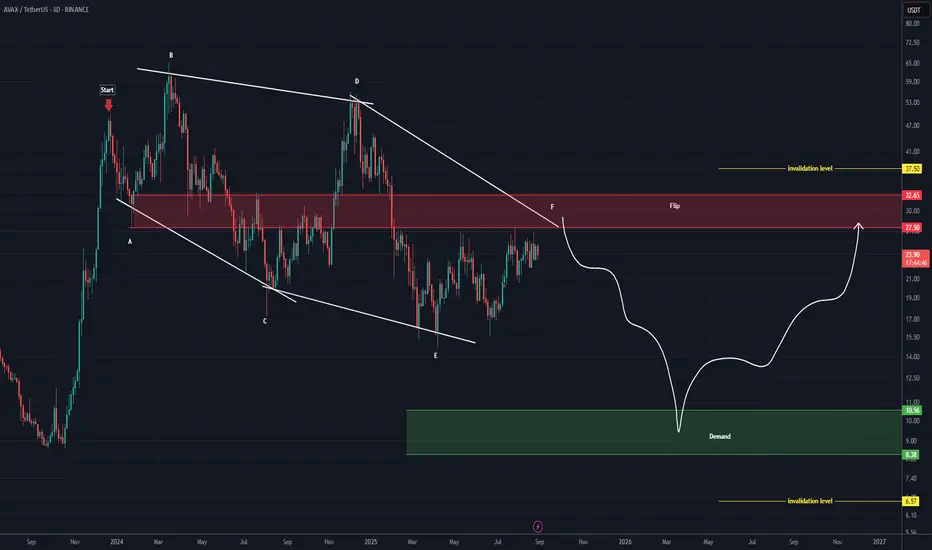
AVAX Analysis (3D)This analysis is an update of the analysis you see in the "Related publications" section
Before anything else, pay attention to the timeframe: it’s the 3-day timeframe.
The structure that AVAX is following is a large diametric, where wave F of this diametric is expected to end within the red-marked zone. After that, the price is anticipated to enter the bearish G wave.
Wave G could extend down to the main order block, which is the green-marked zone.
For both the bearish and bullish scenarios, the invalidation levels are marked on the chart. A daily candle closing above or below these levels will invalidate the respective outlook.
For risk management, please don't forget stop loss and capital management
Comment if you have any questions
Thank You
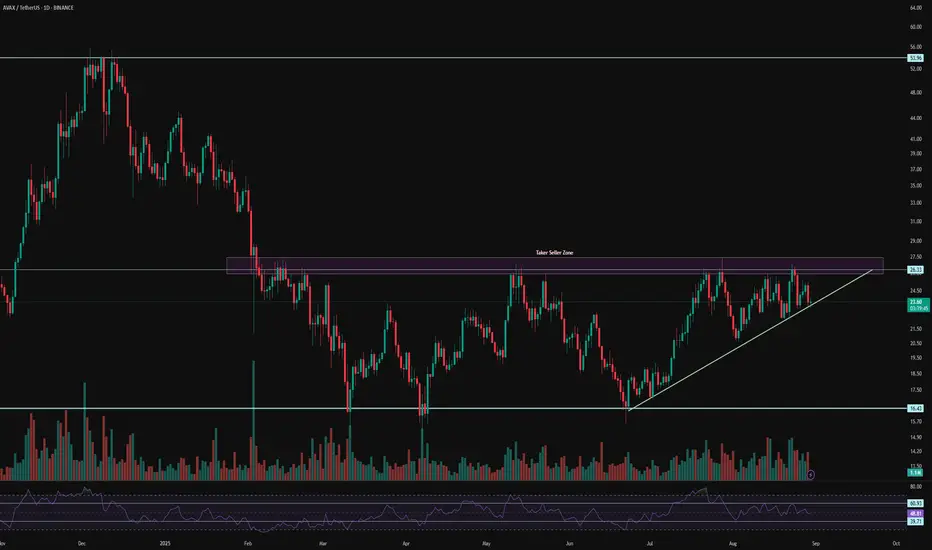
AVAX 1D Analysis – Key Triggers Ahead💀 Hey , how's it going ? Come over here — Satoshi got something for you !
⏰ We’re analyzing AVAX on the 1-Day timeframe timeframe.
👀 In the daily timeframe of AVAX, after the drop it experienced, AVAX entered a box with a long-term range. The ceiling and floor of this box are in the area of $16 and $26. The time range of this box or its length is almost 170 days. At the ceiling of this box, there are strong seller tickers that get their sell orders activated every time the price reaches this area. To break this zone and for a good rise of AVAX, we need a very strong and high-volume momentum that causes a price jump and fills the sell orders.
💰 In the daily timeframe of AVAXBTC we can see a relatively good compression formed in this area, and with the breakout of the Bitcoin ceiling, more Bitcoin will be converted into AVAX and it can be a good confirmation for a long position and some spot buying. The area considered for the alarm zone is 0.0002286.
⚙️ Two key areas for RSI have been considered. Passing the swing limits of 61 and 40 can bring good volatility to AVAX and help it break out of this RSI compression that is seen as a box.
🕯 The area considered as the seller ticker is a strong one, and every time the price reached this area, we faced selling pressure. The size of the green candles is also larger compared to the red candles, and each time the compression area became smaller and the price is ready for a breakout and reaction (not today but next week).
🔔 The area we considered as the alarm zone for AVAX is $26, and with the breakout of this area, AVAX can move towards higher price levels. Price behavior at $26 can give us complete awareness for trading.
❤️ Disclaimer : This analysis is purely based on my personal opinion and I only trade if the stated triggers are activated .
AVAX: GOOD PRICE!!!Hello friends
Given the arrival of buyers and the good price growth, now that we are in a price correction, there is a good opportunity to buy in steps in the specified areas with risk and capital management and move towards the specified goals.
*Trade safely with us*

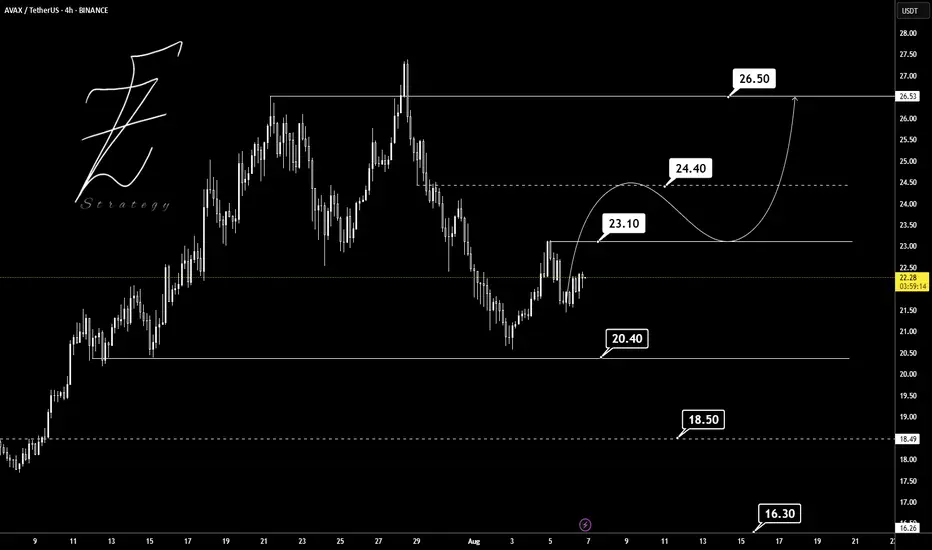
AVAXUSDT The overall trend of BINANCE:AVAXUSDT on the 4H timeframe shows signs of a potential bullish reversal, as a higher low has formed around the 20.40 support level after a strong downtrend. Currently, the price is ranging between the key support at 20.40 and the resistance at 23.10. A breakout above 23.10 could push the price toward the next major resistance at 24.40, which is a critical decision zone for the market. If buyers maintain momentum and break above 24.40, the next bullish target will be around 26.50 ✅ However, if the 20.40 support fails to hold, lower supports at 18.50 and 16.30 may come into play. The momentum currently leans slightly bullish, but price behavior between 23.10 and 24.40 will determine the next strong move. 📊
Key Support & Resistance Levels:
Supports: 20.40 – 18.50 – 16.30
Resistances: 23.10 – 24.40 – 26.50
Always remember to manage and control your risk properly. 🔒