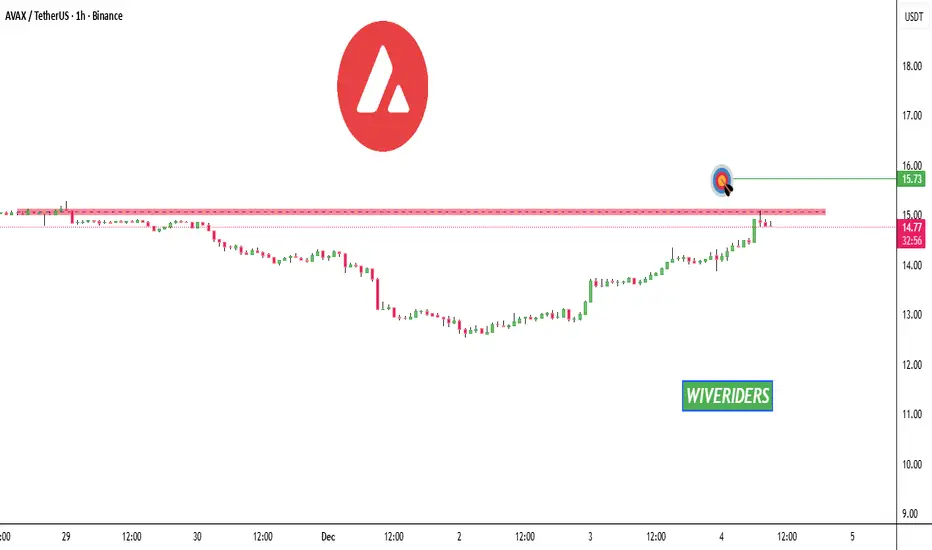
#AVAX/USDT : The Calm Before the Squeeze Storm#AVAX
The price is moving within a descending channel on the hourly timeframe. It has reached the lower boundary and is heading towards a breakout, with a retest of the upper boundary expected.
The Relative Strength Index (RSI) is showing a downward trend, approaching the lower boundary, and an upward bounce is anticipated.
There is a key support zone in green at 14.00, and the price has bounced from this level several times and is expected to bounce again.
The indicator shows a trend towards consolidation above the 100-period moving average, which we are approaching, supporting the upward move.
Entry Price: 14.35
First Target: 14.67
Second Target: 15.09
Third Target: 15.67
Stop Loss: Below the green support zone.
Don't forget one simple thing: Money Management.
For any questions, please leave a comment.
Thank you.
AVAXUSD

$AVAX at last and crucial support!CRYPTOCAP:AVAX has dropped back into a major multi-year support zone after a sharp weekly selloff. This level has held the range multiple times since 2021, and the price is now reacting around the same support + long-term trendline.
If AVAX manages to hold this area, a bounce toward the mid-range levels ($21.40 → $33.22) becomes possible. Failure to hold support would expose lower targets.
This zone is critical — CRYPTOCAP:AVAX either stabilizes here or breaks structure for a deeper move.
Fundamental Analysis:
BINANCE:AVAXUSDT stands out as a leading Layer-1 blockchain, known for speed, scalability, and growing real-world asset (RWA) adoption. Subnet activity is rising, DeFi liquidity is improving, and the network’s decentralized finance ecosystem is gaining fresh momentum. Exchange reserves continue to decline, showing healthy on-chain fundamentals and liquid supply trends.
Latest Updates:
- Avalanche recently completed a major network upgrade, temporarily suspending AVAX C-Chain deposits and withdrawals for enhanced security.
- Its DeFi roadmap features the V1 launch on Sepolia testnet (Q4 2025), including new liquidity pools and support for ETH and USDT.
- Recent audits and a $50k bug bounty solidify Avalanche’s reputation for security and reliability.

#AVAX/USDT : The Calm Before the Squeeze Storm#AVAX
The price is moving in a descending channel on the 1-hour timeframe. It has reached the lower boundary and is heading towards breaking above it, with a retest of the upper boundary expected.
We have a downtrend on the RSI indicator, which has reached near the lower boundary, and an upward rebound is expected.
There is a key support zone in green at 12.80. The price has bounced from this zone multiple times and is expected to bounce again.
We have a trend towards stability above the 100-period moving average, as we are moving close to it, which supports the upward movement.
Entry price: 13.22
First target: 13.38
Second target: 13.74
Third target: 14.11
Don't forget a simple principle: money management.
Place your stop-loss below the support zone in green.
For any questions, please leave a comment.
Thank you.

AVALANCHE is on the verge of a major bullish move! (3D)Based on the structure we previously shared for AVAX in this post (), it seems the same structure is being followed.
The price appears to be in a large ABC, where wave B is a major diametric, and wave G of this diametric is still remaining.
Wave G could complete within the green zone
After this diametric finishes, we expect the price to enter the large wave C
Touching the invalidating level would negate this view.
For risk management, please don't forget stop loss and capital management
When we reach the first target, save some profit and then change the stop to entry
Comment if you have any questions
Thank You

#AVAX/USDT : The Calm Before the Squeeze Storm#AVAX
The price is moving in a descending channel on the 1-hour timeframe. It has reached the lower boundary and is heading towards breaking above it, with a retest of the upper boundary expected.
We have a downtrend on the RSI indicator, which has reached near the lower boundary, and an upward rebound is expected.
There is a key support zone in green at 11.80. The price has bounced from this zone multiple times and is expected to bounce again.
We have a trend towards stability above the 100-period moving average, as we are moving close to it, which supports the upward movement.
Entry price: 12.21
First target: 12.33
Second target: 12.59
Third target: 12.84
Don't forget a simple principle: money management.
Place your stop-loss below the support zone in green.
For any questions, please leave a comment.
Thank you.

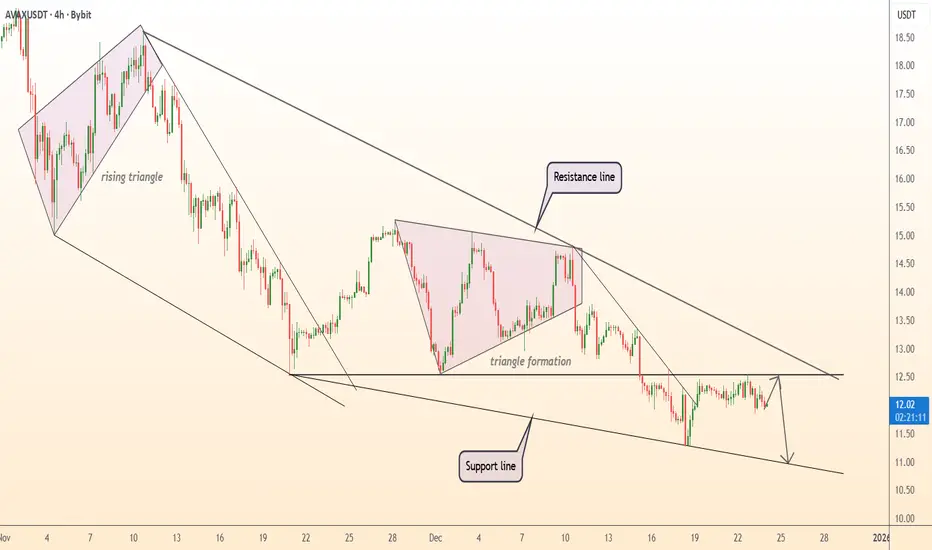
DeGRAM | AVAXUSD is holding a downtrend structure📊 Technical Analysis
● AVAX/USD remains in a well-defined descending channel after a failed rising triangle and multiple bearish triangle formations, confirming sustained selling pressure. Each rebound is capped by the descending resistance line, forming a clear sequence of lower highs.
● Price is consolidating just above the channel support near 11.5–11.0. A breakdown below this base would likely extend the bearish wave toward the next structural support, while upside attempts remain corrective below resistance.
💡 Fundamental Analysis
● Weak sentiment across altcoins and reduced risk appetite, alongside cautious crypto inflows, continue to weigh on AVAX performance.
✨ Summary
● Bearish trend intact. Resistance: 12.6–13.0. Targets: 11.5 then 11.0. Invalidation above descending resistance.
-------------------
Share your opinion in the comments and support the idea with a like. Thanks for your support!
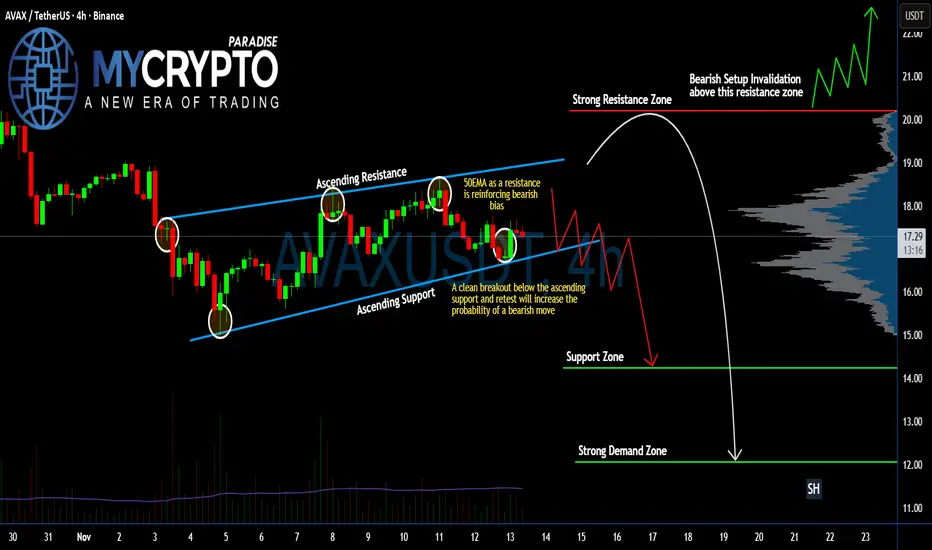
Is #AVAX Ready For a Massive Bearish Move or Not? Must Watch Yello Paradisers! Have you been keeping an eye on what’s happening with #AVAXUSDT? If not, you might be walking straight into a bearish trap. Let's break down the #Avalanche setup:
💎#AVAX has been trading inside an ascending channel, clearly respecting both the ascending support and resistance. We’ve now seen multiple strong rejections from the upper boundary, and most importantly, the 50 EMA is now acting as resistance, reinforcing a growing bearish bias across the board.
💎Current price of #AVAXUSD is $17.26, and we’re hovering just above the key ascending support. A clean breakdown below this support, followed by a bearish retest, would flip the structure and significantly increase the probability of a sharp bearish continuation.
💎If this bearish scenario plays out, we’re targeting the next Support Zone around $14.24. But that’s not where the real pain ends. The real liquidity is parked in the Strong Demand Zone around $12.07, where we could see aggressive buyer activity re-enter—if the market doesn’t capitulate first.
💎This entire bearish setup becomes invalid only if #AVAX manages to reclaim the $20.19 resistance zone. A breakout above that would invalidate the breakdown scenario and likely open the gates for a fast rally into the $22+ region.
Trade smart, Paradisers. This setup will reward only the disciplined.
MyCryptoParadise
iFeel the success🌴
AVAX - LONG - SQUEEZE TRAIN LOADING Traders,
I believe CRYPTOCAP:AVAX is getting ready to load a squeeze train upwards. This move might be quick, fast and harsh, the kind of reversal that catches traders off guard and leaves late shorts wondering what just happened.
Price has returned to a deep support zone where two separate Fibonacci retracements align. The 0.786 level from the A to B leg sits exactly at the current price. The 0.886 level from the C to D leg lands in the same place. When two independent fib legs converge like this, it often marks a high interest area where stronger hands quietly position and wait.
Before reaching this zone the market swept the Sunday wick. Sunday wicks are created during thin weekend volume without meaningful institutional presence. Because they form on weak liquidity, the market tends to revisit and clear them once real volume returns. Sweeping this wick removed weak weekend longs, cleaned the structure and collected liquidity needed for a sustained move.
Order Flow is lining up. Spot buyers are absorbing selling while perp traders are shorting into the lows. Spot CVD is rising which shows genuine demand. Both coin margined and stablecoin margined CVD are falling which shows leveraged shorts pressing down. Net Shorts are increasing at the bottom. Open Interest is rising at the same time. This confirms new short positions are opening rather than closing. When spot accumulation meets leveraged short pressure at deep fib support, the stage is set for a squeeze.
The first target above is the 1.618 extension of the A to B leg. This is the expected continuation level after a deep 0.786 retracement. It also aligns with a higher time frame 0.786 level not shown here to keep the chart clean. Confluence at the target strengthens its gravitational pull.
AVAX has swept liquidity, tapped strong fib confluence and attracted late shorts into the structure. All the ingredients for a fast upside squeeze are present.
Summary
• Two fib retracements meet at the current level
• Sunday wick swept which removes weak weekend positions
• Spot CVD rising which shows real buying
• Perp CVD falling which shows leveraged short pressure
• Net Shorts rising at the lows
• Open Interest rising which confirms new shorts opening
• Squeeze conditions forming
• First target is the 1.618 extension of A to B
• This target aligns with a higher time frame 0.786
Final Thought
The market does not shout its intentions. It whispers through structure, flow and confluence. Deep retracements, cleared liquidity and patient accumulation often appear right before sudden expansion. CRYPTOCAP:AVAX feels ready to shift tone and when it does, the shorts gathered at the lows may find themselves riding the squeeze train the wrong way.
Targets and Invalidation
My first target is 17.115, which aligns with the 1.618 extension of the A to B leg and fits the structure of a classic deep retracement continuation.
My second target is 22.5, a level that connects beautifully with mid-range liquidity left behind on the way down and acts as a natural expansion point once the first target is cleared.
For the more mid to long term, I am watching 31.25, which sits directly inside a higher time frame inefficiency zone and marks the beginning of true trend continuation rather than a simple corrective squeeze.
Invalidation sits cleanly at 12.275, the low of point A. If price breaks below that level, the structure of the current idea collapses and the setup no longer fits the narrative of a squeeze. Until that level is violated, the bullish structure remains intact and the path of least resistance stays upward.
----------------
If you like this analysis, feel free to leave a like or a comment. I am not asking for money and I am not trying to sell anything. I simply enjoy helping people look through the noise and understand the structure beneath the chaos.

Avalanche AVAX price analysisCRYPTOCAP:AVAX right on the bottom of the 2-year channel!
The price of CRYPTOCAP:AVAX is once again touching the lower boundary of a massive channel that has been forming for more than 24 months.
And what’s interesting — #Avalanche has strong fundamentals, active development, and a “starting” market cap of $5.5B 💰
📈 So… is it finally time for OKX:AVAXUSDT to move up?
🔹 Conservative target: +100% → $26
🔹 Ambitious but realistic: upper channel → $41–42 (+225%)
Looks juicy, right? 🤔
Do you think CRYPTOCAP:AVAX is gearing up for a breakout — or are we in for another round of accumulation?
______________
◆ Follow us ❤️ for daily crypto insights & updates!
🚀 Don’t miss out on important market moves
🧠 DYOR | This is not financial advice, just thinking out loud

AVAX/USDT : LIVE TRADEHello friends
Considering the decline I had, you can see that the price has been supported in our support area and the price has grown well.
Now, given the good growth we had, we have a high and low, which is a sign of the entry of sellers, and this means that the price will correct to the specified areas, and from there we can again expect the price to grow to the specified targets.
This analysis is technically reviewed and is not a buy or sell recommendation, so please follow risk and capital management.
*Trade safely with us*

AVAXUSD 2-year Channel Down starting a rally to $20?Avalanche (AVAXUSD) has been trading within a 2-year Channel Down which made a Lower Low bottom 3 weeks ago. The price has since then traded sideways, potentially in an attempt to price a technical Support base.
If the market doesn't break below this, there are high probabilities to see this pattern initiating a new Bullish Leg. The previous two Bullish Legs showed a declining rate on their rallies with the first hitting the 0.786 Fibonacci level but the second being only able to hit the 0.618 Fib.
If this decreasing rate continues, we shouldn't go much further than the 0.5 Fib this time. With the 1W MA50 (blue trend-line) and the 1M MA50 (red trend-line) posing as the two main Resistance levels of this Bear Cycle, we place our Target below at $20.000.
---
** Please LIKE 👍, FOLLOW ✅, SHARE 🙌 and COMMENT ✍ if you enjoy this idea! Also share your ideas and charts in the comments section below! This is best way to keep it relevant, support us, keep the content here free and allow the idea to reach as many people as possible. **
---
💸💸💸💸💸💸
👇 👇 👇 👇 👇 👇

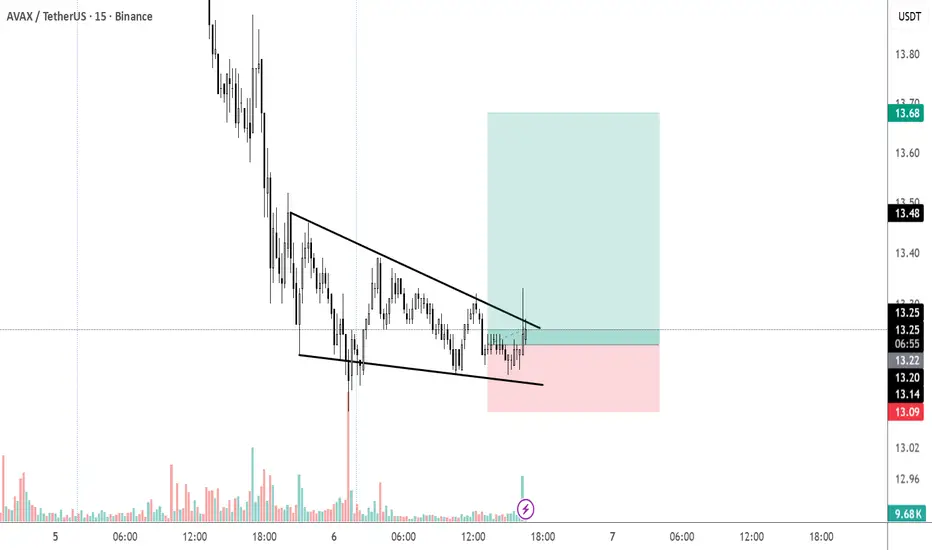
AVAX – 15m Technical Analysis (Breakout Setup)🔥 AVAX – 15m Technical Analysis (Breakout Setup)
( BINANCE:AVAXUSDT )
✅ 1) Pattern Analysis – Falling Wedge
A falling wedge usually signals that sellers are weakening, and buyers are absorbing liquidity.
What confirms the breakout?
Price broke above the wedge’s upper trendline.
A large bullish candle with increased volume.
Retest area around 13.20–13.25, which is happening now.
📌 This is a classic bullish breakout behaviour.
✅ 2) Entry Logic
The entry around 13.25 is technically correct because:
It's exactly at the breakout retest zone.
Buying pressure is visible.
Volume supports continuation.
This setup is high probability when supported by volume (which is clearly rising).
✅ 3) Stop Loss (SL)
Your SL below 13.05 – 13.10 is perfect because:
It sits below the wedge structure.
If price returns below this level, the breakout becomes invalid.
This is the correct technical placement.
✅ 4) Take Profit (TP) Projection
Your TP zone around 13.70 – 13.80 is realistic and matches:
Previous major support turned resistance.
Measured move of wedge height placed at breakout.
High-volume node from earlier.
✔ Expected targets:
TP1 → 13.48 (first resistance)
TP2 → 13.68 (upper range)
TP3 → 13.78–13.80 (full wedge target)
✅ 5) Market Behaviour to Expect
After a falling wedge breakout, price typically:
Breaks the trendline ✔
Pulls back slightly to retest the breakout level
Then accelerates upward toward targets
#AVAXUSDT: Targeting $60 Long Term View! Swing TradeThis crypto pair has a big potential of going back to its previous all time high, in our opinion price should reverse from $9 to $10 that area looks more appealing. We expect a swing volume to kick in the market.
Use accurate risk management while trading cryptocurrency. Like and comment for more.
Team Setupsfx_

AVAX Update🚨📊 AVAX Update
AVAX is testing the red resistance zone 🔴.
If breakout happens, first target = green line level 🟩🎯.
AVAX 8H – Liquidation Wick Above, Liquidity at $8.69 Below?AVAX printed a large liquidation wick on October 10th, creating an inefficient displacement that price has been unwinding ever since. Structure has remained clean: lower highs, lower lows, and continuous rejection from the 50/100 EMAs.
The current bounce is interacting with dynamic resistance from the 50 EMA. Unless price can reclaim the 100 EMA and break back into the 0.5–0.618 Fib zone, it remains a lower-timeframe corrective move inside a broader downtrend.
The key level on this chart is the $8.69 macro liquidity line, which aligns with the base of the previous bull run (as shown on the 1D inset). That level has remained untouched and stands out as a major liquidity pool if bearish structure continues.
Short-term: watch for a lower-high formation around $13–$14.
Higher timeframes: liquidity below remains the dominant draw.

FireHoseReel | AVAX: Building Energy Below Resistance🔥 Welcome To FireHoseReel !
Let’s dive into the analysis of AVAX (Avalanche).
👀 AVAX – 4H Market Structure Overview
On the 4-hour timeframe, after breaking its descending trendline, AVAX showed very strong bullish bias.
Even the pullback after the breakout was very shallow. Price then compressed like a spring and pushed away from the breakout zone with large whale-sized candles.
AVAX is now ranging just below a major resistance.
If this resistance breaks and price holds above it, we can say AVAX is likely to continue its bullish trend.
📊 Volume Analysis
Pay close attention to volume:
• The first volume spike came right after the bearish trendline breakout.
• The second volume increase appeared during the pullback completion at the $13.94 support.
• Now we are seeing the third wave of rising buy volume below resistance. This structure suggests that AVAX may be preparing for another multi-timeframe bullish rally, potentially transferring this momentum into higher timeframes.
✔️ AVAX/BTC – Additional Confirmation Looking at AVAX/BTC gives us a different perspective.
This pair is strongly bullish, confirming that AVAX deserves to stay on our watchlist for potential positions.
AVAX/BTC completed its correction while staying above a bullish curve structure and, just like AVAX/USDT, it is now sitting below resistance.
This resistance creates a trigger at 0.0001654, which is a key breakout level for confirmation.
📌 Trading Scenarios for AVAX, Below are the scenarios you can use alongside your own trading strategy. 👇🏻
🟢 Long Scenario
A breakout above the current AVAX resistance at $13.94, supported by rising buy volume, could start another bullish rally.
However, keep in mind:
• This is still the first direct test of resistance
• Any immediate entry here would be considered high risk
The safer approach is to:
• Wait for a pullback and consolidation
• Then enter after buy volume increases and the pullback structure completes
🔴 Short Scenario
A strong rejection from resistance, followed by:
• A lower high compared to the previous top
• A break of the new local low
• And the appearance of bearish patterns such as Failure Swing or Non-Failure Swing
can offer a valid short entry.
Even if we see equal highs, a confirmed break of the local low can still provide a short opportunity.
🛞 Risk Management & Disclaimer
Please remember to always use proper risk management and position sizing. Nothing in this analysis is financial advice. The market can change quickly, so always trade based on your own strategy, research, and risk tolerance. You are fully responsible for your own trades.

AVAX/USDT - Heads Into Major Demand Zone — Bounce or Breakdown?AVAX is currently standing at one of its most critical decision points since 2023. After failing to hold its multi-year ascending trendline, the price finally broke down and closed the weekly candle below the structural level at $15.7. This isn’t a normal correction — this is a signal that the market structure has shifted, and AVAX is entering a survival phase.
But the story is far from over. Price is now sliding into a zone that has historically acted as a deep accumulation region:
$10.7 – $8.5
This yellow block is where large-volume buyers previously stepped in during the 2022 crash and later consolidated before major moves.
The long wick sweeping into this zone indicates early buyer activity — but not enough to reclaim structural levels yet.
Right now, AVAX is in the middle of a high-timeframe battlefield between two major outcomes:
Bullish Reversal Scenario → Price reclaims $15.7 and climbs back above the broken trendline.
Bearish Breakdown Scenario → Price loses $10.7, falls deeper into the accumulation block, and risks testing historical lows near $5.7.
---
Bullish Scenario — (Reversal Trigger: $15.7)
A bullish reversal starts to form if AVAX can:
1. Bounce strongly from $10.7–$8.5, and
2. Close a weekly candle back above $15.7.
This would signal that significant accumulation has taken place and that smart money is re-entering the market.
Major upside targets become:
$20.80 → First structural resistance
$32.90 → Mid-range breakout
$54.30 → High-timeframe trend reversal confirmed
This is the “comeback path” for AVAX.
---
Bearish Scenario — (Breakdown Trigger: $10.7)
If AVAX fails to hold above $10.7 on the weekly, the long-standing demand zone collapses.
Downside implications:
Immediate drop toward $8.5
If $8.5 also breaks →
Price opens the door to a deeper decline toward the historical low around $5.7
This would confirm a major redistribution phase, not just a pullback.
---
Price Action & Market Structure
AVAX is forming lower highs and lower lows, confirming a weekly downtrend.
Breaking the ascending trendline marks a clear character shift.
The $10.7–$8.5 zone now acts as the final defense for bulls before entering a multi-year lower range.
Expect liquidity sweeps & stop hunts in this region — patience and weekly confirmation are key.
---
AVAX is now sitting inside a make-or-break zone that will determine its multi-month direction.
Hold $10.7–$8.5 → Potential strong reversal back toward $20–$30
Break below $10.7 → Deeper bearish continuation toward the $5.7 region
This is the type of price zone where professional traders wait for confirmation, not quick reactions.
---
#AVAX #Avalanche #CryptoTA #AVAXUSDT #TechnicalAnalysis #Altcoins #PriceAction #MarketStructure #CryptoOutlook #SupportAndResistance

AVAX AVALANCHE 1D - 1W TF Right now I see two possible scenarios:
Bullish scenario:
We hold the current zone and start reversing toward the purple zone (the resistance of the descending channel).
From there we will see how the price reacts — if it breaks above this level, the next targets will begin to play out.
Bearish scenario:
If the current zone does not hold, the price may retest the green channel and possibly even the blue zone.
In any case these are global targets and for now the price action is expected to develop within this broader range.

AVAX on Track — Ready for a ComebackFor me, AVAXUSDT is starting to show clear signs of growth 🚀
The chart structure looks encouraging — I like the way bulls are slowly stepping in and building momentum for a potential move to the upside.
🎯 Target: 18,400
❌ Invalidation zone (stop): 16,789
Let’s see how the market plays it out — the setup looks promising!
⚠️ Disclaimer:
This is not a financial signal. Trade according to your own risk management and never trade without stop-losses.
💬 Drop your reactions and comments below — and hit follow if you’d like me to post regular updates and forecasts on AVAX!

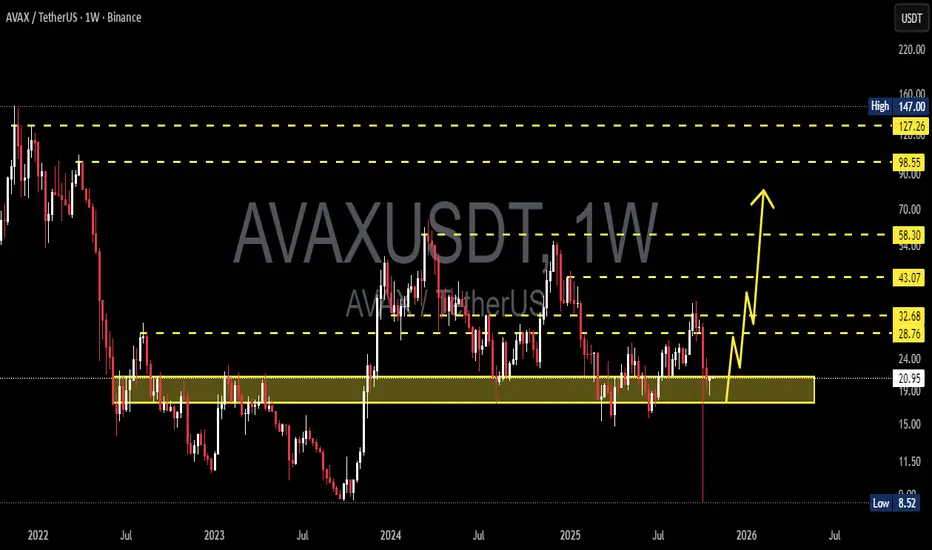
AVAXUSDT – Critical Support Zone: Will Decide the Next Trend?Yellow Block (Support Zone): 21 – 17.5 (Weekly)
This zone is the bulls’ last stronghold, an area that has historically marked AVAX’s major turning points. Price has now returned to this critical region — and what happens next could define the next macro trend.
---
Market Structure & Big Picture
After a long downtrend since 2022, AVAX has entered a macro consolidation phase, ranging between $17.5 and $43.
The current movement sits right at the bottom of this range, making the upcoming weekly close extremely important.
Major Range: 17.5 – 43
Key Support: 21 – 17.5
Main Resistance: 28.7 – 32.7 → 43.1 → 58.3
Historical High: 127 – 147
Historical Low: 8.5
This yellow zone isn’t just a technical area — it’s a battleground between long-term accumulation and potential distribution.
Every time AVAX touched this region in the past, price rebounded significantly, suggesting a possible mid-term reversal opportunity if bulls defend it again.
---
Pattern & Technical Characteristics
The chart currently shows a sideways accumulation pattern over more than a year.
Each retest of the 21–17.5 zone has produced deep wicks and strong rejections — signals of institutional absorption or smart money re-entry.
However, if this support fails, it could trigger a structural breakdown and re-open the path toward the lower double-digit region.
Potential pattern formations:
Double Bottom (Reversal) if price bounces and breaks above 28–33
Descending Channel Breakdown if price loses 17.5 with a confirmed close
---
Bullish Scenario – “Bounce From The Abyss”
If the weekly candle closes above 21, the support remains intact — and this could mark the start of a strong reversal swing.
Bullish confirmation signals:
Strong rejection with long lower wick
Rising volume during recovery
Weekly close > 24
Upside targets:
1. 28.7 → First resistance zone
2. 32.7 → Structural breakout confirmation
3. 43.1 → Major swing target
4. 58.3 → Mid-term continuation goal
Potential gain: 35% up to 170% from current levels if the bullish setup plays out.
---
Bearish Scenario – “Breaking the Last Line of Defense”
If the weekly close falls below 17.5, it confirms a macro breakdown.
AVAX could enter a new redistribution phase, targeting 12.0 – 9.0, and possibly 8.5 if a market-wide capitulation occurs.
Bearish confirmation signals:
Weekly close < 17.5
High-volume selling pressure
Failed retest (17.5 flips into resistance)
This would shift the macro bias fully bearish, and patient traders might wait for a new accumulation phase at much lower levels.
---
Conclusion & Macro Sentiment
AVAX currently sits in a golden decision zone — the line between collapse and recovery.
As long as the price holds above 21–17.5, the potential for a macro rebound remains strong.
But a confirmed breakdown below that area would signal that the accumulation phase isn’t over yet, and the market might need one final washout before a full recovery.
---
#AVAX #AVAXUSDT #CryptoAnalysis #TechnicalAnalysis #WeeklyChart #CryptoMarket #AltcoinAnalysis #TradingView #SwingTrading #SupportAndResistance #Avalanche #CryptoReversal #MarketStructure #CryptoUpdate
AVAX : Under the priceHello friends
well, technically, this currency has hit its resistance and formed a double top pattern, and here we have found good and strong support, which can be purchased in stages with capital and risk management, and moved with it to the specified target.
From this perspective, you should note that this currency is currently trading below its intrinsic value, and given that it is a good project, there is a good opportunity to buy it with this decline.
*Trade safely with us*

$AVAX: time to refill our bags!CRYPTOCAP:AVAX remains a solid project that’s not going anywhere. It’s now evolving into a game-oriented blockchain, which adds an interesting new use case to what was once a fairly mature ecosystem.
The current price range of $22–$23 sits in a strong demand zone, a level that has historically triggered major pumps.
With the Multi Timeframe MACD deeply oversold, the RSI low, and the Stochastic RSI bottomed out on the 1D, this looks like an excellent opportunity to build a position with a favorable risk/reward ratio.
It may take some time to fully clear the bearish divergence from the last rally, but the October 11th crash likely reset the structure — suggesting a bullish outlook moving forward.
Fibonacci targets:
🎯 TP1: $28.5
🎯 TP2: $31.4
🎯 TP3: $35.08
If the market enters a true altseason, CRYPTOCAP:AVAX could climb significantly higher — but for now, these are the most reasonable targets.
As always, DYOR before entering any trade.
#AVAX #CryptoAnalysis #Altcoins #TechnicalAnalysis #RSI #MACD #StochasticRSI #TradingSetup #Bullish #GameFi #Altseason #DYOR
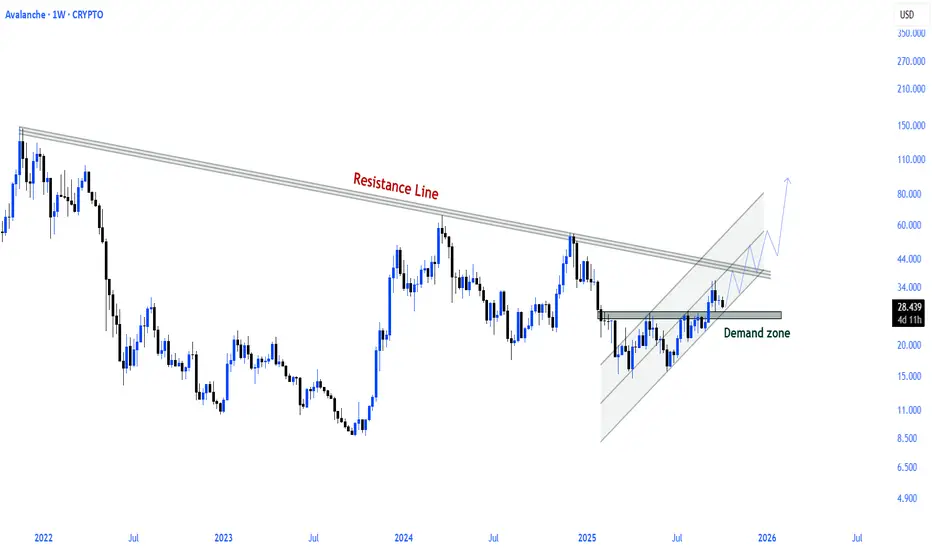
$AVAX \ AVALANCHE AVAX is trading below the long-term descending resistance line on the weekly chart.
The price is moving within an ascending channel, rebounding upward from a strong demand zone.
This structure signals a potential trend reversal.
If the critical downward trend breakout occurs, a new upward wave will begin in the market structure. The area to watch: weekly close above the resistance line.
Expectations are high, confirmation is required.