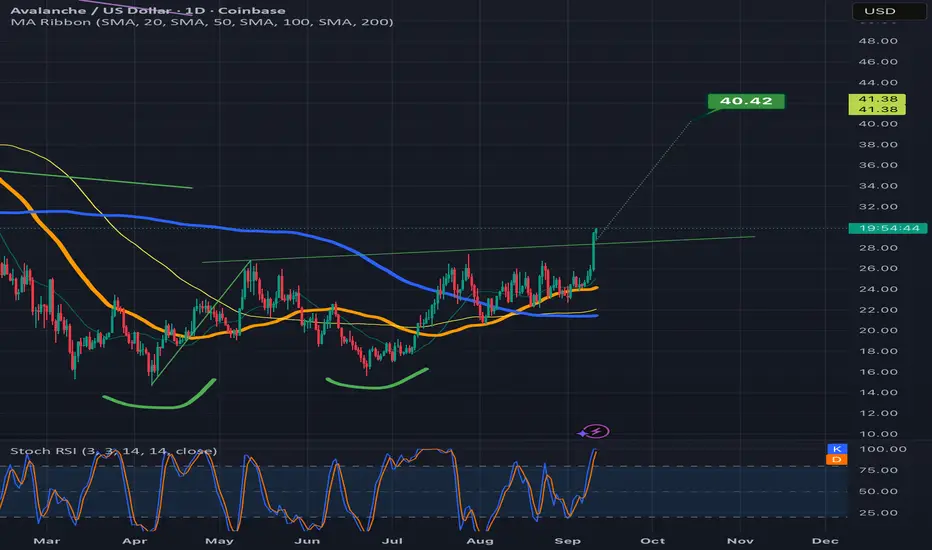
AVAXUSDTAVAXUSDT have a uptrend and is now this trend because we have higher high and higher low.
Next Target is 45$ and best levels for buy: 31$ - 27$
⚠️Please control risk management.
AVAXUSD

AVAXUSD Channel Up $28 pull-back or break-out to $47??Avalanche (AVAXUSD) has been trading within a 3-month Channel Up and last Friday hit its top (Higher Highs trend-line).
It is no surprise that the price got rejected and turned sideways there as it also completed a +75% rise from the last Higher Low, which is exactly what the previous Bullish Leg did. That structure eventually pulled back to its 1D MA50 (blue trend-line) and the 0.5 Fibonacci retracement level before pricing the Higher Low.
As a result, we expect a decline towards the 1D MA50, targeting $28.00, as long as the Channel Up doesn't break upwards.
If it does however, we expect an aggressive rally towards the 0.9 Fibonacci level from the previous Top, targeting $47.00.
-------------------------------------------------------------------------------
** Please LIKE 👍, FOLLOW ✅, SHARE 🙌 and COMMENT ✍ if you enjoy this idea! Also share your ideas and charts in the comments section below! This is best way to keep it relevant, support us, keep the content here free and allow the idea to reach as many people as possible. **
-------------------------------------------------------------------------------
💸💸💸💸💸💸
👇 👇 👇 👇 👇 👇

AVAXUSDT ; Did the buyers arrive?Hello friends
You see that the price has created a channel and broken it and has had a good growth and has created a channel again that buyers support. Still, and considering the sharp movement that we are seeing, it seems that the price can break this channel.
If it fails to break the channel in the first encounter, it can move to the specified support areas and then grow.
If the channel is broken, the price can move to the specified targets.
*Trade safely with us*

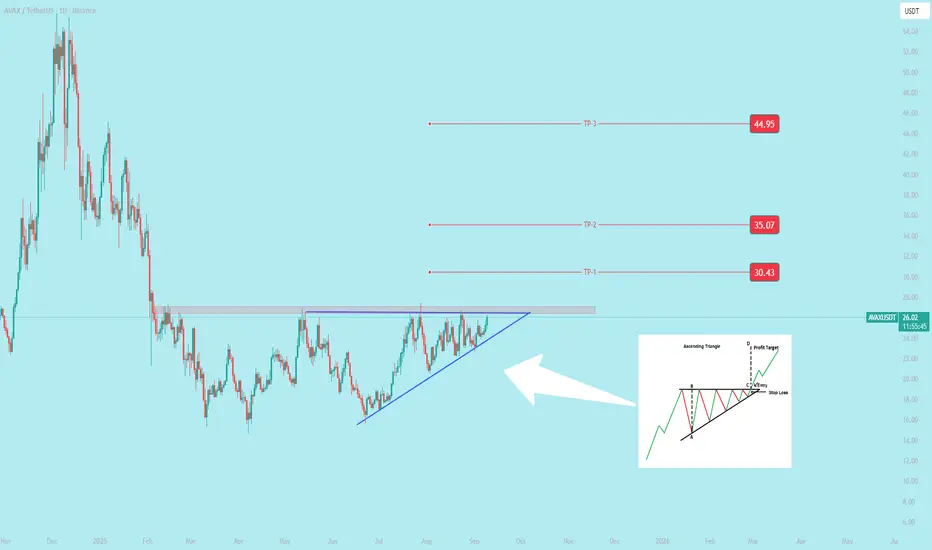
$AVAX Performing Bullish Ascending Triangle CRYPTOCAP:AVAX Performing Bullish Ascending Triangle
a continuation chart pattern in technical analysis that signals a likely breakout to the upside. It suggests that buying pressure is increasing, and buyers are becoming more aggressive, while sellers are losing momentum.
Avalanche sale!With how strong the Avax/btc ratio is, we look at this sell off in avalanche as a great buy the dip opportunity. If this level holds at the 0.5% fib level, Avalanche has a high probability target of $37. If you entered with $100,000 at the 0.5% fib level, you have a chance to make $25,000.

AVAX SHORTI'm taking this short position for BINANCE:AVAXUSDT.P . It's risky because it's near the top, and they can always eliminate the stop-loss with a shadow!
#AVAX/USDT : The Calm Before the Squeeze Storm#AVAX
The price is moving within a descending channel on the 1-hour frame, adhering well to it, and is heading for a strong breakout and retest.
We have a bearish trend on the RSI indicator that is about to be broken and retested, which supports the upward move.
There is a major support area in green at 28.30, representing a strong support point.
For inquiries, please leave a comment.
We are in a consolidation trend above the 100 Moving Average.
Entry price: 29.10
First target: 29.41
Second target: 29.90
Third target: 30.50
Don't forget a simple matter: capital management.
When you reach the first target, save some money and then change your stop-loss order to an entry order.
For inquiries, please leave a comment.
Thank you.

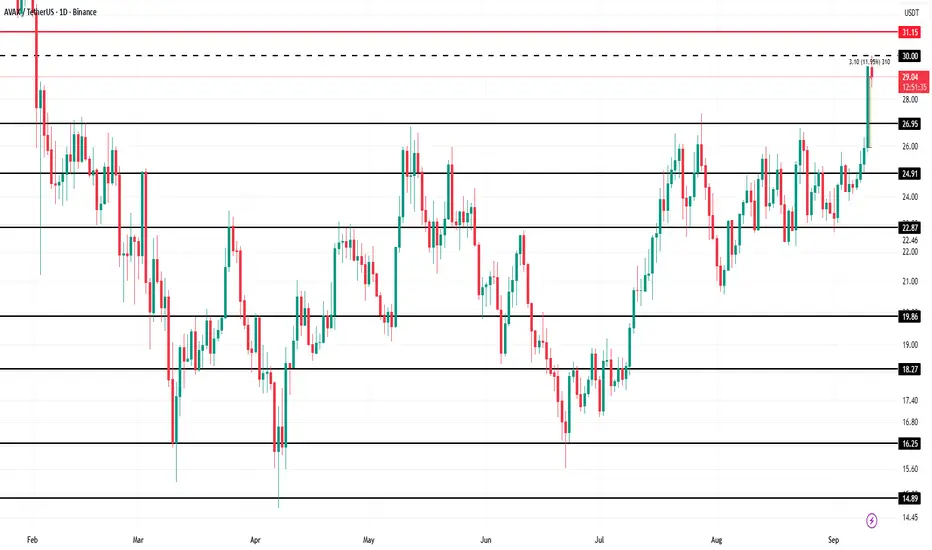
AVAX Price Hits 7-Month High, Seeks $1 Billion for Crypto FirmsAt the time of writing, AVAX is trading at $29.00 after rising 11.3% in a single day. The surge pushed the token to a 7-month high, though it is currently facing resistance at $30.00.
If investor enthusiasm holds, Avalanche could flip the $30.00 resistance into support, enabling a move toward $31.15 or higher. Sustained inflows and stronger correlation with Bitcoin would reinforce this bullish trajectory.
However, risks remain. If investors begin booking profits at current levels, AVAX could lose momentum. A dip to the $27.00 support or even further to $25.86 would erase much of the recent rally and invalidate the bullish thesis in the short term.
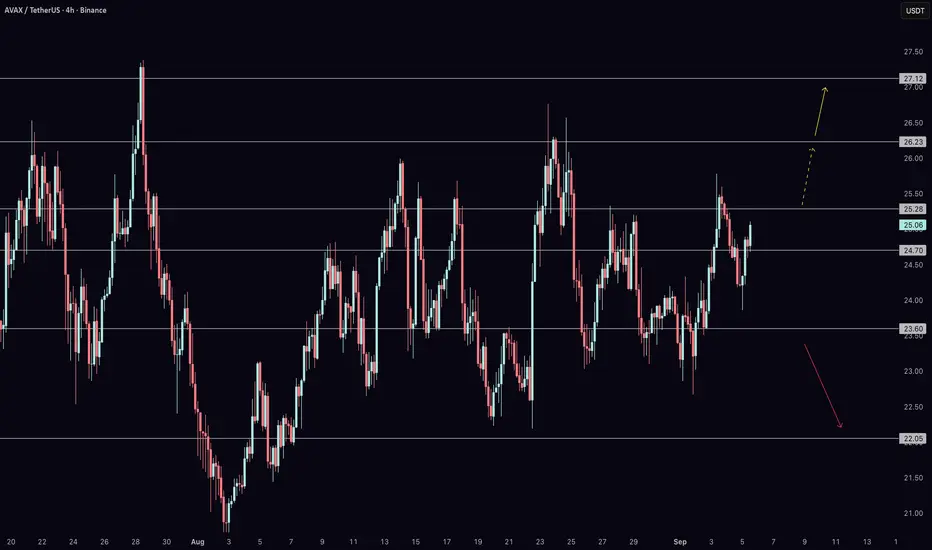
AVAXUSDT BINANCE:AVAXUSDT is ranging near 23.50, with support at 23.10 and resistance at 26.53. Momentum leans bearish, and losing 23.10 could target 21.20, while holding it may trigger a bounce.

Avalanche with a close above the double bottom necklineNot sure whether it will validate the breakout here or go back below the neckline, but that was a very convincing bullish candle close above the neckline on the previous daily candle so it should give it some reasonable probability. *not financial advice*
AVAX is Winding Up for a Monster MoveAVAX has been trading inside a large wedge pattern, where price is getting squeezed between a key descending resistance line on the top and a key ascending support line on the bottom. Every touch on these trendlines has triggered strong reactions, showing how important they are for market participants.
Right now, AVAX is holding above its ascending support, which has acted as a solid foundation multiple times in the past. If price manages to push higher and break above the descending resistance, it could unlock strong upside momentum and shift sentiment more bullish. On the other hand, if it fails to sustain this support, we could see another retest of the lower zone before any major move.
Overall, the structure is tightening, and a big breakout looks closer with each passing week.
#PEACE
Follow for more updates like this
THANKS

AVAX - BULLISH PENNANT CRYPTOCAP:AVAX - Setup shared few days ago around 23.00$ 📈
Current price 24.85$
80% chance to goes up for me! 🚀
I'm in 🚀

AVAX Ready for Breakout After NFP Shock?Avalanche (AVAX) is holding key support and showing signs of strength after today’s NFP report came in much weaker than expected. That release sparked volatility across risk assets, and with Bitcoin leaning bullish, AVAX could be setting up for its next leg higher. In this video, I break down both the daily and 4-hour charts to map out the critical levels you need to watch.
From $22 support to resistance levels at $26.2, $27.1, and $30.6, the structure remains constructive as long as AVAX holds above its floor. A decisive breakout opens the path toward $39 and potentially $48 in the medium term. Join me as I explain the bullish roadmap, the downside risks, and how this all connects back to Bitcoin’s momentum after NFP.
AVAX Analysis (1D)From the point where we placed the red arrow on the chart, it seems a correction has begun.
This correction appears to be a Diametric pattern, and wave E does not seem to be complete yet. It's expected that wave E will finish within the green zone.
The target could be the red box area.
A daily candle closing below the invalidation level would invalidate this analysis.
invalidation level: 10.90$
For risk management, please don't forget stop loss and capital management
When we reach the first target, save some profit and then change the stop to entry
Comment if you have any questions
Thank You

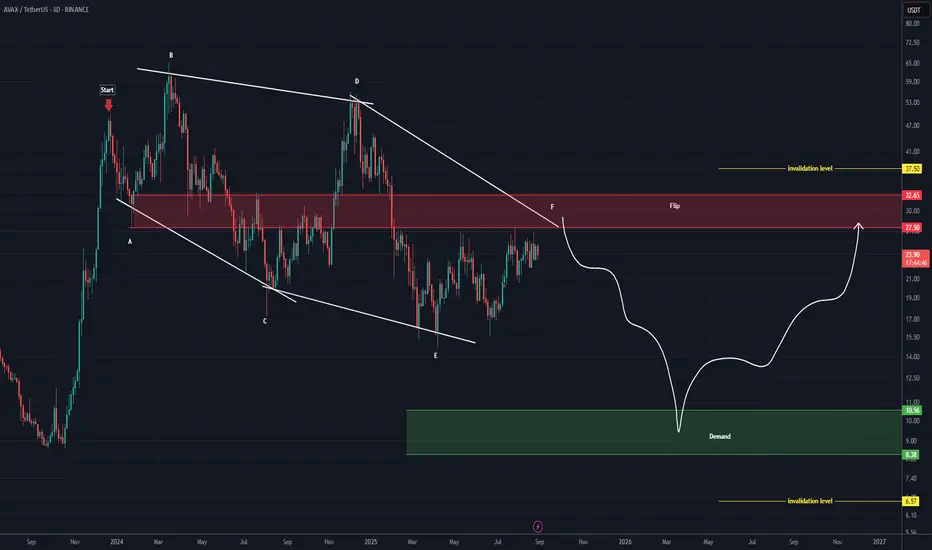
AVAX Analysis (3D)This analysis is an update of the analysis you see in the "Related publications" section
Before anything else, pay attention to the timeframe: it’s the 3-day timeframe.
The structure that AVAX is following is a large diametric, where wave F of this diametric is expected to end within the red-marked zone. After that, the price is anticipated to enter the bearish G wave.
Wave G could extend down to the main order block, which is the green-marked zone.
For both the bearish and bullish scenarios, the invalidation levels are marked on the chart. A daily candle closing above or below these levels will invalidate the respective outlook.
For risk management, please don't forget stop loss and capital management
Comment if you have any questions
Thank You
AVAX: GOOD PRICE!!!Hello friends
Given the arrival of buyers and the good price growth, now that we are in a price correction, there is a good opportunity to buy in steps in the specified areas with risk and capital management and move towards the specified goals.
*Trade safely with us*

Avalanche seeks to retest $23.6 ┆ HolderStatBINANCE:AVAXUSDT on the 6h chart has rebounded from the $23.5 support zone, showing strength after a series of ascending triangle formations. The price action is coiling within a larger channel, with repeated rebounds confirming this level as a key base. If momentum continues, $25–27 becomes the next upside objective while $23.5 remains critical as invalidation.

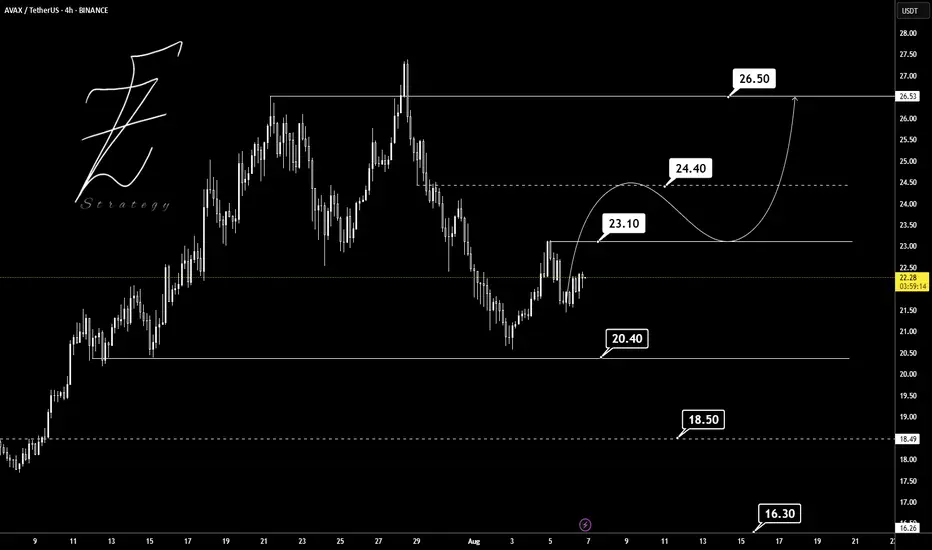
AVAXUSDT The overall trend of BINANCE:AVAXUSDT on the 4H timeframe shows signs of a potential bullish reversal, as a higher low has formed around the 20.40 support level after a strong downtrend. Currently, the price is ranging between the key support at 20.40 and the resistance at 23.10. A breakout above 23.10 could push the price toward the next major resistance at 24.40, which is a critical decision zone for the market. If buyers maintain momentum and break above 24.40, the next bullish target will be around 26.50 ✅ However, if the 20.40 support fails to hold, lower supports at 18.50 and 16.30 may come into play. The momentum currently leans slightly bullish, but price behavior between 23.10 and 24.40 will determine the next strong move. 📊
Key Support & Resistance Levels:
Supports: 20.40 – 18.50 – 16.30
Resistances: 23.10 – 24.40 – 26.50
Always remember to manage and control your risk properly. 🔒
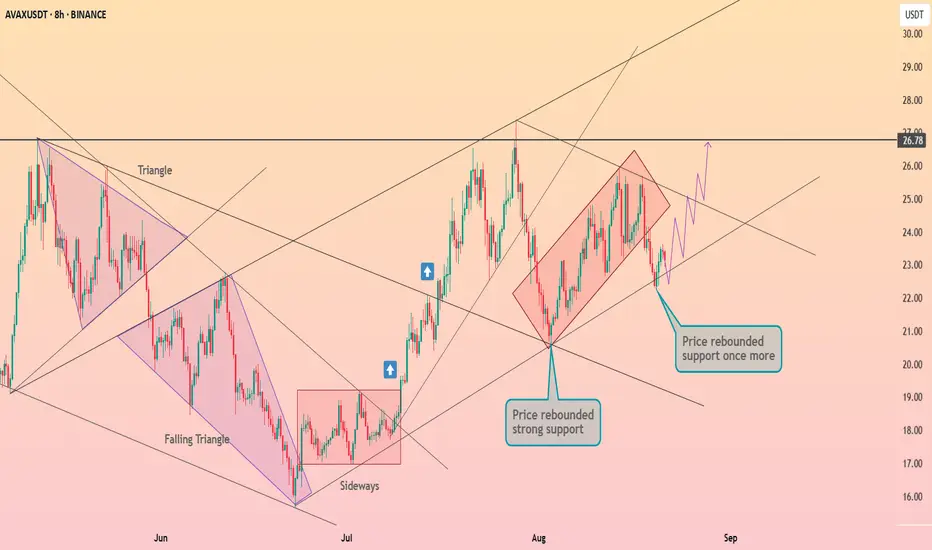
Avalanche bounced back from the support line again ┆ HolderStatBINANCE:AVAXUSDT is bouncing once more from the $22 support, continuing its series of triangle and consolidation-driven rallies. The current rebound could fuel a test of $26.78 resistance. If bulls push through, price momentum may target $30 next, with the overall channel structure favoring higher highs.
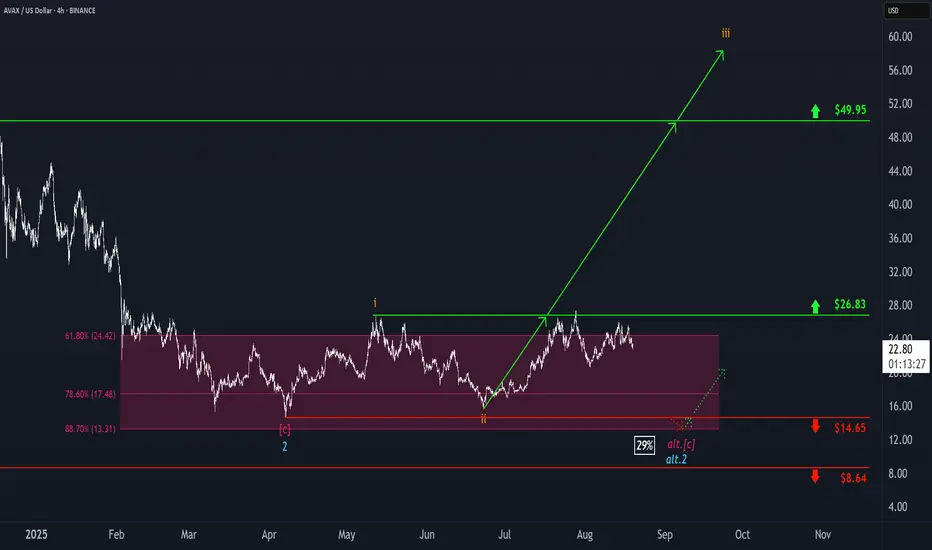
Avalanche: Poised for BreakoutFor Avalanche’s AVAX, we primarily expect the ongoing orange wave iii to break out to the upside from our magenta Target Zone ($13.31–$24.42). Afterward, the altcoin should clear the resistance levels at $26.83 and $49.95. Our alternative scenario remains unchanged: there is a 29% probability that a new low of turquoise wave alt.2 could occur below the $14.65 support – but still within the Target Zone – before the anticipated upward move. However, we primarily consider the “regular” turquoise wave 2 as already complete.
AVAX : Low price and high potentialHello friends
Due to the decline we had, the price of this currency has decreased significantly and has reached good support areas, and the specified areas can be considered good support areas.
If it breaks through the support areas, the price can move to the specified targets.
*Trade safely with us*
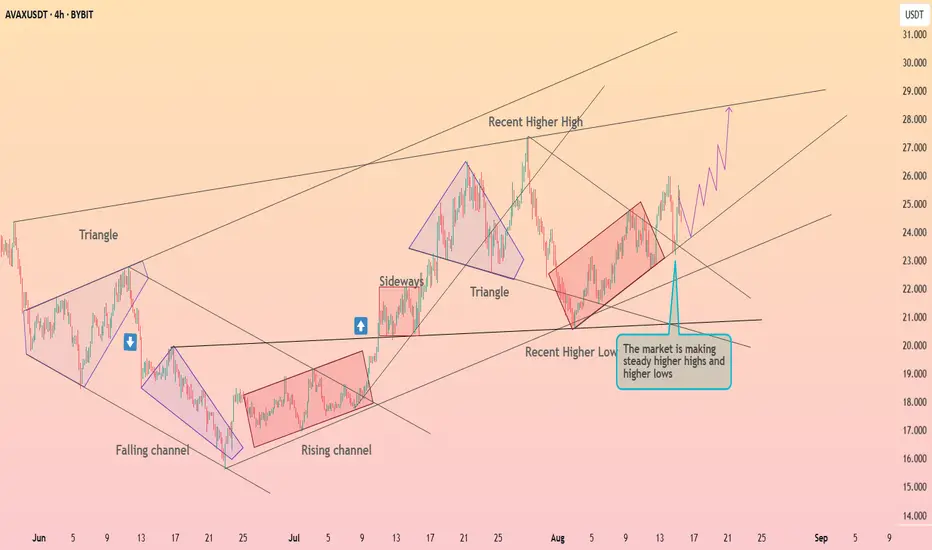
Avalanche maintains an upward structure ┆ HolderStatBYBIT:AVAXUSDT is maintaining a strong bullish structure, printing steady higher highs and higher lows. After breaking out of consolidation patterns, the market shows momentum for a run toward $27–$28. Support at $23 remains a critical level for bulls to defend in order to sustain the uptrend.
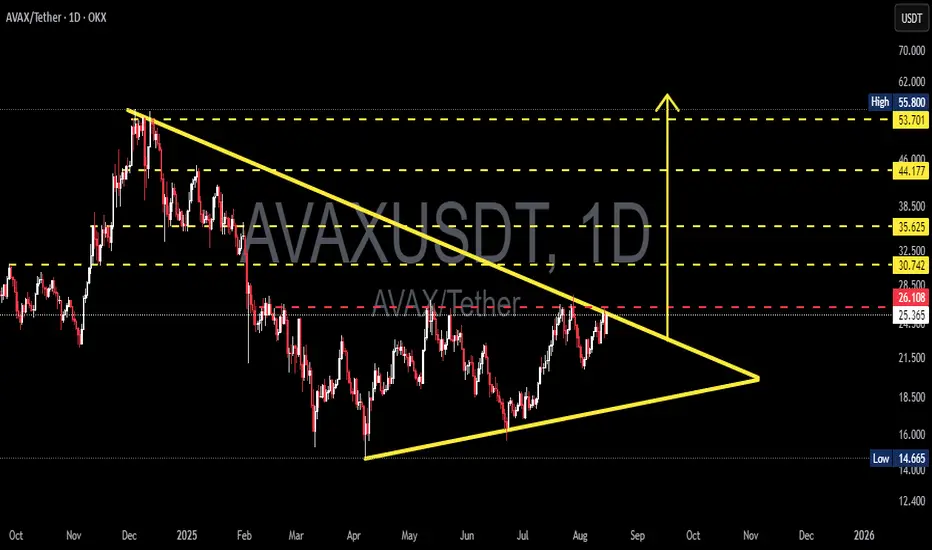
AVAX/USDT — Symmetrical Triangle Approaching Breakout?Overview:
The daily chart shows AVAX forming a symmetrical triangle (converging trendlines) since the Dec–Jan peak. Price is now testing the upper resistance trendline (~26.1 USDT) — we’re at a critical point heading toward the apex (late September). Volume behavior and a confirmed daily candle close will be key to determining the breakout direction.
---
1) Pattern Description
Pattern: Symmetrical Triangle — characterized by lower highs (descending resistance line from the peak) and higher lows (ascending support line from the April bottom). Price range is narrowing → volatility dropping → usually leads to a strong move when the pattern resolves.
Context: The broader trend before the triangle was bearish (drop from ~55.8). Symmetrical triangles can be neutral but often resolve in the direction of the prior trend — technical confirmation is essential.
---
2) Key Levels (from chart)
Upper resistance trendline / critical level: ~26.10 USDT (red dashed line), current price ≈ 25.3 USDT.
Major resistance targets: 30.74, 35.62, 44.18, 53.70 – 55.80.
Ascending support trendline: around 18–22 USDT depending on timing.
Structural low: 14.665 USDT (chart low).
(Values estimated visually from chart — verify with live data before trading.)
---
3) Bullish Scenario (if breakout upward)
Bullish Trigger
Daily close above descending trendline (~26.1) with strong volume → breakout confirmation.
Preferably supported by bullish technical indicators (RSI, MACD bullish crossover, rising OBV).
Targets
Step targets: 30.7 → 35.6 → 44.2 → 53.7 (partial profit-taking recommended).
Measured move theoretical target:
− Height ≈ 55.800 − 14.665 = 41.135.
− Added to breakout point (~26.108) → theoretical target ≈ 67.24 USDT (for reference, not guaranteed).
Risk Management
Stop-loss: daily close back below breakout trendline or under nearest swing low (e.g., conservative SL < 21–22 USDT).
Strategy: scale in — partial entry before breakout, add after confirmation. Monitor risk/reward closely.
---
4) Bearish Scenario (if rejected / breakdown)
Bearish Trigger
Rejection at upper trendline + bearish daily candle (and/or rising sell volume) → drop to ascending support.
Breakdown confirmation: daily close below ascending trendline with strong volume.
Targets
Initial drop to ascending support ~18–22 USDT.
If breakdown continues → possible retest of 14.66 USDT low.
Risk Management for Shorts / Cut-loss
SL for shorts: daily close above resistance (~>28 USDT) or above fake breakout highs.
Beware of bull traps — volume confirmation reduces risk.
---
5) Practical Trade Plans (example)
Conservative Long: Wait for daily close > 26.1 + strong volume → enter 50% position; add after retest. Targets: 30.7 / 35.6. SL under retest zone (~21–22).
Conservative Short: If clear rejection at upper trendline → short toward lower trendline. SL above recent high (~28).
Range Trading: Buy near lower trendline, sell near upper trendline until breakout confirmed.
---
6) Risk & Confluence Checks
Broader market/Bitcoin sentiment: AVAX is often correlated, which can amplify moves.
Supporting indicators: check volume, RSI, MACD, EMA(50/200) for confirmation.
Watch for false breakouts — confirm with volume + retests.
---
7) Summary
> AVAX is forming a Symmetrical Triangle. Critical resistance at ~26.1 USDT — daily close + volume will decide the next move. Valid breakout → step targets at 30.7 / 35.6 / 44.2 (measured move theoretical ~67.2). Rejection / breakdown → support at 18–22 and possible drop to 14.66. Manage risk with confirmation, stop-loss, and partial profit-taking.
#AVAX #AVAXUSDT #Crypto #TechnicalAnalysis #Triangle #Breakout #SupportResistance #Altcoin #SwingTrading