Avalanche AVAX price analysisCRYPTOCAP:AVAX right on the bottom of the 2-year channel!
The price of CRYPTOCAP:AVAX is once again touching the lower boundary of a massive channel that has been forming for more than 24 months.
And what’s interesting — #Avalanche has strong fundamentals, active development, and a “starting” market cap of $5.5B 💰
📈 So… is it finally time for OKX:AVAXUSDT to move up?
🔹 Conservative target: +100% → $26
🔹 Ambitious but realistic: upper channel → $41–42 (+225%)
Looks juicy, right? 🤔
Do you think CRYPTOCAP:AVAX is gearing up for a breakout — or are we in for another round of accumulation?
______________
◆ Follow us ❤️ for daily crypto insights & updates!
🚀 Don’t miss out on important market moves
🧠 DYOR | This is not financial advice, just thinking out loud
AVAXUSDTPERP

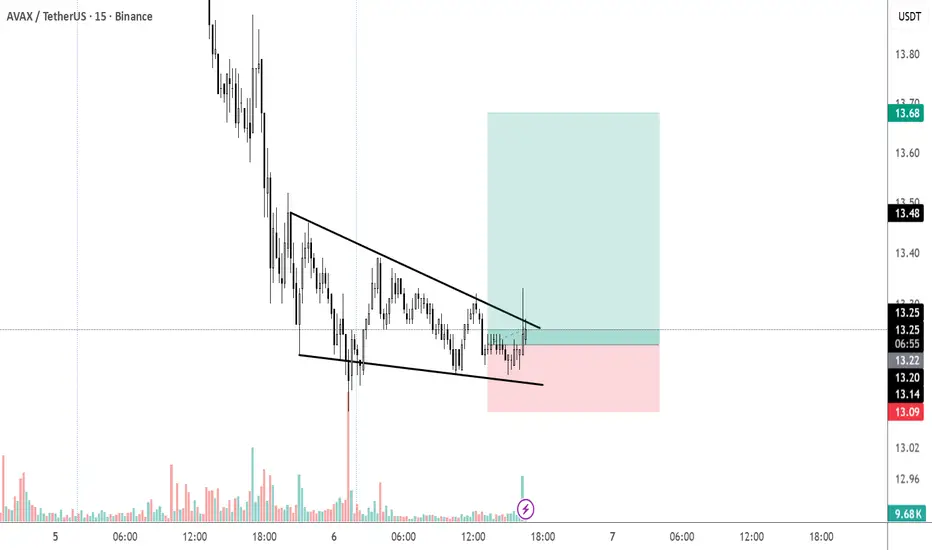
AVAX – 15m Technical Analysis (Breakout Setup)🔥 AVAX – 15m Technical Analysis (Breakout Setup)
( BINANCE:AVAXUSDT )
✅ 1) Pattern Analysis – Falling Wedge
A falling wedge usually signals that sellers are weakening, and buyers are absorbing liquidity.
What confirms the breakout?
Price broke above the wedge’s upper trendline.
A large bullish candle with increased volume.
Retest area around 13.20–13.25, which is happening now.
📌 This is a classic bullish breakout behaviour.
✅ 2) Entry Logic
The entry around 13.25 is technically correct because:
It's exactly at the breakout retest zone.
Buying pressure is visible.
Volume supports continuation.
This setup is high probability when supported by volume (which is clearly rising).
✅ 3) Stop Loss (SL)
Your SL below 13.05 – 13.10 is perfect because:
It sits below the wedge structure.
If price returns below this level, the breakout becomes invalid.
This is the correct technical placement.
✅ 4) Take Profit (TP) Projection
Your TP zone around 13.70 – 13.80 is realistic and matches:
Previous major support turned resistance.
Measured move of wedge height placed at breakout.
High-volume node from earlier.
✔ Expected targets:
TP1 → 13.48 (first resistance)
TP2 → 13.68 (upper range)
TP3 → 13.78–13.80 (full wedge target)
✅ 5) Market Behaviour to Expect
After a falling wedge breakout, price typically:
Breaks the trendline ✔
Pulls back slightly to retest the breakout level
Then accelerates upward toward targets
AVAX/USDT - Heads Into Major Demand Zone — Bounce or Breakdown?AVAX is currently standing at one of its most critical decision points since 2023. After failing to hold its multi-year ascending trendline, the price finally broke down and closed the weekly candle below the structural level at $15.7. This isn’t a normal correction — this is a signal that the market structure has shifted, and AVAX is entering a survival phase.
But the story is far from over. Price is now sliding into a zone that has historically acted as a deep accumulation region:
$10.7 – $8.5
This yellow block is where large-volume buyers previously stepped in during the 2022 crash and later consolidated before major moves.
The long wick sweeping into this zone indicates early buyer activity — but not enough to reclaim structural levels yet.
Right now, AVAX is in the middle of a high-timeframe battlefield between two major outcomes:
Bullish Reversal Scenario → Price reclaims $15.7 and climbs back above the broken trendline.
Bearish Breakdown Scenario → Price loses $10.7, falls deeper into the accumulation block, and risks testing historical lows near $5.7.
---
Bullish Scenario — (Reversal Trigger: $15.7)
A bullish reversal starts to form if AVAX can:
1. Bounce strongly from $10.7–$8.5, and
2. Close a weekly candle back above $15.7.
This would signal that significant accumulation has taken place and that smart money is re-entering the market.
Major upside targets become:
$20.80 → First structural resistance
$32.90 → Mid-range breakout
$54.30 → High-timeframe trend reversal confirmed
This is the “comeback path” for AVAX.
---
Bearish Scenario — (Breakdown Trigger: $10.7)
If AVAX fails to hold above $10.7 on the weekly, the long-standing demand zone collapses.
Downside implications:
Immediate drop toward $8.5
If $8.5 also breaks →
Price opens the door to a deeper decline toward the historical low around $5.7
This would confirm a major redistribution phase, not just a pullback.
---
Price Action & Market Structure
AVAX is forming lower highs and lower lows, confirming a weekly downtrend.
Breaking the ascending trendline marks a clear character shift.
The $10.7–$8.5 zone now acts as the final defense for bulls before entering a multi-year lower range.
Expect liquidity sweeps & stop hunts in this region — patience and weekly confirmation are key.
---
AVAX is now sitting inside a make-or-break zone that will determine its multi-month direction.
Hold $10.7–$8.5 → Potential strong reversal back toward $20–$30
Break below $10.7 → Deeper bearish continuation toward the $5.7 region
This is the type of price zone where professional traders wait for confirmation, not quick reactions.
---
#AVAX #Avalanche #CryptoTA #AVAXUSDT #TechnicalAnalysis #Altcoins #PriceAction #MarketStructure #CryptoOutlook #SupportAndResistance

$AVAX at last and crucial support!CRYPTOCAP:AVAX has dropped back into a major multi-year support zone after a sharp weekly selloff. This level has held the range multiple times since 2021, and the price is now reacting around the same support + long-term trendline.
If AVAX manages to hold this area, a bounce toward the mid-range levels ($21.40 → $33.22) becomes possible. Failure to hold support would expose lower targets.
This zone is critical — CRYPTOCAP:AVAX either stabilizes here or breaks structure for a deeper move.
Fundamental Analysis:
BINANCE:AVAXUSDT stands out as a leading Layer-1 blockchain, known for speed, scalability, and growing real-world asset (RWA) adoption. Subnet activity is rising, DeFi liquidity is improving, and the network’s decentralized finance ecosystem is gaining fresh momentum. Exchange reserves continue to decline, showing healthy on-chain fundamentals and liquid supply trends.
Latest Updates:
- Avalanche recently completed a major network upgrade, temporarily suspending AVAX C-Chain deposits and withdrawals for enhanced security.
- Its DeFi roadmap features the V1 launch on Sepolia testnet (Q4 2025), including new liquidity pools and support for ETH and USDT.
- Recent audits and a $50k bug bounty solidify Avalanche’s reputation for security and reliability.

AVAX on Track — Ready for a ComebackFor me, AVAXUSDT is starting to show clear signs of growth 🚀
The chart structure looks encouraging — I like the way bulls are slowly stepping in and building momentum for a potential move to the upside.
🎯 Target: 18,400
❌ Invalidation zone (stop): 16,789
Let’s see how the market plays it out — the setup looks promising!
⚠️ Disclaimer:
This is not a financial signal. Trade according to your own risk management and never trade without stop-losses.
💬 Drop your reactions and comments below — and hit follow if you’d like me to post regular updates and forecasts on AVAX!

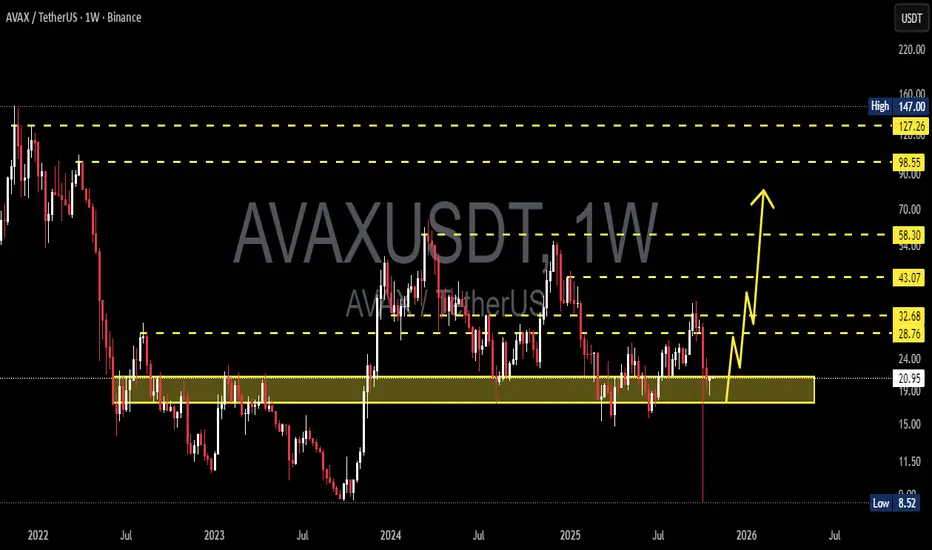
AVAXUSDT – Critical Support Zone: Will Decide the Next Trend?Yellow Block (Support Zone): 21 – 17.5 (Weekly)
This zone is the bulls’ last stronghold, an area that has historically marked AVAX’s major turning points. Price has now returned to this critical region — and what happens next could define the next macro trend.
---
Market Structure & Big Picture
After a long downtrend since 2022, AVAX has entered a macro consolidation phase, ranging between $17.5 and $43.
The current movement sits right at the bottom of this range, making the upcoming weekly close extremely important.
Major Range: 17.5 – 43
Key Support: 21 – 17.5
Main Resistance: 28.7 – 32.7 → 43.1 → 58.3
Historical High: 127 – 147
Historical Low: 8.5
This yellow zone isn’t just a technical area — it’s a battleground between long-term accumulation and potential distribution.
Every time AVAX touched this region in the past, price rebounded significantly, suggesting a possible mid-term reversal opportunity if bulls defend it again.
---
Pattern & Technical Characteristics
The chart currently shows a sideways accumulation pattern over more than a year.
Each retest of the 21–17.5 zone has produced deep wicks and strong rejections — signals of institutional absorption or smart money re-entry.
However, if this support fails, it could trigger a structural breakdown and re-open the path toward the lower double-digit region.
Potential pattern formations:
Double Bottom (Reversal) if price bounces and breaks above 28–33
Descending Channel Breakdown if price loses 17.5 with a confirmed close
---
Bullish Scenario – “Bounce From The Abyss”
If the weekly candle closes above 21, the support remains intact — and this could mark the start of a strong reversal swing.
Bullish confirmation signals:
Strong rejection with long lower wick
Rising volume during recovery
Weekly close > 24
Upside targets:
1. 28.7 → First resistance zone
2. 32.7 → Structural breakout confirmation
3. 43.1 → Major swing target
4. 58.3 → Mid-term continuation goal
Potential gain: 35% up to 170% from current levels if the bullish setup plays out.
---
Bearish Scenario – “Breaking the Last Line of Defense”
If the weekly close falls below 17.5, it confirms a macro breakdown.
AVAX could enter a new redistribution phase, targeting 12.0 – 9.0, and possibly 8.5 if a market-wide capitulation occurs.
Bearish confirmation signals:
Weekly close < 17.5
High-volume selling pressure
Failed retest (17.5 flips into resistance)
This would shift the macro bias fully bearish, and patient traders might wait for a new accumulation phase at much lower levels.
---
Conclusion & Macro Sentiment
AVAX currently sits in a golden decision zone — the line between collapse and recovery.
As long as the price holds above 21–17.5, the potential for a macro rebound remains strong.
But a confirmed breakdown below that area would signal that the accumulation phase isn’t over yet, and the market might need one final washout before a full recovery.
---
#AVAX #AVAXUSDT #CryptoAnalysis #TechnicalAnalysis #WeeklyChart #CryptoMarket #AltcoinAnalysis #TradingView #SwingTrading #SupportAndResistance #Avalanche #CryptoReversal #MarketStructure #CryptoUpdate
AVAXUSDTAVAXUSDT have a uptrend and is now this trend because we have higher high and higher low.
Next Target is 45$ and best levels for buy: 31$ - 27$
⚠️Please control risk management.

#AVAX/USDT : The Calm Before the Squeeze Storm#AVAX
The price is moving within a descending channel on the 1-hour frame, adhering well to it, and is heading for a strong breakout and retest.
We have a bearish trend on the RSI indicator that is about to be broken and retested, which supports the upward move.
There is a major support area in green at 28.30, representing a strong support point.
For inquiries, please leave a comment.
We are in a consolidation trend above the 100 Moving Average.
Entry price: 29.10
First target: 29.41
Second target: 29.90
Third target: 30.50
Don't forget a simple matter: capital management.
When you reach the first target, save some money and then change your stop-loss order to an entry order.
For inquiries, please leave a comment.
Thank you.

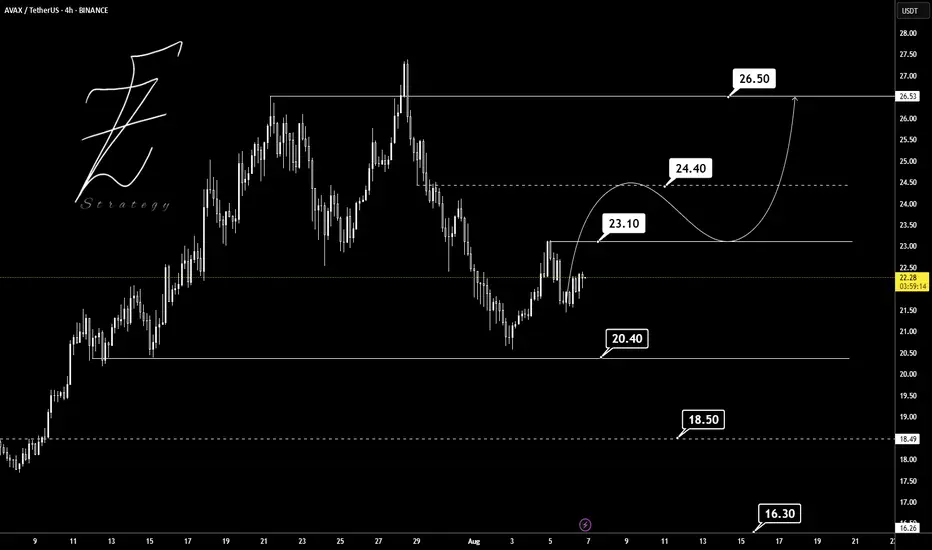
AVAXUSDT BINANCE:AVAXUSDT is ranging near 23.50, with support at 23.10 and resistance at 26.53. Momentum leans bearish, and losing 23.10 could target 21.20, while holding it may trigger a bounce.

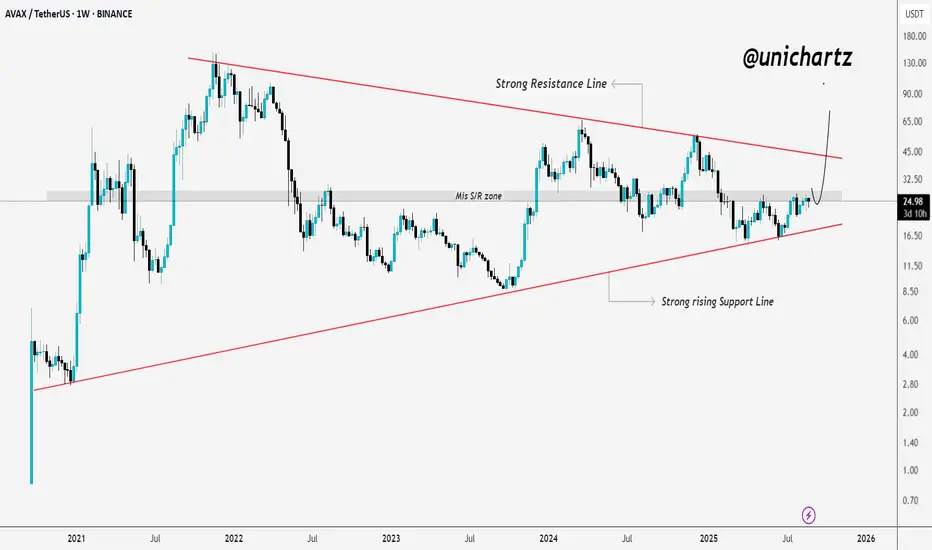
AVAX is Winding Up for a Monster MoveAVAX has been trading inside a large wedge pattern, where price is getting squeezed between a key descending resistance line on the top and a key ascending support line on the bottom. Every touch on these trendlines has triggered strong reactions, showing how important they are for market participants.
Right now, AVAX is holding above its ascending support, which has acted as a solid foundation multiple times in the past. If price manages to push higher and break above the descending resistance, it could unlock strong upside momentum and shift sentiment more bullish. On the other hand, if it fails to sustain this support, we could see another retest of the lower zone before any major move.
Overall, the structure is tightening, and a big breakout looks closer with each passing week.
#PEACE
Follow for more updates like this
THANKS

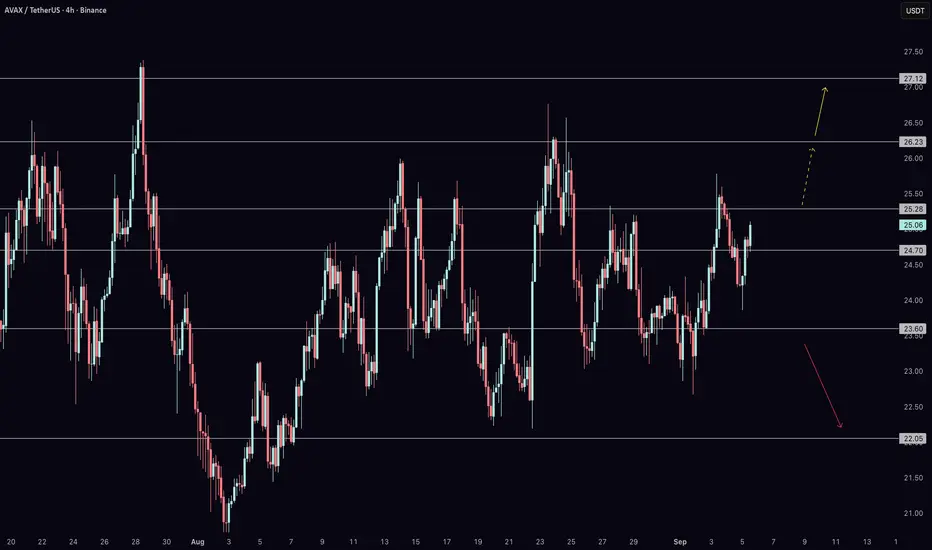
AVAX Ready for Breakout After NFP Shock?Avalanche (AVAX) is holding key support and showing signs of strength after today’s NFP report came in much weaker than expected. That release sparked volatility across risk assets, and with Bitcoin leaning bullish, AVAX could be setting up for its next leg higher. In this video, I break down both the daily and 4-hour charts to map out the critical levels you need to watch.
From $22 support to resistance levels at $26.2, $27.1, and $30.6, the structure remains constructive as long as AVAX holds above its floor. A decisive breakout opens the path toward $39 and potentially $48 in the medium term. Join me as I explain the bullish roadmap, the downside risks, and how this all connects back to Bitcoin’s momentum after NFP.
AVAX Prepping for Explosive Move – Watch the ZoneCRYPTOCAP:AVAX is showing strength on the weekly chart, approaching a key mid S/R zone that’s acted as a pivot in the past.
If bulls can break and close above this level, it could trigger strong upside momentum.
The price is currently squeezed between a rising support and a descending resistance, a typical breakout setup.
I’m waiting for a confirmed weekly close above the zone before looking for longs. If that happens, a move toward $42+ is likely.
DYOR, NFA
AVAXUSDT The overall trend of BINANCE:AVAXUSDT on the 4H timeframe shows signs of a potential bullish reversal, as a higher low has formed around the 20.40 support level after a strong downtrend. Currently, the price is ranging between the key support at 20.40 and the resistance at 23.10. A breakout above 23.10 could push the price toward the next major resistance at 24.40, which is a critical decision zone for the market. If buyers maintain momentum and break above 24.40, the next bullish target will be around 26.50 ✅ However, if the 20.40 support fails to hold, lower supports at 18.50 and 16.30 may come into play. The momentum currently leans slightly bullish, but price behavior between 23.10 and 24.40 will determine the next strong move. 📊
Key Support & Resistance Levels:
Supports: 20.40 – 18.50 – 16.30
Resistances: 23.10 – 24.40 – 26.50
Always remember to manage and control your risk properly. 🔒
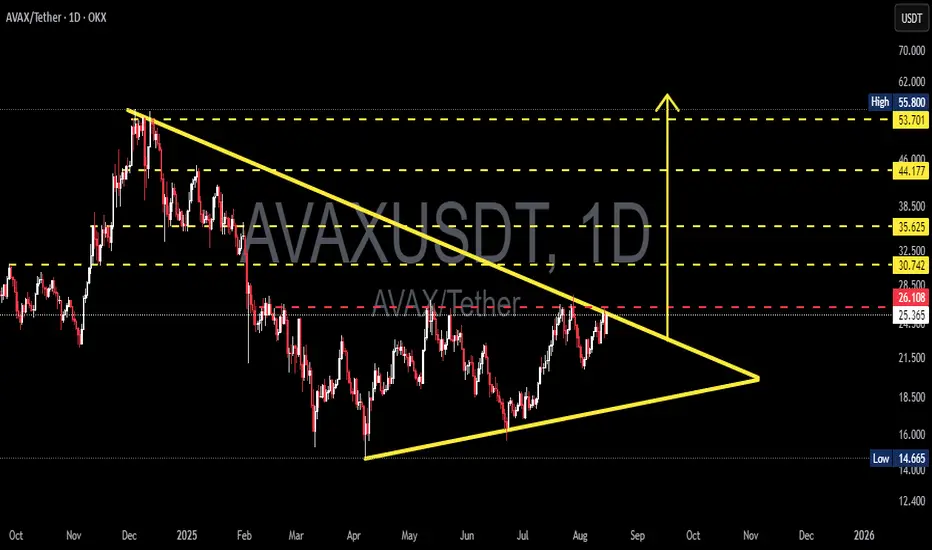
AVAX/USDT — Symmetrical Triangle Approaching Breakout?Overview:
The daily chart shows AVAX forming a symmetrical triangle (converging trendlines) since the Dec–Jan peak. Price is now testing the upper resistance trendline (~26.1 USDT) — we’re at a critical point heading toward the apex (late September). Volume behavior and a confirmed daily candle close will be key to determining the breakout direction.
---
1) Pattern Description
Pattern: Symmetrical Triangle — characterized by lower highs (descending resistance line from the peak) and higher lows (ascending support line from the April bottom). Price range is narrowing → volatility dropping → usually leads to a strong move when the pattern resolves.
Context: The broader trend before the triangle was bearish (drop from ~55.8). Symmetrical triangles can be neutral but often resolve in the direction of the prior trend — technical confirmation is essential.
---
2) Key Levels (from chart)
Upper resistance trendline / critical level: ~26.10 USDT (red dashed line), current price ≈ 25.3 USDT.
Major resistance targets: 30.74, 35.62, 44.18, 53.70 – 55.80.
Ascending support trendline: around 18–22 USDT depending on timing.
Structural low: 14.665 USDT (chart low).
(Values estimated visually from chart — verify with live data before trading.)
---
3) Bullish Scenario (if breakout upward)
Bullish Trigger
Daily close above descending trendline (~26.1) with strong volume → breakout confirmation.
Preferably supported by bullish technical indicators (RSI, MACD bullish crossover, rising OBV).
Targets
Step targets: 30.7 → 35.6 → 44.2 → 53.7 (partial profit-taking recommended).
Measured move theoretical target:
− Height ≈ 55.800 − 14.665 = 41.135.
− Added to breakout point (~26.108) → theoretical target ≈ 67.24 USDT (for reference, not guaranteed).
Risk Management
Stop-loss: daily close back below breakout trendline or under nearest swing low (e.g., conservative SL < 21–22 USDT).
Strategy: scale in — partial entry before breakout, add after confirmation. Monitor risk/reward closely.
---
4) Bearish Scenario (if rejected / breakdown)
Bearish Trigger
Rejection at upper trendline + bearish daily candle (and/or rising sell volume) → drop to ascending support.
Breakdown confirmation: daily close below ascending trendline with strong volume.
Targets
Initial drop to ascending support ~18–22 USDT.
If breakdown continues → possible retest of 14.66 USDT low.
Risk Management for Shorts / Cut-loss
SL for shorts: daily close above resistance (~>28 USDT) or above fake breakout highs.
Beware of bull traps — volume confirmation reduces risk.
---
5) Practical Trade Plans (example)
Conservative Long: Wait for daily close > 26.1 + strong volume → enter 50% position; add after retest. Targets: 30.7 / 35.6. SL under retest zone (~21–22).
Conservative Short: If clear rejection at upper trendline → short toward lower trendline. SL above recent high (~28).
Range Trading: Buy near lower trendline, sell near upper trendline until breakout confirmed.
---
6) Risk & Confluence Checks
Broader market/Bitcoin sentiment: AVAX is often correlated, which can amplify moves.
Supporting indicators: check volume, RSI, MACD, EMA(50/200) for confirmation.
Watch for false breakouts — confirm with volume + retests.
---
7) Summary
> AVAX is forming a Symmetrical Triangle. Critical resistance at ~26.1 USDT — daily close + volume will decide the next move. Valid breakout → step targets at 30.7 / 35.6 / 44.2 (measured move theoretical ~67.2). Rejection / breakdown → support at 18–22 and possible drop to 14.66. Manage risk with confirmation, stop-loss, and partial profit-taking.
#AVAX #AVAXUSDT #Crypto #TechnicalAnalysis #Triangle #Breakout #SupportResistance #Altcoin #SwingTrading
AVAXUSDT AVAX Ready to Fly!!AVAXUSDT AVAX Ready to Fly!!
BINANCE:AVAXUSDT has broken out from resistance and found support at previous lows. This setup is looking strong and could mirror ETH’s bullish moves.
The major hurdle now is around $27. A breakout above this level could trigger a strong rally with significant upside potential.
Always manage your risk and keep a stop loss in place, the sky is the limit once $27 is cleared.
BINANCE:AVAXUSDT Currently trading at $23.5
Buy level : Above $23
Stop loss : Below $21
Target 1: $24.5
Target 2: $27
Target 3: $31
Max leverage 5x
Always keep stop loss
Follow Our Tradingview Account for More Technical Analysis Updates, | Like, Share and Comment Your thoughts

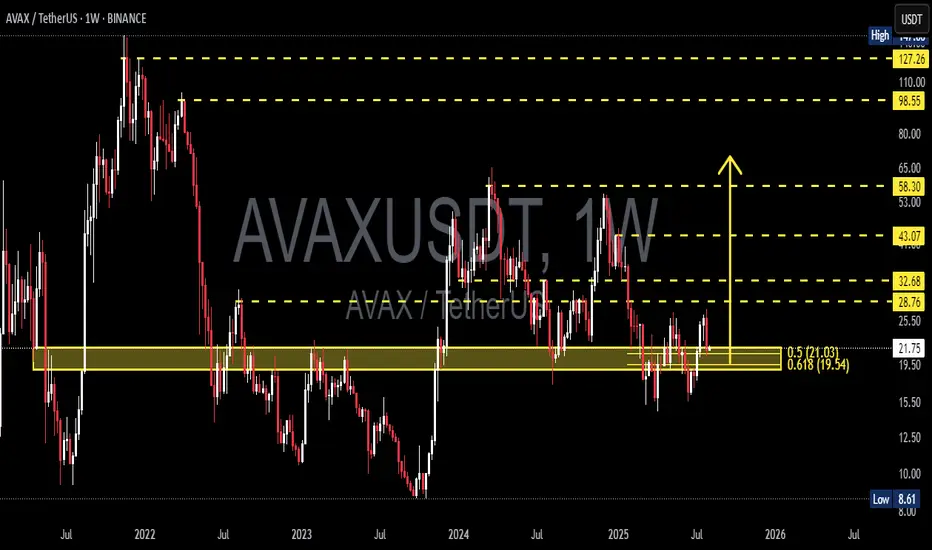
AVAX at the Edge: Golden Pocket Support or Breakdown Incoming?🧠 Overview:
AVAX is currently trading at a decisive support zone, aligned perfectly with the Fibonacci golden pocket (0.5–0.618) at $21.03–$19.54. This level has historically acted as a strong pivot zone, serving both as resistance during bear markets and support in bullish recoveries.
The market has compressed into this key demand zone after a prolonged sideways structure. Now, all eyes are on how price will react — this zone will likely determine AVAX's mid-to-long-term trend.
---
🔍 Key Technical Highlights:
🔸 Fibonacci Confluence Zone (Golden Pocket):
0.5 Fib Level: $21.03
0.618 Fib Level: $19.54
This area coincides with a weekly demand block — a high-probability reversal zone where buyers have historically stepped in.
🔸 Major Resistance Levels to Watch:
$28.76 – First significant supply zone.
$32.68 – Previous lower high, potential breakout confirmation zone.
$43.07 – Weekly structure resistance.
$58.30 – Mid-term bullish target.
🔸 Support Levels Below:
$15.00 – Local base during early 2023.
$8.61 – Multi-year low (critical support if demand collapses).
🔸 Structure Insight:
Price is currently forming a macro higher low, suggesting a potential accumulation phase. However, failure to hold this zone could trigger a bearish continuation.
---
🚀 Bullish Scenario:
If price sustains above $19.54–21.03 and breaks above $25.50, the following upside targets could be reached:
1. $28.76 – Local resistance
2. $32.68 – Break of bearish structure
3. $43.07 – Momentum extension
4. $58.30 – Bullish macro target
Catalyst to watch: Weekly bullish engulfing candle + volume spike + break of structure → these would confirm buyers are in control.
---
🔻 Bearish Scenario:
If the price breaks below $19.54 with strong bearish volume, then:
1. $15.00 – First zone of interest for buyers
2. $8.61 – Critical long-term support zone
This would confirm a distribution pattern and signal that the market may revisit lower accumulation zones before any major uptrend resumes.
---
🧩 Market Psychology Insight:
This current range is where smart money positions themselves — either for continuation or reversal. Retail traders often get shaken out in this kind of compression. Stay patient and wait for confirmation rather than anticipation.
---
🎯 Conclusion:
AVAX is now at a make-or-break point. With the price sitting in a high-confluence demand zone, traders should prepare for volatility and monitor weekly closes. A strong move in either direction will likely determine the next multi-week trend.
> “The bigger the base, the higher in space.” – If this is true accumulation, the upside could surprise many.
#AVAX #AVAXUSDT #CryptoTechnicalAnalysis #AltcoinWatch #FibonacciLevels #SupportResistance #BullishOrBearish #SmartMoneyZone #WeeklyChart #CryptoTrading #BreakoutOrBreakdown
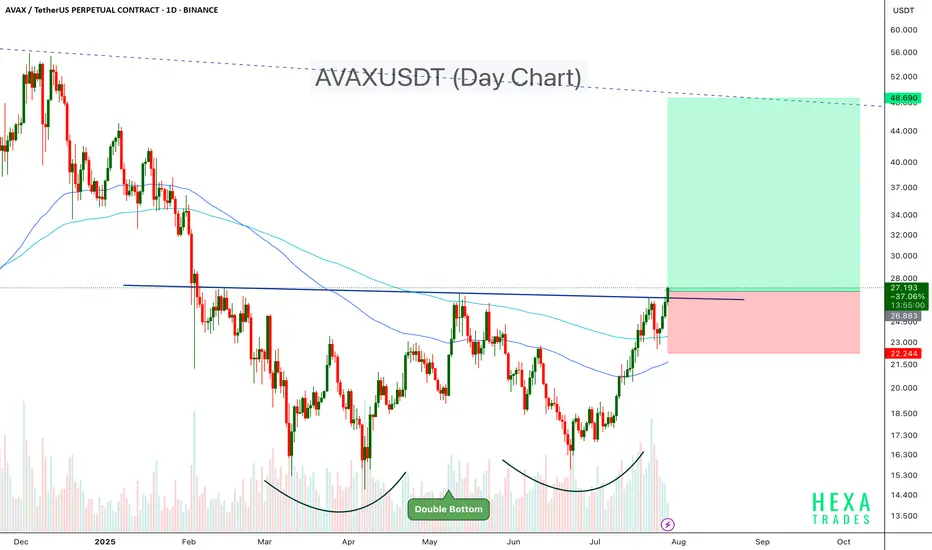
AVAXUSDT Double Bottom Confirmation.AVAX has formed a textbook double bottom pattern on the daily chart, signaling a potential reversal after months of downtrend. The neckline around the $27 zone has been broken decisively, confirming the bullish breakout.
Key Points:
- Double Bottom Structure: A strong bullish reversal pattern with a clean neckline breakout.
- Breakout Level: $27, which was acting as resistance for the past several weeks.
- Volume Surge: Noticeable increase in volume during the breakout, adding strength to the move.
- Target: $48–$50 region. ( Channel resistance)
-Stop-Loss Idea: Below $22.0
AVAX appears ready to trend higher as momentum builds. If bulls hold above the breakout zone, the rally may accelerate in the coming weeks.
Cheers
Hexa
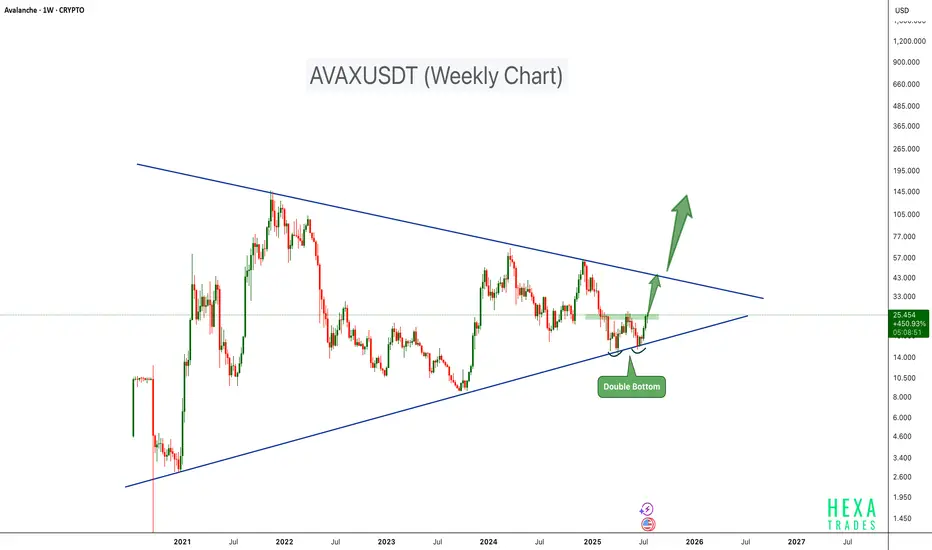
AVAX Bull Run Loading!AVAX is showing signs of a strong bullish setup on the weekly chart, forming a double bottom pattern right at the lower support trendline of a long-term symmetrical triangle. This technical formation often indicates a potential trend reversal when confirmed with breakout and volume support.
Key Points:
-Double Bottom Support around $12–$14 with bullish momentum.
-Symmetrical Triangle structure compressing price for breakout.
-Breakout Zone near $27, a close above this level may trigger strong upside.
-Upside Target: Short-term Target- $45; Long Term Target - $125
Invalidation: A Break below $15 support could negate the setup.
Cheers
Hexa
CRYPTOCAP:AVAX BINANCE:AVAXUSDT
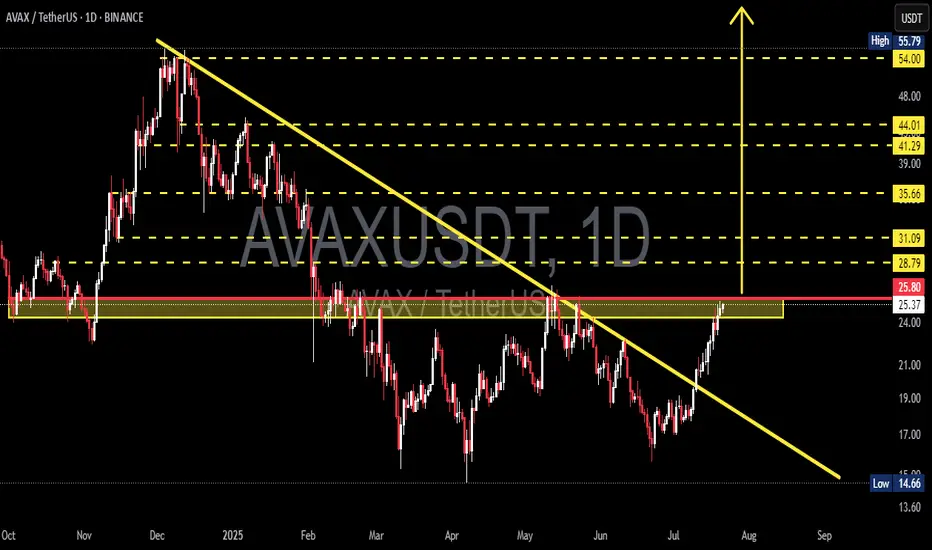
AVAX/USDT Massive Trend Reversal: Breakout from 8-Month DowntrenAVAX has just delivered one of its most technically significant moves in recent months. After spending over 8 months trapped under a descending resistance line, price action has finally broken free — suggesting a potential trend reversal and the beginning of a much larger bullish phase.
🧠 Pattern & Structure Breakdown:
📌 Descending Trendline Breakout
AVAX had been forming a descending triangle pattern, characterized by consistent lower highs and a horizontal support zone between $14.66 – $22. The recent bullish breakout from this structure, accompanied by strong volume, is a highly encouraging sign for bulls.
📌 Accumulation Zone Identified
The yellow zone on the chart ($14.66 – $22) has proven to be a strong demand zone where buyers consistently stepped in. The recent rally originates from this base, indicating possible institutional accumulation.
📌 Critical Horizontal Resistance at $25.80
Price is now testing the $25.80 resistance zone, which historically acted as a supply area. A successful daily close and confirmation above this level would officially flip the structure bullish.
📈 Bullish Scenario – Multi-Level Upside Targets:
If AVAX confirms the breakout above $25.80, these are the key bullish targets ahead:
🎯 Target 1: $28.79 – minor resistance & potential short-term TP zone
🎯 Target 2: $31.09 – previous price equilibrium
🎯 Target 3: $35.66 – key pivot from past market structure
🎯 Target 4: $41.29 and $44.01 – heavy historical supply zones
🎯 Target 5 (measured move): $54.00 to $55.79 – the projected breakout target from the descending triangle pattern
This move would represent a full technical recovery if AVAX aligns with broader market sentiment and Bitcoin remains stable or bullish.
📉 Bearish Scenario – Pullback Risks:
On the flip side, if price fails to sustain above $25.80 and gets rejected:
⚠️ A retest of $24.00 – $22.00 is likely
⚠️ If that zone breaks down, next support lies at $19.00 – $17.00
⚠️ A loss of the $17 level may trigger a return to the critical low near $14.66
This would invalidate the bullish breakout and return AVAX into a sideways or downward consolidation phase.
🔍 Additional Technical Insights:
✅ Volume is steadily increasing — showing renewed buying pressure
✅ Indicators like RSI and MACD (if applied) are likely showing bullish divergence
✅ Overall altcoin sentiment is improving, providing a tailwind for AVAX's potential breakout continuation
🧩 Final Thoughts:
AVAX is at a pivotal moment in its medium-term price structure. The breakout above the long-term downtrend line is a strong technical shift. A confirmed breakout and hold above $25.80 could trigger a multi-week or multi-month rally targeting $40 – $55+.
However, traders should be cautious of possible pullbacks and manage risk accordingly — especially as resistance zones from previous structures are being tested.
#AVAX #AVAXUSDT #CryptoBreakout #TechnicalAnalysis #Altcoins #BullishCrypto #DescendingTriangle #ReversalPattern #AVAXAnalysis
AVAXUSDTWe are bear-trend but wait for break trendline and pollback to 18.50$.
BINANCE:AVAXUSDT
Support: 16.90
Resistance: 18.50 - 21.30 - 25.50
⚠️Control money management.

$AVA/USDT is Heating Up Are We About to See a Big Move?NYSE:AVA is testing a key descending trendline on the 6H chart.
A breakout above this level could trigger strong upside momentum.
Immediate targets are $0.5605, $0.6237, and $0.6776 with the potential to reach $0.7690.
I'm watching for breakout confirmation.
DYOR, NFA.

AVAX/USDT Weekly Reversal Zone — Major Support Holding
🟨 CRITICAL ZONE (Key Support Area)
AVAX is currently trading within a major demand zone between $13.5–17.5, a historically strong support area that previously acted as the base for significant upward movements. Multiple weekly candles show rejection from this level, indicating buyer interest.
📊 Pattern Overview:
Double Bottom / Potential Triple Bottom:
The chart illustrates a clear double bottom structure, potentially forming a triple bottom, suggesting accumulation and reversal from the lows.
Bullish Projection Path:
The yellow arrow outlines a projected bullish impulse wave, targeting higher resistance levels if support holds.
📈 Bullish Scenario:
If AVAX maintains support at around $17.1:
1. Price may first test $20.25 (initial resistance).
2. A breakout above $20.25 could open the way to:
$24.98 (strong weekly resistance)
$32.75 (previous distribution zone)
$55.42 (major target/resistance zone)
3. In an extended bullish cycle, price could revisit:
$98.87, $110, and even $128.62 long term (2026+)
A confirmed breakout above $25 with strong volume would further validate the bullish case.
📉 Bearish Scenario:
If the $15–17 support zone breaks down:
1. Price could drop further to:
$11.00 (minor support)
$8.61 (historical low and weekly support)
2. This would indicate strong bearish pressure, potentially leading AVAX into a longer-term accumulation phase.
🔍 Conclusion:
This is a critical decision zone for AVAX. The technical structure shows signs of accumulation and possible trend reversal. However, if support fails, a deeper retracement could occur. Traders should watch this area closely for breakout or breakdown confirmations.
#AVAX #AVAXUSDT #Avalanche #CryptoReversal #TechnicalAnalysis #Altcoins #WeeklyChart #CryptoSupportZone #CryptoBreakout

#AVAX/USDT#AVAX
The price is moving within a descending channel on the 1-hour frame and is expected to break and continue upward.
We have a trend to stabilize above the 100 moving average once again.
We have a downtrend on the RSI indicator that supports the upward move with a breakout.
We have a support area at the lower limit of the channel at 17.22, acting as strong support from which the price can rebound.
Entry price: 17.54
First target: 17.92
Second target: 18.22
Third target: 18.62
