#AVAXUSDT: Targeting $60 Long Term View! Swing TradeThis crypto pair has a big potential of going back to its previous all time high, in our opinion price should reverse from $9 to $10 that area looks more appealing. We expect a swing volume to kick in the market.
Use accurate risk management while trading cryptocurrency. Like and comment for more.
Team Setupsfx_
Avaxusdtsignal

AVAX/USDT - Heads Into Major Demand Zone — Bounce or Breakdown?AVAX is currently standing at one of its most critical decision points since 2023. After failing to hold its multi-year ascending trendline, the price finally broke down and closed the weekly candle below the structural level at $15.7. This isn’t a normal correction — this is a signal that the market structure has shifted, and AVAX is entering a survival phase.
But the story is far from over. Price is now sliding into a zone that has historically acted as a deep accumulation region:
$10.7 – $8.5
This yellow block is where large-volume buyers previously stepped in during the 2022 crash and later consolidated before major moves.
The long wick sweeping into this zone indicates early buyer activity — but not enough to reclaim structural levels yet.
Right now, AVAX is in the middle of a high-timeframe battlefield between two major outcomes:
Bullish Reversal Scenario → Price reclaims $15.7 and climbs back above the broken trendline.
Bearish Breakdown Scenario → Price loses $10.7, falls deeper into the accumulation block, and risks testing historical lows near $5.7.
---
Bullish Scenario — (Reversal Trigger: $15.7)
A bullish reversal starts to form if AVAX can:
1. Bounce strongly from $10.7–$8.5, and
2. Close a weekly candle back above $15.7.
This would signal that significant accumulation has taken place and that smart money is re-entering the market.
Major upside targets become:
$20.80 → First structural resistance
$32.90 → Mid-range breakout
$54.30 → High-timeframe trend reversal confirmed
This is the “comeback path” for AVAX.
---
Bearish Scenario — (Breakdown Trigger: $10.7)
If AVAX fails to hold above $10.7 on the weekly, the long-standing demand zone collapses.
Downside implications:
Immediate drop toward $8.5
If $8.5 also breaks →
Price opens the door to a deeper decline toward the historical low around $5.7
This would confirm a major redistribution phase, not just a pullback.
---
Price Action & Market Structure
AVAX is forming lower highs and lower lows, confirming a weekly downtrend.
Breaking the ascending trendline marks a clear character shift.
The $10.7–$8.5 zone now acts as the final defense for bulls before entering a multi-year lower range.
Expect liquidity sweeps & stop hunts in this region — patience and weekly confirmation are key.
---
AVAX is now sitting inside a make-or-break zone that will determine its multi-month direction.
Hold $10.7–$8.5 → Potential strong reversal back toward $20–$30
Break below $10.7 → Deeper bearish continuation toward the $5.7 region
This is the type of price zone where professional traders wait for confirmation, not quick reactions.
---
#AVAX #Avalanche #CryptoTA #AVAXUSDT #TechnicalAnalysis #Altcoins #PriceAction #MarketStructure #CryptoOutlook #SupportAndResistance

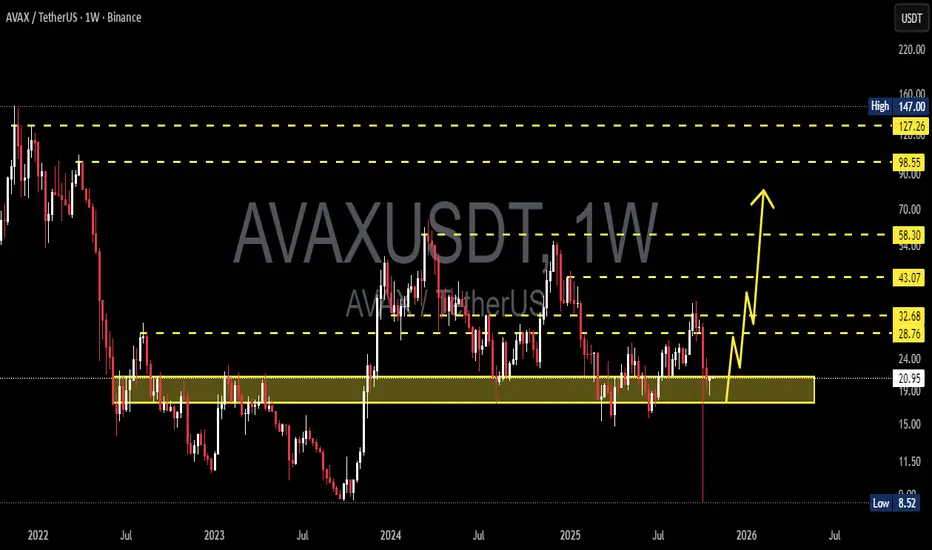
AVAXUSDT – Critical Support Zone: Will Decide the Next Trend?Yellow Block (Support Zone): 21 – 17.5 (Weekly)
This zone is the bulls’ last stronghold, an area that has historically marked AVAX’s major turning points. Price has now returned to this critical region — and what happens next could define the next macro trend.
---
Market Structure & Big Picture
After a long downtrend since 2022, AVAX has entered a macro consolidation phase, ranging between $17.5 and $43.
The current movement sits right at the bottom of this range, making the upcoming weekly close extremely important.
Major Range: 17.5 – 43
Key Support: 21 – 17.5
Main Resistance: 28.7 – 32.7 → 43.1 → 58.3
Historical High: 127 – 147
Historical Low: 8.5
This yellow zone isn’t just a technical area — it’s a battleground between long-term accumulation and potential distribution.
Every time AVAX touched this region in the past, price rebounded significantly, suggesting a possible mid-term reversal opportunity if bulls defend it again.
---
Pattern & Technical Characteristics
The chart currently shows a sideways accumulation pattern over more than a year.
Each retest of the 21–17.5 zone has produced deep wicks and strong rejections — signals of institutional absorption or smart money re-entry.
However, if this support fails, it could trigger a structural breakdown and re-open the path toward the lower double-digit region.
Potential pattern formations:
Double Bottom (Reversal) if price bounces and breaks above 28–33
Descending Channel Breakdown if price loses 17.5 with a confirmed close
---
Bullish Scenario – “Bounce From The Abyss”
If the weekly candle closes above 21, the support remains intact — and this could mark the start of a strong reversal swing.
Bullish confirmation signals:
Strong rejection with long lower wick
Rising volume during recovery
Weekly close > 24
Upside targets:
1. 28.7 → First resistance zone
2. 32.7 → Structural breakout confirmation
3. 43.1 → Major swing target
4. 58.3 → Mid-term continuation goal
Potential gain: 35% up to 170% from current levels if the bullish setup plays out.
---
Bearish Scenario – “Breaking the Last Line of Defense”
If the weekly close falls below 17.5, it confirms a macro breakdown.
AVAX could enter a new redistribution phase, targeting 12.0 – 9.0, and possibly 8.5 if a market-wide capitulation occurs.
Bearish confirmation signals:
Weekly close < 17.5
High-volume selling pressure
Failed retest (17.5 flips into resistance)
This would shift the macro bias fully bearish, and patient traders might wait for a new accumulation phase at much lower levels.
---
Conclusion & Macro Sentiment
AVAX currently sits in a golden decision zone — the line between collapse and recovery.
As long as the price holds above 21–17.5, the potential for a macro rebound remains strong.
But a confirmed breakdown below that area would signal that the accumulation phase isn’t over yet, and the market might need one final washout before a full recovery.
---
#AVAX #AVAXUSDT #CryptoAnalysis #TechnicalAnalysis #WeeklyChart #CryptoMarket #AltcoinAnalysis #TradingView #SwingTrading #SupportAndResistance #Avalanche #CryptoReversal #MarketStructure #CryptoUpdate
Will Avalanche (AVAX/USD) Steal the Spotlight in This Rally?💎 AVAX/USD | AVALANCHE vs US DOLLAR | Money Looting Plan 🎯
📌 Trade Bias: Bullish Swing / Day Trade
Hey Ladies & Gentlemen (Thief OG’s) — here’s the latest plan on AVAX/USD where we use the classic Thief Layer Strategy (multi-limit layering style).
Thief Strategy Plan
Entry Zone (Layering Style):
Multiple buy-limit layers around: 23.70 | 24.00 | 24.30 | 24.60
(You can increase or adjust layers based on your own setup)
Stop Loss (SL):
⛔️ This is the Thief SL @ 23.00
(Adjust SL depending on your risk appetite & strategy — this is not financial advice)
Target (TP):
🎯 Police barricade spotted — escape with the loot before getting caught!
Target Zone: 26.30
(Take profit at your own discretion, secure profits when satisfied)
📊 AVAX/USD Real-Time Data September 03
📈 24h Change: +2.67%
💰 Market Cap: ~$10.4B
🔄 24h Volume: ~$750M
🔗 Circulating Supply: 422M AVAX
😰 Fear & Greed Index
📊 Current Sentiment: Greed (60/100)
🔄 Trend: Stable (60 yesterday, 60 over past week)
💡 Interpretation: Investors are optimistic but not euphoric
🏛️ Fundamental & Macro Score
✅ Bullish Drivers
Octane Upgrade → Reduced fees by 43%, boosting adoption
Enterprise Adoption → FIFA NFTs & VanEck’s $100M RWA fund
Transaction Growth → Daily transactions up 66% weekly
Staking Demand → 48–53% supply locked, reducing circulation
❌ Bearish Risks
ETF Uncertainty → SEC decision still pending (volatility risk)
Staking Yields → Lower APY (1.2% flexible) vs competitors
Bitcoin Dominance → 57.8% limiting altcoin rallies
🌍 Overall Market Outlook
⚖️ Bull/Bear Score: 70% Bullish / 30% Bearish
🏦 Institutional Sentiment: Positive (ETF filings, RWA partnerships)
👥 Retail Sentiment: Cautiously optimistic (Greed Index at 60)
🎯 Summary
🔹 Short-Term: Bullish momentum
🔹 Medium-Term: Dependent on ETF decisions & subnet adoption
🔹 Risk Level: Moderate (watch Bitcoin dominance & macro trends)
🔎 Related Pairs to Watch
BITSTAMP:BTCUSD
BITSTAMP:ETHUSD
COINBASE:SOLUSD
COINBASE:LINKUSD
BITSTAMP:XRPUSD
✨ “If you find value in my analysis, a 👍 and 🚀 boost is much appreciated — it helps me share more setups with the community!”
#AVAX #Crypto #Altcoins #DayTrading #SwingTrade #LayeringStrategy #AVAXUSD #BullishSetup #CryptoTrading #ThiefTrader

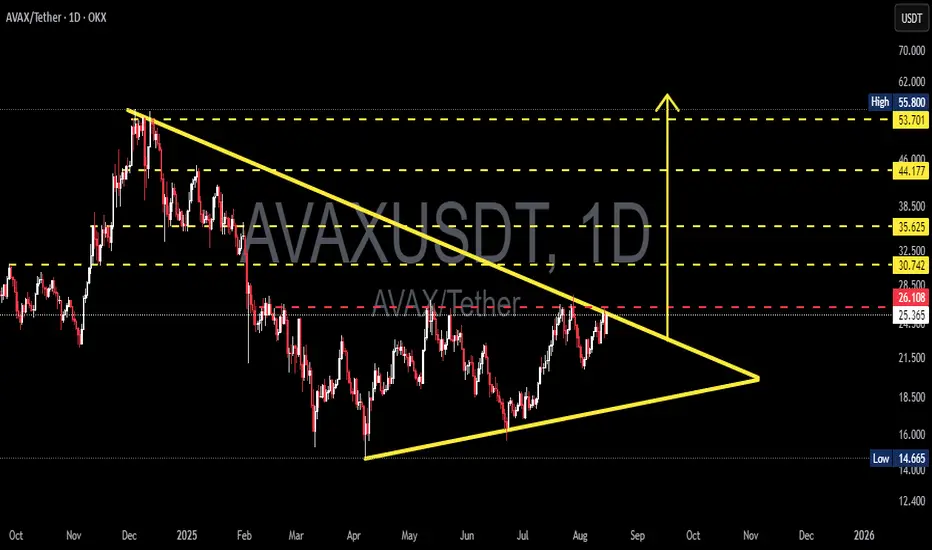
AVAX/USDT — Symmetrical Triangle Approaching Breakout?Overview:
The daily chart shows AVAX forming a symmetrical triangle (converging trendlines) since the Dec–Jan peak. Price is now testing the upper resistance trendline (~26.1 USDT) — we’re at a critical point heading toward the apex (late September). Volume behavior and a confirmed daily candle close will be key to determining the breakout direction.
---
1) Pattern Description
Pattern: Symmetrical Triangle — characterized by lower highs (descending resistance line from the peak) and higher lows (ascending support line from the April bottom). Price range is narrowing → volatility dropping → usually leads to a strong move when the pattern resolves.
Context: The broader trend before the triangle was bearish (drop from ~55.8). Symmetrical triangles can be neutral but often resolve in the direction of the prior trend — technical confirmation is essential.
---
2) Key Levels (from chart)
Upper resistance trendline / critical level: ~26.10 USDT (red dashed line), current price ≈ 25.3 USDT.
Major resistance targets: 30.74, 35.62, 44.18, 53.70 – 55.80.
Ascending support trendline: around 18–22 USDT depending on timing.
Structural low: 14.665 USDT (chart low).
(Values estimated visually from chart — verify with live data before trading.)
---
3) Bullish Scenario (if breakout upward)
Bullish Trigger
Daily close above descending trendline (~26.1) with strong volume → breakout confirmation.
Preferably supported by bullish technical indicators (RSI, MACD bullish crossover, rising OBV).
Targets
Step targets: 30.7 → 35.6 → 44.2 → 53.7 (partial profit-taking recommended).
Measured move theoretical target:
− Height ≈ 55.800 − 14.665 = 41.135.
− Added to breakout point (~26.108) → theoretical target ≈ 67.24 USDT (for reference, not guaranteed).
Risk Management
Stop-loss: daily close back below breakout trendline or under nearest swing low (e.g., conservative SL < 21–22 USDT).
Strategy: scale in — partial entry before breakout, add after confirmation. Monitor risk/reward closely.
---
4) Bearish Scenario (if rejected / breakdown)
Bearish Trigger
Rejection at upper trendline + bearish daily candle (and/or rising sell volume) → drop to ascending support.
Breakdown confirmation: daily close below ascending trendline with strong volume.
Targets
Initial drop to ascending support ~18–22 USDT.
If breakdown continues → possible retest of 14.66 USDT low.
Risk Management for Shorts / Cut-loss
SL for shorts: daily close above resistance (~>28 USDT) or above fake breakout highs.
Beware of bull traps — volume confirmation reduces risk.
---
5) Practical Trade Plans (example)
Conservative Long: Wait for daily close > 26.1 + strong volume → enter 50% position; add after retest. Targets: 30.7 / 35.6. SL under retest zone (~21–22).
Conservative Short: If clear rejection at upper trendline → short toward lower trendline. SL above recent high (~28).
Range Trading: Buy near lower trendline, sell near upper trendline until breakout confirmed.
---
6) Risk & Confluence Checks
Broader market/Bitcoin sentiment: AVAX is often correlated, which can amplify moves.
Supporting indicators: check volume, RSI, MACD, EMA(50/200) for confirmation.
Watch for false breakouts — confirm with volume + retests.
---
7) Summary
> AVAX is forming a Symmetrical Triangle. Critical resistance at ~26.1 USDT — daily close + volume will decide the next move. Valid breakout → step targets at 30.7 / 35.6 / 44.2 (measured move theoretical ~67.2). Rejection / breakdown → support at 18–22 and possible drop to 14.66. Manage risk with confirmation, stop-loss, and partial profit-taking.
#AVAX #AVAXUSDT #Crypto #TechnicalAnalysis #Triangle #Breakout #SupportResistance #Altcoin #SwingTrading
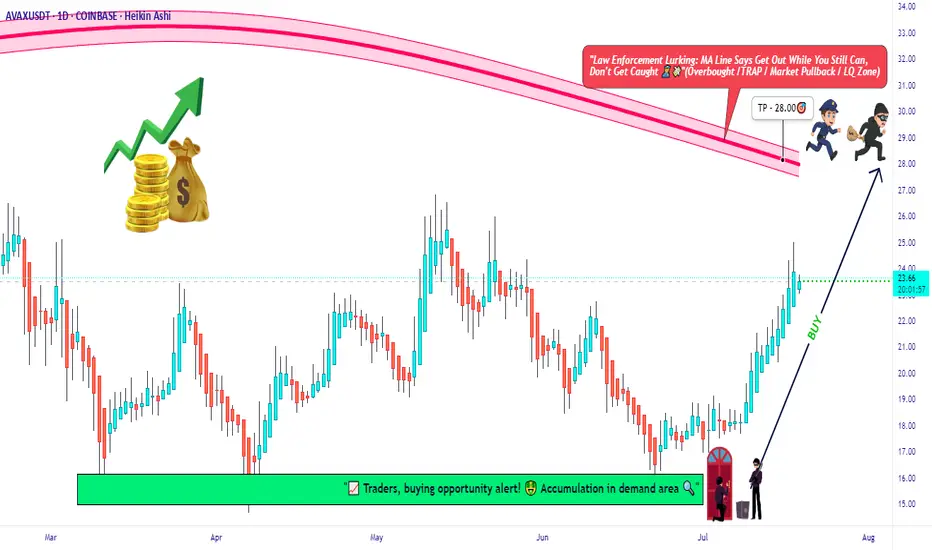
AVAX Long Only | Moving Average Trap Heist in Action🧨“Avalanche Crypto Vault Break-In 💣 | Thief Trader’s Long Playbook”⚔️💸🚀
(AVAX/USDT Crypto Heist Plan – Swing/Day Trade Blueprint)
🌍 Hi! Hola! Ola! Bonjour! Hallo! Marhaba! 🌟
Welcome, Money Makers, Market Pirates, and Chart Snipers! 🤑💰💼✈️
This ain’t just another setup — this is a strategic crypto ambush on AVAX/USDT, cooked up with the 🔥 Thief Trading Playbook 🔥. We're planning a clean, no-fingerprint heist into the Red Moving Average Zone. That’s the liquidity vault, and yes — the police (market makers) are watching 👮♂️🚨... but so are we. Stay sharp. 💼🔦
💥 Mission Objectives:
🎯 Entry Point (The Infiltration Point)
"The vault's wide open! Swipe the Bullish loot at any decent price" 📈
Smart thieves wait for pullbacks on the 15m or 30m chart to plant their limit orders near swing lows/highs. Use layered orders (DCA style) to scale in like a pro. 💣🔁
🛑 Stop Loss (Your Getaway Exit)
Secure your trade. SL at the nearest wick low/high on the 1D timeframe (around 21:00 candle).
Your SL = your personal risk code. Choose it based on lot size & how deep you're inside the vault. 🎭🚫
🏴☠️ Take Profit Target (The Treasure Room)
🎯 Target: 28.00 USDT
...or escape early if the heat (volatility) gets too intense. Protect the bag. 💼💰
⚡ Special Note for Scalpers:
🧲Only operate on the Long Side.
If you’ve got deep pockets, smash in directly. Otherwise, ride with swing bandits. Use trailing SL to secure stolen profits. 🧨📉📈
🔍 Market Heat Map & Rationale:
The AVAX/USDT setup is flashing bullish strength, backed by:
🧠 On-Chain Metrics 📊
💡 Market Sentiment
📰 Macro Catalysts
🌐 Intermarket Synchronicity
📡 Go grab the full breakdown on:
⚠️ Red Alert: News Zones Ahead! 📰🚫
Avoid fresh trades during high-volatility news releases.
Lock in gains with trailing SL. Risk management is not optional — it’s the escape vehicle. 🚗💨
📝 Legal Talk (Don’t Skip):
This isn’t investment advice. Just a well-planned blueprint from a market thief.
You're responsible for your own loot and losses. 🎭📉📈
❤️ Boost the Brotherhood 💥
Smash the 🔥BOOST BUTTON🔥 if you found value.
Every boost powers our Thief Trading Gang’s next big score. 🚀💸
Stay tuned for the next heist plan. I’ll be back with more charts, more loot, and less mercy. 🐱👤📊💥
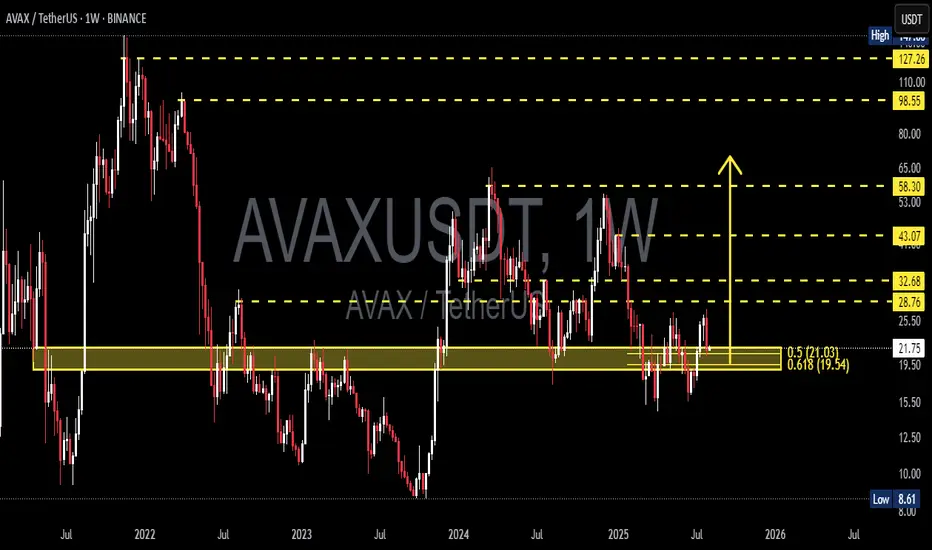
AVAX at the Edge: Golden Pocket Support or Breakdown Incoming?🧠 Overview:
AVAX is currently trading at a decisive support zone, aligned perfectly with the Fibonacci golden pocket (0.5–0.618) at $21.03–$19.54. This level has historically acted as a strong pivot zone, serving both as resistance during bear markets and support in bullish recoveries.
The market has compressed into this key demand zone after a prolonged sideways structure. Now, all eyes are on how price will react — this zone will likely determine AVAX's mid-to-long-term trend.
---
🔍 Key Technical Highlights:
🔸 Fibonacci Confluence Zone (Golden Pocket):
0.5 Fib Level: $21.03
0.618 Fib Level: $19.54
This area coincides with a weekly demand block — a high-probability reversal zone where buyers have historically stepped in.
🔸 Major Resistance Levels to Watch:
$28.76 – First significant supply zone.
$32.68 – Previous lower high, potential breakout confirmation zone.
$43.07 – Weekly structure resistance.
$58.30 – Mid-term bullish target.
🔸 Support Levels Below:
$15.00 – Local base during early 2023.
$8.61 – Multi-year low (critical support if demand collapses).
🔸 Structure Insight:
Price is currently forming a macro higher low, suggesting a potential accumulation phase. However, failure to hold this zone could trigger a bearish continuation.
---
🚀 Bullish Scenario:
If price sustains above $19.54–21.03 and breaks above $25.50, the following upside targets could be reached:
1. $28.76 – Local resistance
2. $32.68 – Break of bearish structure
3. $43.07 – Momentum extension
4. $58.30 – Bullish macro target
Catalyst to watch: Weekly bullish engulfing candle + volume spike + break of structure → these would confirm buyers are in control.
---
🔻 Bearish Scenario:
If the price breaks below $19.54 with strong bearish volume, then:
1. $15.00 – First zone of interest for buyers
2. $8.61 – Critical long-term support zone
This would confirm a distribution pattern and signal that the market may revisit lower accumulation zones before any major uptrend resumes.
---
🧩 Market Psychology Insight:
This current range is where smart money positions themselves — either for continuation or reversal. Retail traders often get shaken out in this kind of compression. Stay patient and wait for confirmation rather than anticipation.
---
🎯 Conclusion:
AVAX is now at a make-or-break point. With the price sitting in a high-confluence demand zone, traders should prepare for volatility and monitor weekly closes. A strong move in either direction will likely determine the next multi-week trend.
> “The bigger the base, the higher in space.” – If this is true accumulation, the upside could surprise many.
#AVAX #AVAXUSDT #CryptoTechnicalAnalysis #AltcoinWatch #FibonacciLevels #SupportResistance #BullishOrBearish #SmartMoneyZone #WeeklyChart #CryptoTrading #BreakoutOrBreakdown
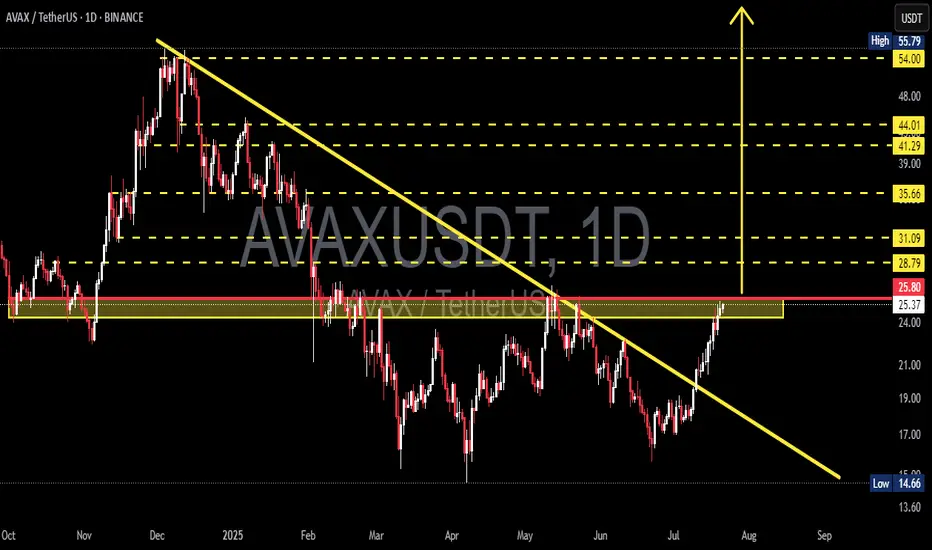
AVAX/USDT Massive Trend Reversal: Breakout from 8-Month DowntrenAVAX has just delivered one of its most technically significant moves in recent months. After spending over 8 months trapped under a descending resistance line, price action has finally broken free — suggesting a potential trend reversal and the beginning of a much larger bullish phase.
🧠 Pattern & Structure Breakdown:
📌 Descending Trendline Breakout
AVAX had been forming a descending triangle pattern, characterized by consistent lower highs and a horizontal support zone between $14.66 – $22. The recent bullish breakout from this structure, accompanied by strong volume, is a highly encouraging sign for bulls.
📌 Accumulation Zone Identified
The yellow zone on the chart ($14.66 – $22) has proven to be a strong demand zone where buyers consistently stepped in. The recent rally originates from this base, indicating possible institutional accumulation.
📌 Critical Horizontal Resistance at $25.80
Price is now testing the $25.80 resistance zone, which historically acted as a supply area. A successful daily close and confirmation above this level would officially flip the structure bullish.
📈 Bullish Scenario – Multi-Level Upside Targets:
If AVAX confirms the breakout above $25.80, these are the key bullish targets ahead:
🎯 Target 1: $28.79 – minor resistance & potential short-term TP zone
🎯 Target 2: $31.09 – previous price equilibrium
🎯 Target 3: $35.66 – key pivot from past market structure
🎯 Target 4: $41.29 and $44.01 – heavy historical supply zones
🎯 Target 5 (measured move): $54.00 to $55.79 – the projected breakout target from the descending triangle pattern
This move would represent a full technical recovery if AVAX aligns with broader market sentiment and Bitcoin remains stable or bullish.
📉 Bearish Scenario – Pullback Risks:
On the flip side, if price fails to sustain above $25.80 and gets rejected:
⚠️ A retest of $24.00 – $22.00 is likely
⚠️ If that zone breaks down, next support lies at $19.00 – $17.00
⚠️ A loss of the $17 level may trigger a return to the critical low near $14.66
This would invalidate the bullish breakout and return AVAX into a sideways or downward consolidation phase.
🔍 Additional Technical Insights:
✅ Volume is steadily increasing — showing renewed buying pressure
✅ Indicators like RSI and MACD (if applied) are likely showing bullish divergence
✅ Overall altcoin sentiment is improving, providing a tailwind for AVAX's potential breakout continuation
🧩 Final Thoughts:
AVAX is at a pivotal moment in its medium-term price structure. The breakout above the long-term downtrend line is a strong technical shift. A confirmed breakout and hold above $25.80 could trigger a multi-week or multi-month rally targeting $40 – $55+.
However, traders should be cautious of possible pullbacks and manage risk accordingly — especially as resistance zones from previous structures are being tested.
#AVAX #AVAXUSDT #CryptoBreakout #TechnicalAnalysis #Altcoins #BullishCrypto #DescendingTriangle #ReversalPattern #AVAXAnalysis
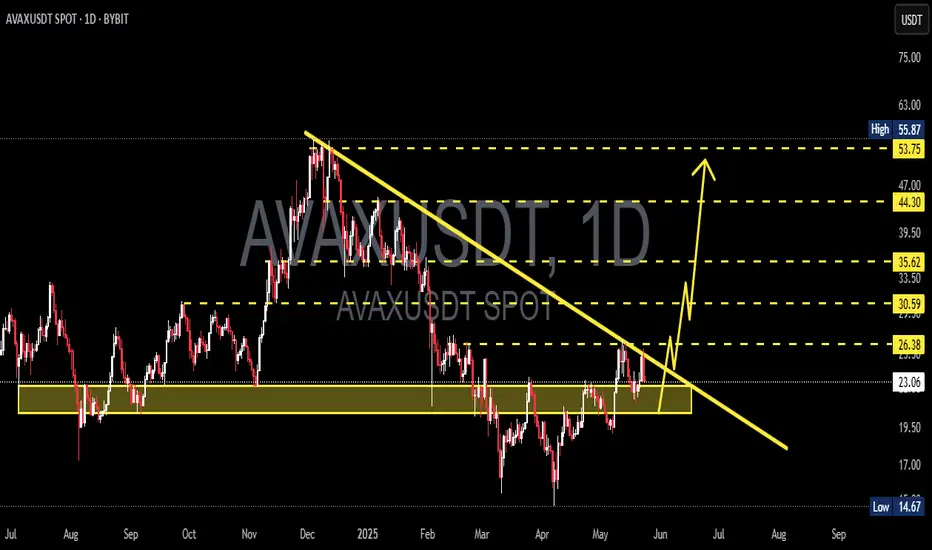
AVAX/USDT Weekly Reversal Zone — Major Support Holding
🟨 CRITICAL ZONE (Key Support Area)
AVAX is currently trading within a major demand zone between $13.5–17.5, a historically strong support area that previously acted as the base for significant upward movements. Multiple weekly candles show rejection from this level, indicating buyer interest.
📊 Pattern Overview:
Double Bottom / Potential Triple Bottom:
The chart illustrates a clear double bottom structure, potentially forming a triple bottom, suggesting accumulation and reversal from the lows.
Bullish Projection Path:
The yellow arrow outlines a projected bullish impulse wave, targeting higher resistance levels if support holds.
📈 Bullish Scenario:
If AVAX maintains support at around $17.1:
1. Price may first test $20.25 (initial resistance).
2. A breakout above $20.25 could open the way to:
$24.98 (strong weekly resistance)
$32.75 (previous distribution zone)
$55.42 (major target/resistance zone)
3. In an extended bullish cycle, price could revisit:
$98.87, $110, and even $128.62 long term (2026+)
A confirmed breakout above $25 with strong volume would further validate the bullish case.
📉 Bearish Scenario:
If the $15–17 support zone breaks down:
1. Price could drop further to:
$11.00 (minor support)
$8.61 (historical low and weekly support)
2. This would indicate strong bearish pressure, potentially leading AVAX into a longer-term accumulation phase.
🔍 Conclusion:
This is a critical decision zone for AVAX. The technical structure shows signs of accumulation and possible trend reversal. However, if support fails, a deeper retracement could occur. Traders should watch this area closely for breakout or breakdown confirmations.
#AVAX #AVAXUSDT #Avalanche #CryptoReversal #TechnicalAnalysis #Altcoins #WeeklyChart #CryptoSupportZone #CryptoBreakout

AVAXUSDT 1W AnalysisAVAX ~ 1W Analysis
#AVAX Buy from here if you still have confidence in this coin with a short term target of at least 20%+, long term target $55

Avalanche (AVAX) Price at Key Resistance – Potential Short Setup📉 AVAX/USDT – Possible Bearish Setup Developing 📉
Currently watching Avalanche (AVAX) paired with USDT 🔍, and price action is starting to show signs of bearish momentum creeping in.
We’ve seen a subtle shift to the downside, and I'm anticipating the potential for further weakness into the end of the week 📆🔻.
Here’s what I’m looking for:
🔹 A pullback into resistance — specifically the level highlighted in the video
🔹 A rejection and failure to break above that resistance zone
🔹 A bearish break of market structure following the rejection
If these conditions are met, I’ll be considering a short opportunity aligned with the developing trend 🔄📊.
🎯 As always, patience and precision are key — I’m not acting until price confirms the setup.
⚠️ Disclaimer: This is not financial advice. The content shared is for educational purposes only. Always conduct your own analysis and manage your risk appropriately.

AVAXUSDT 1D AnalysisAVAX ~ 1D Analysis
#AVAX Buy gradually from here if you still have confidence in this coin with a short term target of at least 10%+ from here.
AVAXUSDT 1DAVAX ~ 1D Analysis
#AVAX Buy after successfully penetrating this resistant line with a short -term target of at least 10%+.

#AVAXUSDT: Three Swing Buy Take Profit EntriesThe cryptocurrency market has experienced volatility in recent months, particularly with the #AVAXUSDT token. We have identified two potential price reversal points:
1. **Current Price Range:** The market is currently experiencing a surge in volume, indicating a potential reversal.
2. **Liquidity Removal and Reversal:** If the price were to remove liquidity and subsequently reverse at its previous low, it could trigger a significant price drop.
Additionally, we recommend setting three targets based on your analysis to guide your trading decisions.
We extend our sincere gratitude for your unwavering support since the beginning. We anticipate that this support will continue to grow and evolve.
Team Setupsfx_
🚀❤️

AVAXUSDT 1WAVAX ~ 1W Analysis
#AVAX Buy gradually from here if you still have a Conviction on this coin with a short -term target of at least 20%+.

AVAXUSDT 1WAVAX ~ 1W Analysis
#AVAX Buy gradually from here if you still have a Conviction on this Coin. with a minimum target of 20%+.

AVAXUSDT 1WAVAX ~ 1W
#AVAX So far it is still maintaining its bullish structure. buy in stages with a minimum target of 20%++

AVAXUSDT 1WAVAX ~ 1W
#AVAX If you still have Conviction on the coin,. buy gradually on this support block,. Or you can buy this coin after successfully breaking through this resistance line.
these two scenarios with a minimum target of 20%+

AVAXUSDT Approaching Ascending Triangle ResistanceAVAXUSDT Technical analysis update
AVAXUSDT is forming an ascending triangle in the middle of an uptrend. The price is currently moving towards the triangle's resistance, with the 100 EMA acting as support at the triangle's bottom on the 4-hour chart. Once a breakout occurs, a strong bullish move can be expected in AVAX.
Buy Level: Above $37.00
Stop Loss: 33.00

AVAXUSDTAVAX ~ 1W
#AVAX Buy gradually on this support block,. If you still have Conviction on this coin. with a minimum target of 20%+. This is a fundamentally strong layer 1 coin.

AVAX → Avalanche Falls to $22! Heading Back to $50?Since my May 18th update, AVAX has fallen into a pullback, as expected. We found resistance at $41.80, took half profits, and then pulled back in two strong legs. Should we be bearish or bullish on Avalanche?
How do we trade this? 🤔
As expected, AVAX found resistance at the 2021/2022 resistance area of $60.00 after three strong pushes up followed by a head and shoulders reversal pattern. That reversal pattern played out into a two-legged pullback, leaving us near Push #1 support at around $25.00. I think we can expect to continue testing this support area for a while. I do not believe we will break and hold below $25.00.
I would not enter a long yet unless you're fading into your total position size. What we need now is two or three tests of the Push #1 support area between $23.00 and $25.00, forming a double-bottom or reverse head and shoulders pattern. A good strong bull signal candle followed by a confirmation candle is the signal we need to enter a long position, taking half profits at 1:1 Risk/Reward, moving the stop loss up to the entry price, then swinging the latter half of the position to 1:3 Risk/Reward.
We also need to watch Bitcoin's sentiment as the price action plays out. I expect Bitcoin will fall into a two-legged pullback to around $40,000-$45,000, which should take the alt market down with it, either keeping it in a trading range or bringing it to lower lows. Until Bitcoin's sentiment shows a clear bull signal after a likely pullback, it's one more indicator we should allow to play out before getting long in AVAX.
A final point of data is the RSI low and below the moving average of around 42.00, which could remain in this area for some time. This indicates we should be looking for long entries, but should wait for the price action to guide us.
💡 Trade Idea 💡
Long Entry: $27.00
🟥 Stop Loss: $21.33
✅ Take Profit #1: $32.70
✅ Take Profit #2: $44.00
⚖️ Risk/Reward Ratio: 1:3
🔑 Key Takeaways 🔑
1. Three legs up into a resistance zone after a breakout
2. Head and Shoulders reversal pattern
3. Two-legged pullback to Push #1 Support
4. Wait for a double-bottom followed by a strong signal and confirmation candles
5. RSI at 42.00 and below the moving average. Supports waiting for a long entry.
💰 Trading Tip 💰
The longer a trend continues after 3 legs, the probability of that trend continuing lessens. Because of this decreased probability, we ought to reduce our risk when entering trades.
⚠️ Risk Warning! ⚠️
Past performance is not necessarily indicative of future results. You are solely responsible for your trades. Trade at your own risk!
Like 👍 and Follow to learn more about:
1. Reading Price Action
2. Chart Analysis
3. Trade Management
4. Trading Psychology

AVAXUSDT 1WAVAX ~ Update
#AVAX Bouncing right at the support we expected.
If BITSTAMP:BTCUSD does not experience another decline, This will be a continued Increase in the future.

#AVAXUSD: On the way to 66.00, Buy Swing! Dear Traders,
Hope you are doing great, we have an excellent buying opportunity in form of AVAXUSD which is crypto pair with high potential, we can see price filling the imb zone and reversing from that area. Our main aim here is to wait for price to breakthrough the solid bearish trendline, and then enter when price does confirmation.
Team Setupsfx_
